Washington, D.C. and Cary, North Carolina offer distinctive lifestyles with varying features. Washington, D.C., the U.S. capital, boasts a bustling, cosmopolitan atmosphere with renowned national landmarks and attractions. Cary, a suburb of Raleigh, offers a quieter, family-friendly environment with a focus on safety and education. In consideration of these factors, individuals and families looking to relocate or simply visit either city will find unique opportunities and challenges.
Distance between
Washington, DC and
Cary, NC : 237.8 miles
Washington's population is larger by 279%. Its population has grown by 97,991 people (17.1%) since 2000. The population of Cary has grown by 82,451 people (87.2%) during that time.
Washington, D.C. experiences higher overall crime rates compared to Cary. While the city carries out constant efforts to improve safety, crime is a significant concern in certain neighborhoods. As a major city, it is essential to stay aware of one's surroundings, especially at night. On the other hand, Cary is consistently recognized as one of the safest cities in the U.S. Its crime rate is much lower than the national average, providing a secure environment, especially for families and the elderly.
City-data.com crime index counts serious crimes and violent crime more heavily. It adjusts for the number of visitors and daily workers commuting into cities. (higher means more crime, U.S. average = 301.1)
City-data.com crime index counts serious crimes and violent crime more heavily. It adjusts for the number of visitors and daily workers commuting into cities. (higher means more crime, U.S. average = 301.1)
Sex Offenders
According to our data, there are 1,058 registered sex offenders living in Washington and 43 registered sex offenders living in . The ratio of residents to sex offenders in Washington is 644 to 1; the ratio in Cary is 3,814 to 1. The number of registered sex offenders compared to the number of residents is much larger in Washington than that in Cary.
Cost of Living
Living in Washington, D.C. is significantly more expensive than in Cary. Almost all expenses, including housing, groceries, and transportation, are higher in the U.S. capital. Cary, despite its high quality of life, offers a more affordable cost of living. Its housing costs are particularly lower than in Washington, D.C.
Income Tax
Washington, D.C. has a progressive income tax rate that can go up to 8.95%, depending on the income level. North Carolina, where Cary is located, utilizes a flat income tax rate of 5.25%.
Property Tax
Residents in Washington, D.C. generally pay a lower property tax rate than those in Cary, NC. However, given the high property values in D.C., actual property tax payments may be higher.
Sales Tax
Washington, D.C. has a relatively high sales tax rate at 6%. Cary, on the other hand, has a lower sales tax rate, with North Carolina's combined state and local rate typically hovering around 7%.
Income
Type
Washington
Cary
Estimated median household income
$90,088
$123,857
Estimated per capita income
$65,808
$58,024
Cost of living index (U.S. average is 100)
124.2
94.7
If you make $50,000 in Cary, you will have to make $65,576 in Washington to maintain the same standard of living.
Geographical Conditions
Washington, D.C. is located on the Potomac River, near the Atlantic Ocean, giving it a mix of urban and natural settings. Cary is inland, known for its verdant landscapes with numerous parks and trails.
Both Washington, D.C. and Cary offer high-quality education. Washington, D.C. houses renowned universities, such as Georgetown University and George Washington University, and has a strong public school network. Cary is part of the Research Triangle region, known for its exceptional schools and universities. The school district in Cary is ranked among the best in North Carolina.
Washington, D.C.'s economy is robust, driven primarily by the federal government. The city also has a thriving private sector with an emphasis on law, business services, and education. Cary's economy is a part of the diverse Raleigh-Durham metroplex, attracting industries from biotechnology to software development. Economic growth in both cities continues, offering varied opportunities for job seekers.
Biggest Employers
The federal government is the largest employer in Washington, D.C. Other significant employers include MedStar Health and George Washington University. In Cary, the largest employers include tech giant SAS Institute, WakeMed Health, and Verizon Wireless.
There were 376 building permits issued in Washington in 2012 (149 more than in 2011) compared to 964 building permits issued in Cary in 2012 (6 less than in 2011).
In Washington (District of Columbia), 90.9% voted for Democrats and 7.3% for Republicans in 2012 Presidential Election. In Cary (Wake County), 54.9% voted for Democrats and 43.5% for Republicans.
Elections
Type
Democrats
Republicans
Other
Year
Washington
Cary
Washington
Cary
Washington
Cary
2020
92.6%
62.3%
5.4%
35.9%
2.0%
1.8%
2016
90.9%
57.4%
4.1%
37.2%
5.0%
5.5%
2012
90.9%
54.9%
7.3%
43.5%
1.8%
1.6%
2008
92.5%
56.8%
6.5%
42.3%
1.0%
0.9%
2004
89.6%
48.7%
9.4%
50.9%
1.0%
0.4%
2000
85.2%
46.1%
9.0%
53.2%
5.9%
0.7%
1996
85.2%
45.9%
9.3%
48.2%
5.5%
5.9%
Breakdown of population affiliated with a religious congregation
Type
Adherents
Congregations
Religion
Washington
Cary
Washington
Cary
CATHOLIC CHURCH
12.6%
11.0%
7.4%
2.4%
AMERICAN BAPTIST CHURCHES IN THE USA
6.2%
0.4%
10.3%
0.6%
SOUTHERN BAPTIST CONVENTION
4.4%
9.0%
10.3%
22.5%
EPISCOPAL CHURCH
3.1%
1.1%
5.3%
1.8%
SEVENTH DAY ADVENTIST CHURCH
0.9%
0.2%
1.8%
1.0%
MUSLIM ESTIMATE
0.7%
1.1%
1.1%
1.0%
EVANGELICAL LUTHERAN CHURCH IN AMERICA
0.5%
0.6%
2.1%
1.1%
LUTHERAN CHURCH
0.1%
0.4%
0.3%
0.6%
Weather
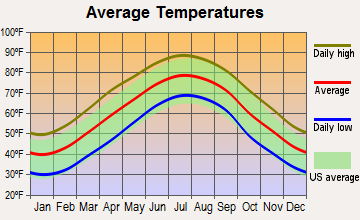
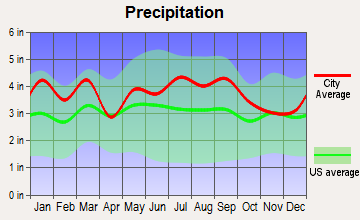
Washington, D.C. experiences all four seasons with hot, humid summers and cold winters. The city gets an average of 40 inches of rain per year, slightly more than the national average. Cary, however, has a more moderate climate with mild winters and hot summers. It is also less humid than Washington, D.C. making it more comfortable during summer months.
Weather and climate
Type
Washington
Cary
Temperature - Average
56.4°F
59.9°F
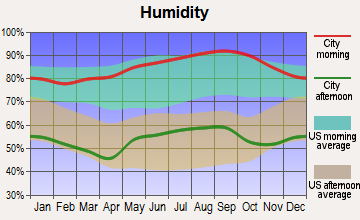
Humidity - Average morning or afternoon humidity
68.8%
73.7%
Humidity - Differences between morning and afternoon humidity
33%
44%
Humidity - Maximum monthly morning or afternoon humidity
81%
90%
Humidity - Minimum monthly morning or afternoon humidity
48%
46%
Precipitation - Yearly average
42.7 in
44.8 in
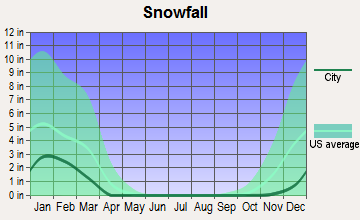
Snowfall - Yearly average
32.4 in
13.4 in
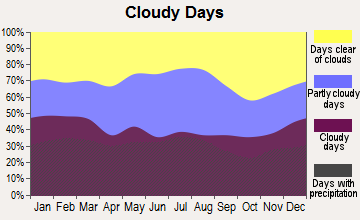
Clouds - Number of days clear of clouds
15.9%
18.5%
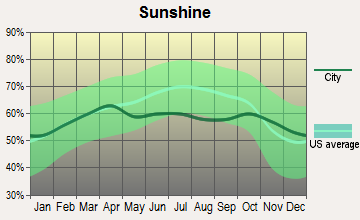
Sunshine amount - Average
61.5%
63.9%
Sunshine amount - Differences during a year
21%
13%
Sunshine amount - Maximum monthly
66%
64%
Sunshine amount - Minimum monthly
45%
51%
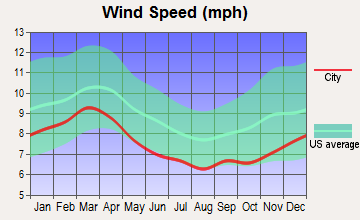
Wind speed - Average
9.7 mph
7.1 mph
Average climate in Washington, District of Columbia
Average climate in Cary, North Carolina
Air pollution
Type
AQI
CO
NO2
OZONE
PB
PM10
PM25
SO2
Year
Washington
Cary
Washington
Cary
Washington
Cary
Washington
Cary
Washington
Washington
Cary
Washington
Cary
Washington
Cary
2018
88
71
0.32
0.23
11.6
8.1
23.2
27.6
N/A
N/A
16.4
14.2
8.8
9.2
0.8
0.2
2017
84
70
0.32
0.23
12.3
8.7
24.9
25.8
N/A
N/A
16.5
14.1
9.8
9.1
1.0
0.2
2016
98
80
0.43
0.23
14.7
8.6
24.6
26.6
0.002
N/A
17.2
8.6
9.5
9.7
1.0
0.3
2015
91
79
0.34
0.27
14.8
8.9
26.2
25.9
0.002
N/A
17.0
12.4
10.4
10.3
1.3
0.4
2014
85
74
0.33
0.26
11.6
9.8
25.9
27.6
0.002
N/A
17.1
N/A
10.0
10.1
1.0
0.4
2013
88
72
0.34
0.26
11.7
N/A
25.6
24.3
0.002
N/A
17.3
N/A
11.6
9.7
1.0
0.3
2012
103
79
0.58
0.28
15.2
N/A
27.6
27.0
0.002
N/A
N/A
N/A
12.2
9.1
1.6
0.6
2011
105
84
0.67
0.27
15.4
N/A
27.7
30.1
0.002
N/A
N/A
N/A
11.4
10.1
3.1
0.7
2010
114
90
0.88
0.30
15.9
N/A
29.3
28.4
0.003
N/A
N/A
N/A
9.3
10.7
3.4
1.0
2009
90
77
0.86
0.31
16.2
N/A
24.4
25.0
0.002
N/A
N/A
N/A
7.6
10.2
4.6
1.0
2008
103
98
1.23
0.37
16.2
N/A
25.3
29.5
0.003
N/A
N/A
N/A
8.5
12.7
5.6
1.5
2007
113
97
1.17
0.40
16.8
N/A
27.1
33.0
0.004
N/A
N/A
N/A
10.4
13.9
5.1
1.2
2006
114
89
1.11
0.43
17.2
N/A
25.5
29.3
0.004
N/A
N/A
N/A
10.9
13.5
4.5
0.9
2005
105
78
0.86
0.40
20.5
N/A
22.7
30.6
0.006
N/A
N/A
N/A
11.7
N/A
4.5
2.5
2004
113
79
0.62
0.41
21.3
N/A
20.6
27.1
0.004
N/A
N/A
N/A
11.3
N/A
6.5
2.6
2003
108
80
0.90
N/A
23.6
N/A
20.8
31.0
N/A
N/A
N/A
N/A
12.2
N/A
8.3
3.0
2002
125
89
1.16
N/A
23.7
N/A
25.0
36.5
N/A
N/A
N/A
N/A
N/A
N/A
6.7
2.6
2001
113
79
1.07
N/A
23.9
N/A
22.0
35.9
0.017
N/A
N/A
N/A
N/A
N/A
6.7
1.9
2000
115
115
1.17
0.65
20.2
N/A
19.1
36.6
N/A
N/A
N/A
N/A
N/A
N/A
8.2
N/A
Natural disasters
Type
Washington
Cary
Tornado activity compared to U.S. average
110.6%
94.4%
Earthquake activity compared to U.S. average
42.9%
54.1%
Natural disasters compared to U.S. average
19%
18%
Transportation
Washington, D.C. has a comprehensive public transportation system with the Metrorail and Metrobus. The city also has a well-developed network of biking lanes. Cary, while having bus services, relies more on personal vehicles for commuting. Its infrastructure is designed to accommodate vehicle traffic with extensive highways and interstates.
Transport
Type
Washington
Cary
Amtrak stations
1
1
Amtrak stations nearby
3
3
FAA registered aircraft
456
104
FAA registered aircraft manufacturers and dealers
3
0
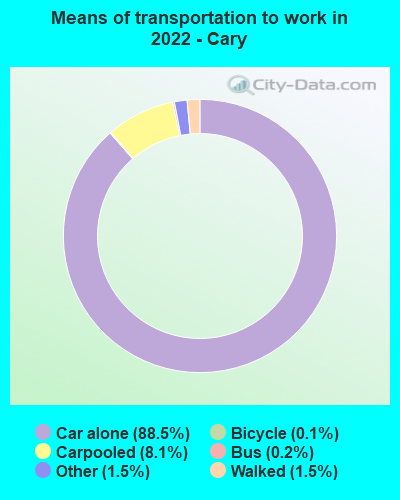
Means of transportation to work
Type
Washington
Cary
Bicycle
2%
0.1%
Bus
6.3%
0.2%
Carpooled
7.8%
9%
Car alone
62.5%
88.2%
Railroad
0.3%
0%
Streetcar
10.6%
0%
Subway
1.3%
0%
Taxicab
0.8%
0.1%
Walked
5.7%
1.4%
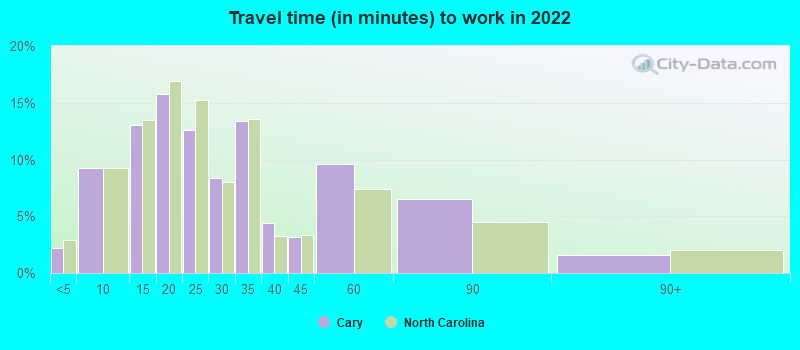
Average travel time to work
Type
Washington
Cary
Average
39.2 min
28.6 min
Other means
26 min
23.1 min
Public transportation
38.9 min
40 min
Private vehicle occupancy
Type
Washington
Cary
Average
1.1
1.1
Drove alone
89.4%
91.1%
In 2 person carpool
9.7%
6.8%
In 3 person carpool
0.6%
1.2%
In 4 person carpool
0.4%
0.3%
In 5-6 person carpool
0%
0.3%
In 7+ person carpool
0%
0.2%
How many people usually rode to work in the car, truck or van.
Real Estate
Washington, D.C.'s real estate is expensive with a median home cost significantly higher than the national average. Cary's real estate is more affordable in comparison, with high-quality homes that cater to diverse budgets.
Neighborhoods
Washington, D.C. offers neighborhoods with diverse characteristics, ranging from bustling downtown areas to quieter, residential surroundings. Popular neighborhoods include Georgetown and Capitol Hill. Cary is primarily residential with numerous family-friendly neighborhoods.
Houses and residents
Type
Washington
Cary
Houses
357,482
69,951
Average household size (people)
2.1
2.6
Median year apartment built
1965
2003
Median year house/condo built
1941
1999
Length of stay in the house since moving in
13.5 years
11 years
Houses occupied
319,565 (89.4%)
65,254 (93.3%)
Houses occupied by owners
132,936 (41.6%)
44,779 (68.6%)
Houses occupied by renters
186,629 (58.4%)
20,475 (31.4%)
Median rent asked for vacant for-rent units
$2,791
$1,793
Median monthly housing costs
$1,817
$1,567
Median price asked for vacant for-sale houses and condos
$996,150
$475,783
Estimated median house or condo value
$669,900
$463,200
Median numbers of rooms
3.8
6.7
Median number of rooms in apartments
3.1
4.3
Median number of rooms in houses and condos
6
8.1
Median house price - detached houses
Over $1,000,000
$541,802
Median house price - in 2-unit structures
Over $1,000,000
$251,441
Median house price - in 3-to-4-unit structures
$471,443
$151,427
Median house price - in 5 or more unit structures
$527,983
$200,213
Median house price - Townhouses or other attached units
$817,288
$370,857
Median house price - All housing units
$790,542
$510,030
Median house age
65
21
Renting percentage
58%
31.2%
Housing density (houses/condos per square mile)
5,821.9
1,661.9
House value disparities
26.7%
24.8%
Household income disparities
45.7%
38%
Median household income for houses/condes with a mortgage
$163,111
$148,018
Median household income for apartments without a mortgage
$108,852
$132,477
Housing units without a mortgage
777 (0.8%)
692 (2.1%)
Housing units with both a second mortgage and home equity loan
8,586 (8.5%)
4,316 (12.8%)
Housing units with a mortgage
100,122 (99.2%)
33,023 (97.9%)
Housing units with a home equity loan
1,057 (1%)
166 (0.5%)
Housing units with a second mortgage
12,793 (12.7%)
4,903 (14.5%)
House/condo owner moved in on average (years ago)
10
9
House/condo renter moved in on average (years ago)
1
1
Housing units lacking complete kitchen facilities
1.5%
1.1%
Housing units lacking complete plumbing facilities
1.5%
0.6%
Housing units in structures
Housing units in structures
Washington
Cary
One, detached
11.2%
61.2%
One, attached
22.2%
14.0%
Two
2.7%
0.6%
3 or 4
6.8%
2.0%
5 to 9
7.3%
4.5%
10 to 19
8.5%
7.2%
20 to 49
7.6%
4.6%
50 or more
33.6%
5.2%
Mobile homes
0.2%
0.8%
Median real estate property taxes paid for housing units
Self-employed workers in own not incorporated business
16,654
4,480
State government workers
6,699
5,376
Unpaid family workers
580
53
Industries and Occupations
In Washington, D.C., the government sector dominates the industry. However, many residents also work in healthcare, education, and professional services. Cary, as a part of the Research Triangle, has a diverse range of industries including tech, pharmaceuticals, healthcare, and education.
Both Washington, D.C. and Cary provide excellent healthcare facilities. Washington, D.C. hosts renowned hospitals like MedStar Georgetown University Hospital. Cary is near top-ranked medical facilities in Raleigh-Durham, including Duke University Hospital.
Health (county statistics)
Type
Washington
Cary
General health status score of residents in this county from 1 (poor) to 5 (excellent)
Washington, D.C.'s infrastructure is developed to accommodate the constant influx of tourists and residents. It includes impressive public buildings, monuments, museums, and parks. Cary's infrastructure is more residential-focused, designed to support community and family living with ample parks, schools, and shopping centers.
Infrastructure
Type
Washington
Cary
Hospitals
114
4
TV stations
27
25
Bank branches located here
247
44
Bank institutions located here
34
12
Main business address for public companies
30
5
Nuclear power plants nearby
0
1
Drinking water stations with no reported violations in the past
5
42
Drinking water stations with reported violations in the past
HMDA - Conventional home purchase loans - Applications denied
Year
Washington
Cary
1999
1,328
340
2000
1,438
184
2001
935
123
2002
886
93
2003
1,319
103
2004
2,281
154
2005
2,920
190
2006
3,362
260
2007
2,548
208
2008
1,095
141
2009
514
78
Culture and Food
Washington, D.C. brims with cultural and culinary diversity. With numerous museums, art galleries, music events, and diverse cuisine, it offers cultural enrichment. Cary also has cultural offerings, but on a smaller scale. It hosts arts and music festivals and features a variety of dining options, with a focus on southern cuisine.
Sports Teams
Washington, D.C. is home to numerous professional sports teams, including the Washington Wizards (NBA), Washington Capitals (NHL), and Washington Nationals (MLB). Cary does not have professional sports teams but is a short drive from Raleigh, home to the Carolina Hurricanes (NHL).


 Washington, DC
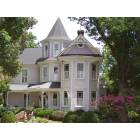
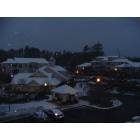
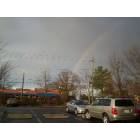
 Cary, NC