Comparing the two U.S. cities, Washington, D.C., the nation's capital, and Bridgeport, Connecticut's largest city reveals striking contrasts. Both these cities offer distinct lifestyle, employment, educational, cultural, and geographical features. The various factors including crime rates, living costs, education, work opportunities, infrastructure, taxes, sports, and healthcare are fundamentally different in each city. The following analysis should serve as a comprehensive guide for those looking to relocate or just visit either of these cities.
Distance between
Washington, DC and
Bridgeport, CT : 255.8 miles
Washington's population is larger by 352%. Its population has grown by 97,991 people (17.1%) since 2000. The population of Bridgeport has grown by 8,804 people (6.3%) during that time.
Washington, D.C. has seen a reduction in crime over the years, but still has a higher crime rate than national average. The most common types of crime are property crime and theft. However, the safer neighborhoods of D.C. like Georgetown have a lower crime rate.
Bridgeport, CT, has also experienced a decrease in crime rates over recent years, but maintain rates above state average. The city actively participates in various crime prevention initiatives to improve safety. Bridgeport's crime is predominantly property-related.
City-data.com crime index counts serious crimes and violent crime more heavily. It adjusts for the number of visitors and daily workers commuting into cities. (higher means more crime, U.S. average = 301.1)
City-data.com crime index counts serious crimes and violent crime more heavily. It adjusts for the number of visitors and daily workers commuting into cities. (higher means more crime, U.S. average = 301.1)
Sex Offenders
According to our data, there are 1,058 registered sex offenders living in Washington and 313 registered sex offenders living in . The ratio of residents to sex offenders in Washington is 644 to 1; the ratio in Bridgeport is 466 to 1. The number of registered sex offenders compared to the number of residents is a smaller in Washington than in Bridgeport.
Cost of Living
The cost of living in Washington, D.C. is significantly higher than the U.S. average, propelled by high housing costs. Essentials such as groceries, healthcare, and transportation also tend to be more expensive.
On the other hand, Bridgeport’s cost of living is slightly lower than D.C's though still above national average, with housing being the most considerable expense.
Income Tax
Washington, D.C. has a progressive income tax system, with rates from 4% to 8.95% depending on income levels.
Connecticut, where Bridgeport is located, also has a progressive income tax system, with rates from 3% to 6.99%.
Property Tax
Washington, D.C. has one of the lowest property tax rates in the U.S., with a rate of just 0.56%.
Property taxes in Bridgeport are significantly higher, with an average rate of 1.68%.
Sales Tax
Washington, DC imposes a 6% sales tax on most goods and services, and certain items such as alcohol are subject to higher taxes.
Bridgeport, CT has a sales tax rate of 6.35%, which applies uniformly across the state on most goods and services.
Income
Type
Washington
Bridgeport
Estimated median household income
$90,088
$46,445
Estimated per capita income
$65,808
$28,975
Cost of living index (U.S. average is 100)
124.2
130.9
If you make $50,000 in Washington, you will have to make $52,697 in Bridgeport to maintain the same standard of living.
Geographical Conditions
Washington, D.C. is positioned along the Potomac River and is punctuated by rolling hills and impressive parks.
Positioned along the Long Island Sound, Bridgeport offers a coastal experience with a beautiful harbor, seaside parks, and pleasant beaches.
Washington, D.C. has a strong educational system, housing prestigious universities like George Washington University and Howard University. Public and private schools in D.C. offer high-quality education.
In contrast, Bridgeport’s school system has had struggles but shown signs of improvement. The city is near Yale University and Fairfield University which provide good higher education options.
Washington, D.C.'s economy is robust, driven by government, education, and professions in law, economics, and politics. It boasts a lower unemployment rate than the national average.
Bridgeport’s economy relies on healthcare, education, trade, and manufacturing sectors. It has higher unemployment rates compared to national average but has been showing continuous improvement.
Biggest Employers
The biggest employers in Washington, D.C. include the federal government, universities, and hospitals such as MedStar Health and Johns Hopkins Medicine.
Bridgeport's largest employers include Bridgeport Hospital, St. Vincent's Medical Center, and the University of Bridgeport.
There were 376 building permits issued in Washington in 2012 (149 more than in 2011) compared to 28 building permits issued in Bridgeport in 2012 (9 more than in 2011).
In Washington (District of Columbia), 90.9% voted for Democrats and 7.3% for Republicans in 2012 Presidential Election. In Bridgeport (Fairfield County), 54.9% voted for Democrats and 44.2% for Republicans.
Elections
Type
Democrats
Republicans
Other
Year
Washington
Bridgeport
Washington
Bridgeport
Washington
Bridgeport
2020
92.6%
62.9%
5.4%
35.8%
2.0%
1.3%
2016
90.9%
58.0%
4.1%
38.1%
5.0%
3.9%
2012
90.9%
54.9%
7.3%
44.2%
1.8%
0.9%
2008
92.5%
58.7%
6.5%
40.5%
1.0%
0.7%
2004
89.6%
51.5%
9.4%
47.4%
1.0%
1.1%
2000
85.2%
52.3%
9.0%
43.1%
5.9%
4.5%
1996
85.2%
48.9%
9.3%
41.1%
5.5%
10.0%
Breakdown of population affiliated with a religious congregation
Type
Adherents
Congregations
Religion
Washington
Bridgeport
Washington
Bridgeport
CATHOLIC CHURCH
12.6%
44.1%
7.4%
14.2%
AMERICAN BAPTIST CHURCHES IN THE USA
6.2%
1.4%
10.3%
3.8%
SOUTHERN BAPTIST CONVENTION
4.4%
0.3%
10.3%
2.6%
EPISCOPAL CHURCH
3.1%
2.5%
5.3%
6.6%
SEVENTH DAY ADVENTIST CHURCH
0.9%
0.3%
1.8%
2.6%
MUSLIM ESTIMATE
0.7%
0.6%
1.1%
2.0%
EVANGELICAL LUTHERAN CHURCH IN AMERICA
0.5%
0.5%
2.1%
2.4%
LUTHERAN CHURCH
0.1%
0.3%
0.3%
1.5%
Weather
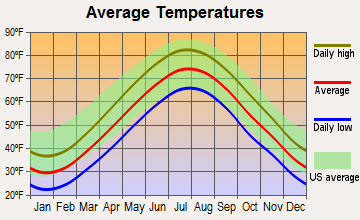
Washington, D.C. is known for its humid subtropical climate, with hot, humid summers and cold winters. It also experiences heavy snowfall some years. The cherry blossom bloom in spring is a significant tourist attraction.
Bridgeport has a temperate climate, with mild, humid summers and cold winters. Snowfall is less dense compared to D.C. but can still impact daily life in the winter months.
Weather and climate
Type
Washington
Bridgeport
Temperature - Average
56.4°F
52.1°F
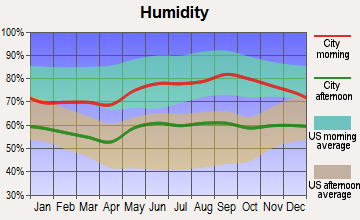
Humidity - Average morning or afternoon humidity
68.8%
72.5%
Humidity - Differences between morning and afternoon humidity
33%
26%
Humidity - Maximum monthly morning or afternoon humidity
81%
80%
Humidity - Minimum monthly morning or afternoon humidity
48%
54%
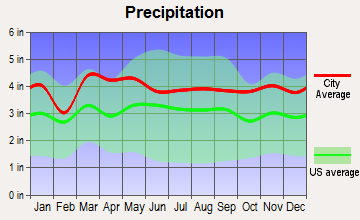
Precipitation - Yearly average
42.7 in
47.2 in
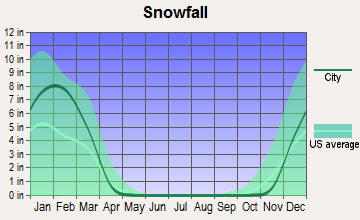
Snowfall - Yearly average
32.4 in
59.6 in
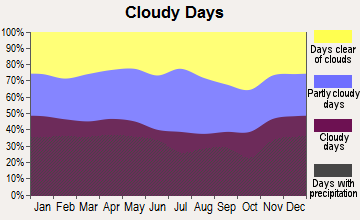
Clouds - Number of days clear of clouds
15.9%
16.5%
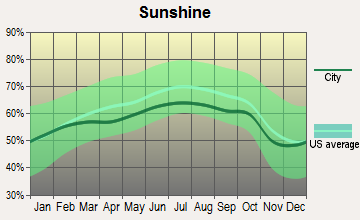
Sunshine amount - Average
61.5%
61%
Sunshine amount - Differences during a year
21%
17.6%
Sunshine amount - Maximum monthly
66%
63.6%
Sunshine amount - Minimum monthly
45%
46%
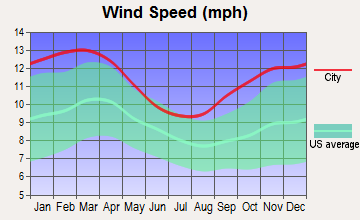
Wind speed - Average
9.7 mph
10.4 mph
Average climate in Washington, District of Columbia
Average climate in Bridgeport, Connecticut
Air pollution
Type
AQI
CO
NO2
OZONE
PB
PM10
PM25
SO2
Year
Washington
Bridgeport
Washington
Bridgeport
Washington
Bridgeport
Washington
Bridgeport
Washington
Washington
Bridgeport
Washington
Bridgeport
Washington
Bridgeport
2018
88
94
0.32
0.34
11.6
9.4
23.2
26.3
N/A
N/A
16.4
N/A
8.8
8.0
0.8
0.3
2017
84
92
0.32
0.34
12.3
12.0
24.9
26.4
N/A
N/A
16.5
N/A
9.8
7.0
1.0
0.3
2016
98
107
0.43
0.36
14.7
13.4
24.6
26.8
0.002
N/A
17.2
N/A
9.5
9.5
1.0
0.5
2015
91
106
0.34
0.39
14.8
13.9
26.2
26.4
0.002
N/A
17.0
N/A
10.4
9.9
1.3
0.5
2014
85
102
0.33
0.36
11.6
9.9
25.9
25.8
0.002
N/A
17.1
N/A
10.0
10.0
1.0
0.9
2013
88
114
0.34
0.36
11.7
10.1
25.6
27.1
0.002
N/A
17.3
N/A
11.6
11.4
1.0
0.8
2012
103
104
0.58
0.36
15.2
9.6
27.6
25.5
0.002
N/A
N/A
N/A
12.2
7.8
1.6
1.0
2011
105
83
0.67
0.39
15.4
12.7
27.7
24.2
0.002
N/A
N/A
N/A
11.4
N/A
3.1
1.6
2010
114
88
0.88
0.45
15.9
10.8
29.3
25.6
0.003
N/A
N/A
N/A
9.3
N/A
3.4
1.3
2009
90
80
0.86
0.46
16.2
10.9
24.4
22.8
0.002
N/A
N/A
N/A
7.6
N/A
4.6
2.0
2008
103
94
1.23
0.47
16.2
12.7
25.3
25.0
0.003
N/A
N/A
N/A
8.5
N/A
5.6
2.2
2007
113
98
1.17
0.55
16.8
14.8
27.1
N/A
0.004
N/A
N/A
N/A
10.4
N/A
5.1
2.6
2006
114
100
1.11
0.60
17.2
15.4
25.5
N/A
0.004
N/A
N/A
N/A
10.9
N/A
4.5
3.1
2005
105
104
0.86
0.76
20.5
16.7
22.7
N/A
0.006
N/A
N/A
N/A
11.7
N/A
4.5
4.1
2004
113
96
0.62
0.61
21.3
15.7
20.6
N/A
0.004
N/A
N/A
41.5
11.3
N/A
6.5
3.6
2003
108
106
0.90
0.66
23.6
18.0
20.8
N/A
N/A
N/A
N/A
41.0
12.2
N/A
8.3
3.4
2002
125
115
1.16
0.70
23.7
19.8
25.0
N/A
N/A
N/A
N/A
33.7
N/A
N/A
6.7
3.2
2001
113
117
1.07
0.73
23.9
21.6
22.0
N/A
0.017
N/A
N/A
37.6
N/A
N/A
6.7
3.7
2000
115
95
1.17
0.80
20.2
18.8
19.1
25.8
N/A
N/A
N/A
31.9
N/A
N/A
8.2
3.7
Natural disasters
Type
Washington
Bridgeport
Tornado activity compared to U.S. average
110.6%
59%
Earthquake activity compared to U.S. average
42.9%
29.8%
Natural disasters compared to U.S. average
19%
24%
Transportation
Washington, D.C.'s transportation system includes Metrorail, Metrobus, and bike-sharing services. There is heavy traffic during peak hours, but many residents use public transportation to commute.
Bridgeport’s public transportation includes buses, trains, and ferries. Many residents also use private vehicles for commuting.
Transport
Type
Washington
Bridgeport
Amtrak stations
1
1
Amtrak stations nearby
3
2
FAA registered aircraft
456
14
FAA registered aircraft manufacturers and dealers
3
0
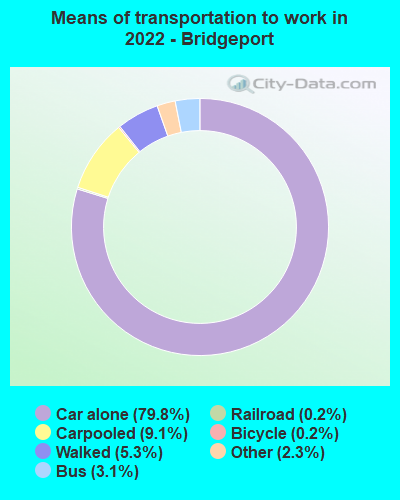
Means of transportation to work
Type
Washington
Bridgeport
Bicycle
2%
0.4%
Bus
6.3%
2.9%
Carpooled
7.8%
10.5%
Car alone
62.5%
79.5%
Railroad
0.3%
1.4%
Streetcar
10.6%
0.2%
Subway
1.3%
1.3%
Taxicab
0.8%
0.2%
Walked
5.7%
3.9%
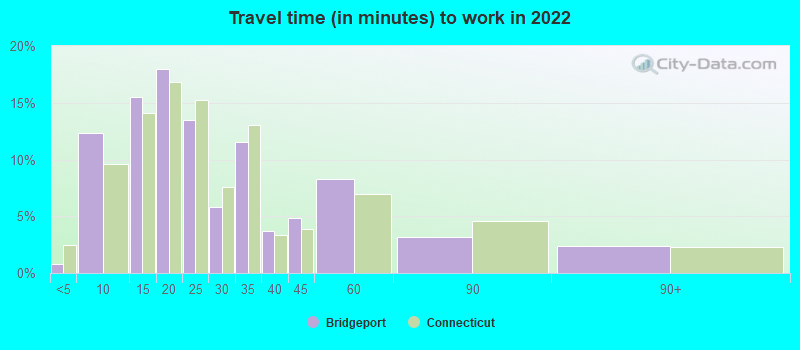
Average travel time to work
Type
Washington
Bridgeport
Average
39.2 min
25.5 min
Other means
26 min
24.6 min
Public transportation
38.9 min
41.8 min
Private vehicle occupancy
Type
Washington
Bridgeport
Average
1.1
1.3
Drove alone
89.4%
80.9%
In 2 person carpool
9.7%
11.4%
In 3 person carpool
0.6%
2.8%
In 4 person carpool
0.4%
4.6%
In 5-6 person carpool
0%
0.3%
How many people usually rode to work in the car, truck or van.
Real Estate
Real estate in Washington, D.C. is pricey due to high demand, with home prices continuing to rise. The city has a mix of historic and modern properties.
In Bridgeport, real estate is more affordable, with a mix of older homes and new developments. The city has experienced a real estate growth in recent years.
Neighborhoods
Washington, D.C. hosts a diverse range of neighborhoods, from the bustling lifestyle of Adams Morgan and Shaw to the peaceful, family-oriented suburbs of Tenleytown and Brookland.
In Bridgeport, you'll find diverse neighborhoods as well, from the historic and artsy downtown area to the more residential North End.
Houses and residents
Type
Washington
Bridgeport
Houses
357,482
61,494
Average household size (people)
2.1
2.7
Median year apartment built
1965
1955
Median year house/condo built
1941
1955
Length of stay in the house since moving in
13.5 years
14.9 years
Houses occupied
319,565 (89.4%)
57,732 (93.9%)
Houses occupied by owners
132,936 (41.6%)
24,938 (43.2%)
Houses occupied by renters
186,629 (58.4%)
32,794 (56.8%)
Median rent asked for vacant for-rent units
$2,791
$753.26
Median monthly housing costs
$1,817
$1,327
Median price asked for vacant for-sale houses and condos
$996,150
$495,508
Estimated median house or condo value
$669,900
$222,800
Median numbers of rooms
3.8
4.7
Median number of rooms in apartments
3.1
4.2
Median number of rooms in houses and condos
6
5.4
Median house price - detached houses
Over $1,000,000
$293,263
Median house price - in 2-unit structures
Over $1,000,000
$211,092
Median house price - in 3-to-4-unit structures
$471,443
$214,126
Median house price - in 5 or more unit structures
$527,983
$148,151
Median house price - Townhouses or other attached units
$817,288
$157,411
Median house price - All housing units
$790,542
$237,948
Median house age
65
65
Renting percentage
58%
57.4%
Housing density (houses/condos per square mile)
5,821.9
3,843.5
House value disparities
26.7%
31.6%
Household income disparities
45.7%
48.7%
Median household income for houses/condes with a mortgage
$163,111
$92,891
Median household income for apartments without a mortgage
$108,852
$55,578
Housing units without a mortgage
777 (0.8%)
385 (2.2%)
Housing units with both a second mortgage and home equity loan
8,586 (8.5%)
1,010 (5.7%)
Housing units with a mortgage
100,122 (99.2%)
17,302 (97.8%)
Housing units with a home equity loan
1,057 (1%)
78 (0.4%)
Housing units with a second mortgage
12,793 (12.7%)
1,742 (9.8%)
House/condo owner moved in on average (years ago)
10
15
House/condo renter moved in on average (years ago)
1
4
Housing units lacking complete kitchen facilities
1.5%
2.5%
Housing units lacking complete plumbing facilities
1.5%
1.2%
Housing units in structures
Housing units in structures
Washington
Bridgeport
One, detached
11.2%
27.3%
One, attached
22.2%
10.9%
Two
2.7%
14.7%
3 or 4
6.8%
15.4%
5 to 9
7.3%
8.1%
10 to 19
8.5%
6.6%
20 to 49
7.6%
5.9%
50 or more
33.6%
11.0%
Mobile homes
0.2%
0.0%
Median real estate property taxes paid for housing units
Self-employed workers in own not incorporated business
16,654
3,777
State government workers
6,699
2,493
Unpaid family workers
580
0
Industries and Occupations
The predominant industries in Washington, D.C. are government, education, and law, with many residents working as educators, lawyers, or government employees.
In Bridgeport, the primary industries are healthcare, manufacturing, and education as well as a growing IT sector.
Washington, D.C. houses prominent healthcare facilities like MedStar Washington Hospital Center and Georgetown University Hospital.
Bridgeport houses significant healthcare facilities like Bridgeport Hospital and St. Vincent's Medical Center.
Health (county statistics)
Type
Washington
Bridgeport
General health status score of residents in this county from 1 (poor) to 5 (excellent)
Washington, D.C. has well-developed infrastructure including historical buildings, monuments, and museums. It also is equipped with a good public transportation system and modern health facilities.
In Bridgeport, the infrastructure is more modest with old industrial buildings being converted into commercial and residential spaces. The public transportation system is less extensive than in D.C.
Infrastructure
Type
Washington
Bridgeport
Hospitals
114
3
TV stations
27
29
Arenas or stadiums
4
4
Bank branches located here
247
30
Bank institutions located here
34
8
Drinking water stations with no reported violations in the past
5
28
Drinking water stations with reported violations in the past
HMDA - Conventional home purchase loans - Applications denied
Year
Washington
Bridgeport
1999
1,328
528
2000
1,438
826
2001
935
610
2002
886
472
2003
1,319
662
2004
2,281
976
2005
2,920
1,466
2006
3,362
1,651
2007
2,548
974
2008
1,095
266
2009
514
123
Culture and Food
Washington, D.C. offers a rich cultural experience, with numerous museums, art galleries, music arenas, and diverse international cuisine.
Bridgeport has a vibrant arts scene and is known for seafood, particularly lobster and oysters. It also hosts several cultural festivals throughout the year.
Sports Teams
Washington, D.C. is home to several major sports teams like Washington Football Team, the Wizards (NBA), Capitals (NHL), and Nationals (MLB).
Bridgeport does not host any major league teams, but boasts of collegiate sports organizations and a minor league baseball team, the Bridgeport Bluefish.


 Washington, DC
 Bridgeport, CT