Overview
The Upper San Gabriel Valley and the South Coast in California are two distinct regions with diverse lifestyles, opportunities, and attractions. The Upper San Gabriel Valley, known for its lush green landscapes, unique geographical features, and wide-ranging amenities, offers more suburban living, while the South Coast, with its varied offerings from bustling city life to relaxed beach towns, provides a broader spectrum of living experiences. This comprehensive comparison will provide insights about the critical aspects of these regions, focusing on the needs and preferences of both prospective residents and tourists.
The Upper San Gabriel Valley and South Coast both have recurrent crime rates, as is common in densely populated regions. The crime rate in Upper San Gabriel Valley is comparable to the national median with areas like Arcadia and San Marino boasting low crime rates. The South Coast, too, has pockets of Safety - Irvine in Orange County is notably one of the safest cities in the nation. However, larger cities like Long Beach and Santa Ana tend to have higher crime rates.
Cost of Living
The cost of living in both the Upper San Gabriel Valley and South Coast is higher than the national average, given the general costliness of California. However, South Coast often commands a premium for its coastal proximity, beaches, and vibrant urban and cultural offerings. The cost of living in Upper San Gabriel Valley, while still high, tends to be slightly more merciful due to its more inland location.
Income Tax
California has a progressive income tax which applies to both regions. It ranges from 1% for the lowest earners up to 13.3% for the highest.
Property Tax
The average property tax rates can vary but they compare similarly between the two regions, averaging around 1.1% of the home's value.
Sales Tax
The state sales tax for California is 7.25%, with local taxes varying. The total sales tax in most South Coast locales averages around 7.75% to 8.75%. Upper San Gabriel Valley's cities, such as Pasadena, have an overall sales tax around 9.5%.
Income
Type
Upper San Gabriel Valley
South Coast
Estimated median household income
$80,436
$112,870
Estimated per capita income
$33,562
$68,453
Cost of living index (U.S. average is 100)
159.5
96.8
If you make $50,000 in South Coast, you will have to make $82,386 in Upper San Gabriel Valley to maintain the same standard of living.
Geographical Conditions
The Upper San Gabriel Valley is characterized by a mix of flat lands and majestic mountains, while the South Coast offers picturesque coasts and beaches.
Geographical information
Type
Upper San Gabriel Valley
South Coast
Land area
49.4 sq. miles
101 sq. miles
Population density
6,624.2 people per sq. mile
2,953.2 people per sq. mile
Relative area comparison
Upper San Gabriel Valley, CA South Coast, CA
Education
Both areas provide excellent educational opportunities. The Upper San Gabriel Valley is home to prestigious schools like the California Institute of Technology and Pasadena City College. The South Coast houses top-ranking educational institutions like the University of California, Irvine and Irvine Valley College, making both regions suitable for those prioritizing education.
The Upper San Gabriel Valley's economy encompasses sectors like healthcare, education, and government. On the other hand, the South Coast has a broader economy featuring robust sectors such as tourism, technology, finance, and healthcare, providing wider job opportunities. Both regions display aptitude for business with consistent growth possibilities.
Biggest Employers
The biggest employers in the Upper San Gabriel Valley are large hospital networks like City of Hope, school districts, and local governments. For the South Coast, large employers range from tech companies like Google and Broadcom, universities like UC Irvine, and healthcare providers such as Kaiser Permanente.
In Upper San Gabriel Valley (Los Angeles County), 69.7% voted for Democrats and 27.8% for Republicans in 2012 Presidential Election. In South Coast (Orange County), 45.8% voted for Democrats and 52.0% for Republicans.
Elections
Type
Democrats
Republicans
Other
Year
Upper San Gabriel Valley
South Coast
Upper San Gabriel Valley
South Coast
Upper San Gabriel Valley
South Coast
2020
71.0%
53.6%
26.9%
44.6%
2.1%
1.8%
2016
72.0%
50.9%
22.5%
42.4%
5.5%
6.7%
2012
69.7%
45.8%
27.8%
52.0%
2.4%
2.3%
2008
69.2%
47.8%
28.8%
50.3%
1.9%
1.9%
2004
63.3%
39.3%
35.7%
60.2%
1.0%
0.5%
2000
63.6%
40.4%
32.4%
55.9%
4.0%
3.7%
1996
59.3%
37.9%
31.0%
51.7%
9.7%
10.5%
Breakdown of population affiliated with a religious congregation
Type
Adherents
Congregations
Religion
Upper San Gabriel Valley
South Coast
Upper San Gabriel Valley
South Coast
CATHOLIC CHURCH
36.1%
26.5%
4.7%
4.4%
SOUTHERN BAPTIST CONVENTION
1.0%
2.3%
9.0%
8.8%
MUSLIM ESTIMATE
0.7%
0.8%
1.0%
1.3%
AMERICAN BAPTIST CHURCHES IN THE USA
0.5%
0.2%
3.1%
1.7%
SEVENTH DAY ADVENTIST CHURCH
0.5%
0.4%
2.4%
1.3%
EPISCOPAL CHURCH
0.4%
0.4%
1.4%
1.4%
EVANGELICAL LUTHERAN CHURCH IN AMERICA
0.2%
0.4%
1.9%
2.3%
LUTHERAN CHURCH
0.2%
0.6%
1.6%
2.0%
REFORMED CHURCH IN AMERICA
0.1%
0.3%
0.2%
0.2%
Weather
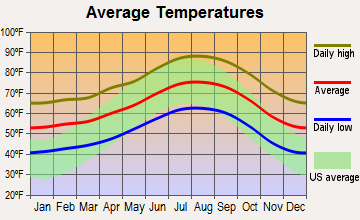
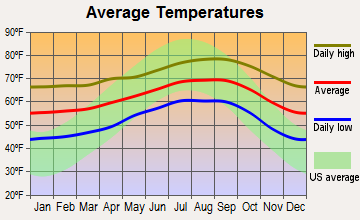
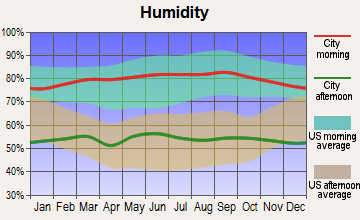
California is known for its Mediterranean-like weather, and both regions reflect this. The Upper San Gabriel Valley experiences a more temperate climate due to its inland position, which means hotter summers and colder winters compared to coastal regions. The South Coast, on the other hand, experiences more moderate, ocean-influenced weather patterns, known for mild winters and less intense summers, which might be more desirable for those sensitive to temperature extremes.
Weather and climate
Type
Upper San Gabriel Valley
South Coast
Temperature - Average
63.5°F
62.1°F
Humidity - Average morning or afternoon humidity
62.2%
69.1%
Humidity - Differences between morning and afternoon humidity
17.3%
24.6%
Humidity - Maximum monthly morning or afternoon humidity
67%
77%
Humidity - Minimum monthly morning or afternoon humidity
49.7%
52.4%
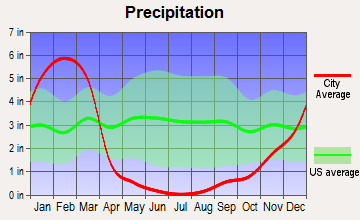
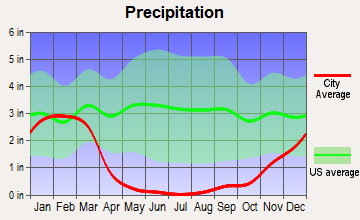
Precipitation - Yearly average
24.3 in
13.4 in
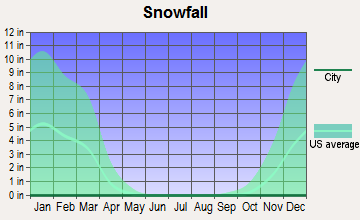
Snowfall - Yearly average
0 in
0 in
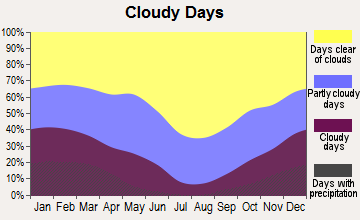
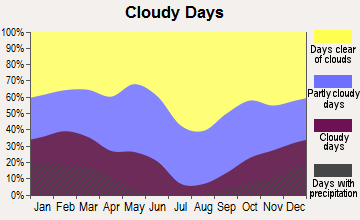
Clouds - Number of days clear of clouds
29.4%
26.7%
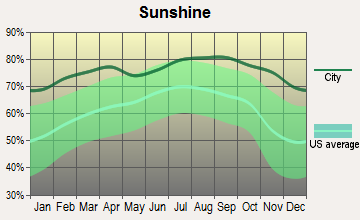
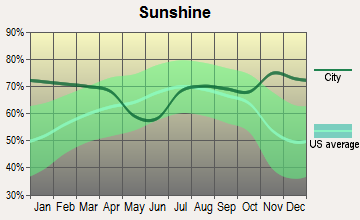
Sunshine amount - Average
78.4%
77.6%
Sunshine amount - Differences during a year
22%
20.5%
Sunshine amount - Maximum monthly
85%
81.9%
Sunshine amount - Minimum monthly
63%
61.4%
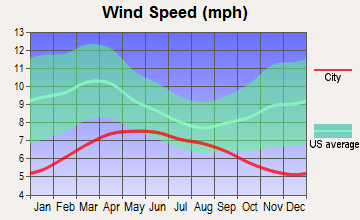
Wind speed - Average
2.6 mph
5.5 mph
Average climate in Upper San Gabriel Valley, California
Average climate in South Coast, California
Air pollution
Type
AQI
CO
NO2
OZONE
PB
PM10
PM25
SO2
Year
Upper San Gabriel Valley
South Coast
Upper San Gabriel Valley
South Coast
Upper San Gabriel Valley
South Coast
Upper San Gabriel Valley
South Coast
Upper San Gabriel Valley
Upper San Gabriel Valley
South Coast
Upper San Gabriel Valley
South Coast
Upper San Gabriel Valley
South Coast
2018
142
105
0.37
0.18
14.2
8.6
28.5
34.0
0.007
N/A
28.5
22.7
14.1
7.0
0.4
N/A
2017
146
111
0.36
0.21
15.1
8.4
29.8
34.7
0.007
N/A
31.2
23.0
14.0
11.3
0.5
N/A
2016
136
105
0.33
0.14
15.5
9.6
28.1
33.8
0.007
N/A
28.6
21.9
13.0
9.8
0.4
0.1
2015
143
111
0.33
0.10
15.2
10.5
28.4
32.9
0.007
N/A
28.4
19.4
15.2
10.5
0.3
0.1
2014
141
100
0.35
0.11
16.7
9.8
28.0
31.3
0.007
N/A
31.3
25.4
14.9
11.8
0.5
0.3
2013
144
97
0.39
0.17
17.3
10.6
26.6
30.0
0.007
N/A
29.3
24.5
14.4
10.3
0.4
0.2
2012
148
101
0.43
0.26
18.2
10.1
25.9
29.9
0.006
N/A
28.7
21.5
16.5
10.5
0.5
0.1
2011
146
113
0.47
0.15
19.1
10.2
24.8
30.3
0.008
N/A
28.9
24.0
17.6
10.9
0.5
0.3
2010
133
101
0.48
0.21
19.2
10.9
24.6
30.6
0.011
N/A
27.0
23.3
15.5
11.4
0.5
0.6
2009
153
120
0.39
0.15
21.0
13.0
25.4
31.5
0.011
N/A
32.0
27.3
17.2
12.4
0.4
1.1
2008
155
131
0.54
0.26
23.1
13.2
24.9
32.0
0.013
N/A
32.1
38.8
16.9
9.4
0.6
1.1
2007
135
110
0.55
0.24
24.6
13.7
23.1
30.6
0.016
N/A
N/A
N/A
N/A
N/A
1.0
0.8
2006
128
112
0.58
0.30
24.9
14.8
22.8
30.6
0.009
N/A
N/A
N/A
N/A
N/A
1.5
1.3
2005
128
109
0.61
0.28
25.4
13.7
21.3
29.9
0.015
N/A
N/A
N/A
N/A
N/A
1.7
1.3
2004
134
130
0.71
0.29
26.0
15.5
23.8
32.5
0.018
N/A
N/A
N/A
N/A
N/A
2.4
1.6
2003
143
132
0.89
0.38
30.7
18.2
23.3
31.3
0.025
N/A
N/A
N/A
N/A
N/A
1.6
1.1
2002
137
129
0.91
0.40
32.5
17.7
21.9
28.4
0.022
N/A
N/A
N/A
N/A
N/A
2.2
1.6
2001
143
137
1.04
0.52
33.1
18.5
20.1
27.8
0.031
N/A
N/A
N/A
N/A
N/A
2.3
1.4
2000
151
140
1.07
0.52
33.5
21.2
20.1
24.5
0.028
N/A
N/A
N/A
N/A
N/A
1.3
1.9
Natural disasters
Type
Upper San Gabriel Valley
South Coast
Tornado activity compared to U.S. average
18%
17.1%
Earthquake activity compared to U.S. average
7,264.5%
6,728.5%
Natural disasters compared to U.S. average
57%
32%
Transportation
Both regions have solid connections via freeways and public transit. The South Coast offers multiple modes, including buses, light rail, and ferry services. Upper San Gabriel Valley is served by Metro Rail and buses. Traffic can be challenging in both areas during peak hours.
Transport
Type
Upper San Gabriel Valley
South Coast
Amtrak stations nearby
3
3
Means of transportation to work
Type
Upper San Gabriel Valley
South Coast
Bicycle
1.1%
0.3%
Bus
3.9%
1%
Carpooled
16.6%
10.5%
Car alone
71.1%
79.2%
Motorcycle
0.1%
0.2%
Railroad
0.1%
0.4%
Taxicab
0.1%
0%
Walked
3.2%
1.7%
Average travel time to work
Type
Upper San Gabriel Valley
South Coast
Average
29.1 min
27.9 min
Real Estate
Real estate in both areas is quite active, with the South Coast having a higher market due to the range of living options, from stunning beachfront properties to chic urban condos. Upper San Gabriel Valley's real estate has a significant mix of single-family homes, condos, and townhouses.
Neighborhoods
The South Coast offers diverse neighborhoods from bustling downtown Santa Ana to tranquil Laguna Beach. Upper San Gabriel Valley comprises primarily suburban neighborhoods, cities like Pasadena, Arcadia, and San Marino are well-known for their scenic beauty and community spirit.
Houses and residents
Type
Upper San Gabriel Valley
South Coast
Houses
99,295
124,031
Average household size (people)
3.3
2.5
Houses occupied
96,186 (96.9%)
117,093 (94.4%)
Houses occupied by owners
52,398 (54.5%)
81,601 (69.7%)
Houses occupied by renters
43,788 (45.5%)
35,492 (30.3%)
Median rent asked for vacant for-rent units
$1,771
$2,718
Median price asked for vacant for-sale houses and condos
$1,138,428
$1,099,558
Estimated median house or condo value
$740,686
Over $1,000,000
Median number of rooms in apartments
3.7
3.9
Median number of rooms in houses and condos
5.9
5.1
Renting percentage
44.9%
33.8%
Housing density (houses/condos per square mile)
2,008.8
1,227.5
Household income disparities
44%
38.1%
Housing units without a mortgage
11,525 (24.8%)
10,715 (16.4%)
Housing units with both a second mortgage and home equity loan
137 (0.3%)
248 (0.4%)
Housing units with a mortgage
34,867 (75.2%)
54,674 (83.6%)
Housing units with a home equity loan
3,133 (6.8%)
5,859 (9%)
Housing units with a second mortgage
4,036 (8.7%)
7,560 (11.6%)
Housing units lacking complete kitchen facilities
1.5%
0.8%
Housing units lacking complete plumbing facilities
0.9%
0.3%
Housing units in structures
Housing units in structures
Upper San Gabriel Valley
South Coast
One, detached
61.5%
45.9%
One, attached
9.3%
19.0%
Two
2.0%
3.0%
3 or 4
4.2%
8.5%
5 to 9
5.7%
8.8%
10 to 19
5.5%
4.2%
20 to 49
5.5%
2.8%
50 or more
3.6%
5.3%
Mobile homes
2.6%
2.2%
Boats, RVs, vans, etc.
0.1%
0.1%
Median real estate property taxes paid for housing units
Self-employed workers in own not incorporated business
10,209
17,244
State government workers
3,180
4,403
Unpaid family workers
401
640
Industries and Occupations
The Upper San Gabriel Valley's workforce majorly constitutes healthcare professionals, educators, and government employees. The South Coast, being more commercially developed, has significant employment in technology, finance, retail, and real estate, among others.
Quality healthcare services are available in both regions with leading hospitals and medical centers such as Kaiser Permanente and UCI Medical Center in the South Coast, and City of Hope in the Upper San Gabriel Valley.
Health (county statistics)
Type
Upper San Gabriel Valley
South Coast
General health status score of residents in this county from 1 (poor) to 5 (excellent)
The South Coast, with its established cities and continuous development, exhibits a more evolved infrastructure while the Upper San Gabriel valley has a mix of urban and suburban infrastructures. In both regions, public utilities and services are generally efficient and accessible.
Infrastructure
Type
Upper San Gabriel Valley
South Coast
TV stations
27
1
Nuclear power plants nearby
0
2
Culture and Food
The culture and food scenes in both regions are vibrant and diverse. The South Coast is known for its seafood, multicultural cuisine, and food festivals. The Upper San Gabriel Valley also offers a rich culinary and cultural experience - Alhambra and Monterey Park are known hotspots for authentic Asian cuisine.
Sports Teams
The South Coast houses sports teams like the Los Angeles Angels and Anaheim Ducks. Pasadena in Upper San Gabriel Valley is known for hosting the annual Rose Bowl game and the famous Tournament of Roses Parade.
 Upper San Gabriel Valley, CA
 South Coast, CA