Relative area comparison
 Upper San Gabriel Valley, CA
 Riverside, CA
Overview
Upper San Gabriel Valley and Riverside are two diverse and unique Californian cities. Despite being located within the same state, they offer differing experiences in terms of crime, cost, work opportunities, lifestyle, and other amenities. Exploring the differences between these two cities will help those planning to relocate make informed decisions, with insights touching on aspects relevant to both residents and visitors.
 Upper San Gabriel Valley, CA and
Riverside, CA : 37.8 miles
Upper San Gabriel Valley, CA and
Riverside, CA : 37.8 miles
Upper San Gabriel Valley's population is larger by 3%. The population of Riverside has grown by 62,095 people (24.3%) during that time.
| Population | ||
| Type | Upper San Gabriel Valley | Riverside |
|---|---|---|
| Population | 327,431 | 317,261 |
| Female / male percentage | 51.1% / 48.9%
|
50.9% / 49.1%
|
Riverside experiences a slightly higher crime rate compared to national averages, with property crime being a widely reported issue. In contrast, the Upper San Gabriel Valley has a notably lower crime rate, with safety levels consistently ranking higher than in Riverside. However, it's important to note that crime rates can vary significantly between different neighborhoods within the same city.
The cost of living in both Upper San Gabriel Valley and Riverside is higher than the national average, as is typical for Southern California. However, Riverside tends to be slightly less expensive, particularly in terms of housing costs. Essential expenses such as groceries, transportation, and healthcare are also marginally cheaper in Riverside.
Both Riverside and Upper San Gabriel Valley are in California and follow the state's progressive income tax structure. The tax rate ranges from 1% to 13.3% depending on income level. Both cities do not have a city-level income tax.
In Riverside, the average effective property tax rate is about 0.93%, slightly lesser than in Upper San Gabriel Valley where it is around 0.95%. However, given the higher real estate prices in Upper San Gabriel Valley, homeowners can expect to pay more in absolute terms.
The state sales tax is the same for both cities, at 6%. However, the total sales tax is slightly higher in Riverside at 8.75% compared to 9.5% in Upper San Gabriel Valley due to local district taxes.
| Income | ||
| Type | Upper San Gabriel Valley | Riverside |
|---|---|---|
| Estimated median household income | $80,436 | $76,558 |
| Estimated per capita income | $33,562 | $29,013 |
| Cost of living index (U.S. average is 100) | 159.5 | 83 |
If you make $50,000 in Riverside, you will have to make $96,084 in Upper San Gabriel Valley to maintain the same standard of living.
Upper San Gabriel Valley is nestled among the San Gabriel Mountains and offers beautiful views and opportunities for outdoor activities. Riverside is located inland, known for its orange groves and the Santa Ana River, with Mt. Rubidoux offering a popular spot for hikes and panoramic views of the city.
| Geographical information | ||
| Type | Upper San Gabriel Valley | Riverside |
|---|---|---|
| Land area | 49.4 sq. miles | 78.1 sq. miles |
| Population density | 6,624.2 people per sq. mile | 4,062.3 people per sq. mile |
Upper San Gabriel Valley, CA
Riverside, CA
The Upper San Gabriel Valley is home to numerous top-ranking school districts and prestigious institutions, providing high-quality education opportunities. Riverside also provides quality education, but Upper San Gabriel Valley generally performs better in this regard. Colleges like La Sierra University and California Baptist University are well-regarded in Riverside.
| Education level (25-year-olds and older) | ||
| Type | Upper San Gabriel Valley | Riverside |
|---|---|---|
| Bachelor's degree or higher | 22.9% | 23.4% |
| Graduate or professional degree | 8.1% | 9.6% |
| High school or higher | 68% | 84% |
Riverside's local economy thrives on sectors like manufacturing, retail, and education. The city's economic growth has remained consistent over the years, with steady job creation. Conversely, the Upper San Gabriel Valley's largest sectors are healthcare, retail trade, and educational services. Despite a relatively slower economic growth rate compared to Riverside, it offers higher average salaries and lower unemployment rates.
The largest employer in Riverside is the County of Riverside, followed by the Riverside Unified School District and Kaiser Permanente. On the other hand, the Upper San Gabriel Valley's biggest employers are the Los Angeles County Department of Health Services, West Covina Unified School District, and Citrus Valley Medical Center.
In Upper San Gabriel Valley (Los Angeles County), 69.7% voted for Democrats and 27.8% for Republicans in 2012 Presidential Election. In Riverside (Riverside County), 49.6% voted for Democrats and 48.0% for Republicans.
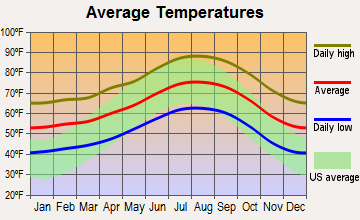
The Upper San Gabriel Valley has a warm Mediterranean climate with mild winters and hot, dry summers. Riverside, on the other hand, has a hot-summer Mediterranean climate where temperatures often exceed 100 degrees F in the summer but are more moderate during the winter season. While both cities get plenty of sunshine, the Upper San Gabriel Valley has a cooler, more balanced climate year-round compared to Riverside.
| Weather and climate | ||
| Type | Upper San Gabriel Valley | Riverside |
|---|---|---|
| Temperature - Average | 63.5°F | 66°F |
| Humidity - Average morning or afternoon humidity | 62.2% | 66.7% |
| Humidity - Differences between morning and afternoon humidity | 17.3% | 21.4% |
| Humidity - Maximum monthly morning or afternoon humidity | 67% | 73.5% |
| Humidity - Minimum monthly morning or afternoon humidity | 49.7% | 52.1% |
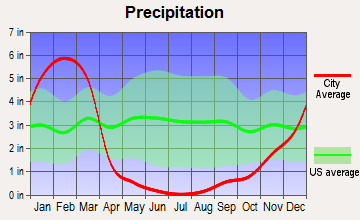
| Precipitation - Yearly average | 24.3 in | 10.3 in |
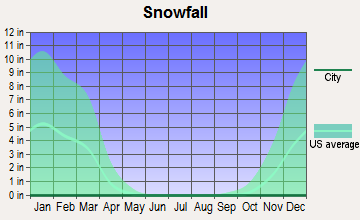
| Snowfall - Yearly average | 0 in | 0 in |
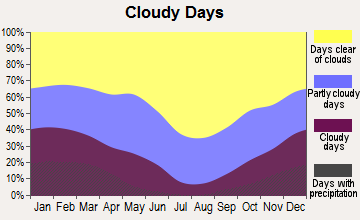
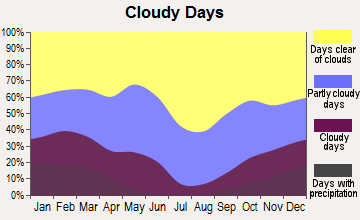
| Clouds - Number of days clear of clouds | 29.4% | 27.3% |
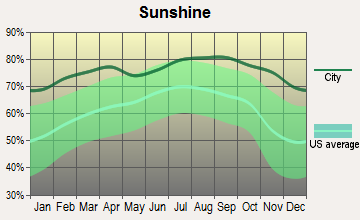
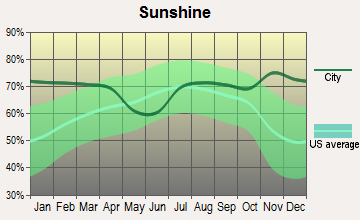
| Sunshine amount - Average | 78.4% | 78.2% |
| Sunshine amount - Differences during a year | 22% | 21.5% |
| Sunshine amount - Maximum monthly | 85% | 84.2% |
| Sunshine amount - Minimum monthly | 63% | 62.6% |
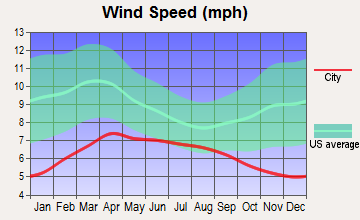
| Wind speed - Average | 2.6 mph | 4.5 mph |
| Natural disasters | ||
| Type | Upper San Gabriel Valley | Riverside |
|---|---|---|
| Tornado activity compared to U.S. average | 18% | 17.4% |
| Earthquake activity compared to U.S. average | 7,264.5% | 7,322.6% |
| Natural disasters compared to U.S. average | 57% | 46% |
Riverside has a robust bus system and Metrolink train service for commuting. The Upper San Gabriel Valley also has extensive public transportation options, including the Metro L Line. Both cities experience traffic, but congestion in Upper San Gabriel Valley can be higher due to its closer proximity to Los Angeles.
| Transport | ||
| Type | Upper San Gabriel Valley | Riverside |
|---|---|---|
| Amtrak stations | 0 | 1 |
| Amtrak stations nearby | 3 | 3 |
| FAA registered aircraft | 0 | 307 |
| FAA registered aircraft manufacturers and dealers | 0 | 15 |
| Means of transportation to work | ||
| Type | Upper San Gabriel Valley | Riverside |
|---|---|---|
| Bicycle | 1.1% | 0.5% |
| Bus | 3.9% | 0.9% |
| Carpooled | 16.6% | 9% |
| Car alone | 71.1% | 85.7% |
| Motorcycle | 0.1% | 0.3% |
| Railroad | 0.1% | 0.4% |
| Taxicab | 0.1% | 0% |
| Walked | 3.2% | 2.3% |
| Average travel time to work | ||
| Type | Upper San Gabriel Valley | Riverside |
|---|---|---|
| Average | 29.1 min | 31.3 min |
Upper San Gabriel Valley has a more expensive real estate market compared to Riverside because of its proximity to downtown Los Angeles. Riverside's market is more affordable but has seen consistent growth over the years, reflecting a potentially valuable investment.
The neighborhoods in the Upper San Gabriel Valley are family-friendly, with many activities and amenities. Riverside has a combination of urban and suburban living, with diverse neighborhoods each with a unique character and charm.
| Houses and residents | ||
| Type | Upper San Gabriel Valley | Riverside |
|---|---|---|
| Houses | 99,295 | 94,246 |
| Average household size (people) | 3.3 | 3.2 |
| Houses occupied | 96,186 (96.9%) | 91,110 (96.7%) |
| Houses occupied by owners | 52,398 (54.5%) | 51,211 (56.2%) |
| Houses occupied by renters | 43,788 (45.5%) | 39,899 (43.8%) |
| Median rent asked for vacant for-rent units | $1,771 | $1,277 |
| Median price asked for vacant for-sale houses and condos | $1,138,428 | $414,585 |
| Estimated median house or condo value | $740,686 | $483,300 |
| Median number of rooms in apartments | 3.7 | 3.9 |
| Median number of rooms in houses and condos | 5.9 | 6.1 |
| Renting percentage | 44.9% | 44.3% |
| Housing density (houses/condos per square mile) | 2,008.8 | 1,206.8 |
| Household income disparities | 44% | 40.5% |
| Housing units without a mortgage | 11,525 (24.8%) | 393 (1%) |
| Housing units with both a second mortgage and home equity loan | 137 (0.3%) | 1,312 (3.3%) |
| Housing units with a mortgage | 34,867 (75.2%) | 39,744 (99%) |
| Housing units with a home equity loan | 3,133 (6.8%) | 123 (0.3%) |
| Housing units with a second mortgage | 4,036 (8.7%) | 2,112 (5.3%) |
| Housing units lacking complete kitchen facilities | 1.5% | 2.5% |
| Housing units lacking complete plumbing facilities | 0.9% | 0.4% |
The most common industries in Riverside are healthcare, manufacturing, and education. On the other hand, the majority of the population in the Upper San Gabriel Valley works in healthcare and social assistance, followed by retail trade and education.
Health care facilities are abundant in both regions. Riverside has high-quality hospitals like Riverside Community Hospital and Kaiser Permanente. Upper San Gabriel Valley is home to prominent healthcare institutions including Methodist Hospital and Citrus Valley Medical Center.
| Health (county statistics) | ||
| Type | Upper San Gabriel Valley | Riverside |
|---|---|---|
| General health status score of residents in this county from 1 (poor) to 5 (excellent) | 3.5 | 3.4 |
| Average weight of females (lbs) | 154.6 lbs | 161.6 lbs |
| Average weight of males (lbs) | 185 lbs | 193.1 lbs |
| Residents visited a dentist within the past year | 68.1% | 63.8% |
| Residents exercised in the past month | 74.7% | 70.4% |
| Adult residents drank alcohol in the past 30 days | 69.2% | 50% |
| Residents smoked 100+ cigarettes in their lives | 37.8% | 38.7% |
Both Riverside and Upper San Gabriel Valley have decent infrastructure. Upper San Gabriel Valley, being closer to downtown Los Angeles, enjoys a bit more robust and diverse infrastructure. Expectations are high for Riverside though, with several large-scale infrastructure projects in the pipeline aiming to improve transportation and public services.
| Infrastructure | ||
| Type | Upper San Gabriel Valley | Riverside |
|---|---|---|
| TV stations | 27 | 5 |
Riverside offers a plethora of dining options and has a more prominent beer and pub scene. Upper San Gabriel Valley is known for its diverse food scene, with a particularly strong representation of Asian cuisine. Both cities host exciting cultural events throughout the year, catering to diverse interests.
Neither Riverside nor Upper San Gabriel Valley have major league teams; sports enthusiasts usually support teams from the Greater Los Angeles Area. The LA Lakers, Dodgers, Rams, and Chargers have fans across both cities. Riverside does, however, have minor league and college sports teams that provide ample local entertainment.