Upper San Gabriel Valley and Irvine, both located in California, are communities with their distinct features and benefits. The Upper San Gabriel Valley lies in the northeastern part of Los Angeles County, offering a diverse cultural experience, and a unique blend of suburban and urban living. Meanwhile, Irvine, nestled in Orange County, is known for its planned communities, tech-fueled economy, and top-tier educational institutes. This comparison will provide a comprehensive understanding of what living in these cities implies spanning various sectors like safety, weather, cost of living, education, work and economy, infrastructure, culture, to name a few.
Safety is a concern for both residents and tourists. Irvine stands as one of the safest cities in America according to FBI statistics, with a crime rate that is significantly lower than the national average. Meanwhile, Upper San Gabriel Valley also boasts a relatively low crime rate for a major metropolitan area, yet higher than Irvine.
Cost of Living
The cost of living in both Upper San Gabriel Valley and Irvine is considerably higher than the national average considering California's high living costs. However, Irvine tends to be more expensive, especially in terms of housing, which might be a deciding factor for those relocating.
Income Tax
California has a progressive income tax, which is the same for both Upper San Gabriel Valley and Irvine. The rate ranges from 1% to 13.3% depending upon the income level.
Property Tax
Property tax varied in Upper San Gabriel Valley depending on the specific community but tends to be lower than Irvine, which has some of the highest property tax rates in Orange County.
Sales Tax
California's state sales tax rate is 7.25% and is the same for both cities. However, local tax additions mean Irvine has a slightly higher sales tax rate than the Upper San Gabriel Valley.
Income
Type
Upper San Gabriel Valley
Irvine
Estimated median household income
$80,436
$105,774
Estimated per capita income
$33,562
$54,053
Cost of living index (U.S. average is 100)
159.5
89.8
If you make $50,000 in Irvine, you will have to make $88,808 in Upper San Gabriel Valley to maintain the same standard of living.
Geographical Conditions
Upper San Gabriel Valley, nestled in the San Gabriel Mountains, offers breathtaking views and easy access to natural beauty. Irvine, located in a flat coastal plain, has a number of parks and green spaces, but lacks the dramatic landscapes of the Upper San Gabriel Valley.
Geographical information
Type
Upper San Gabriel Valley
Irvine
Land area
49.4 sq. miles
46.2 sq. miles
Population density
6,624.2 people per sq. mile
6,691.5 people per sq. mile
Relative area comparison
Upper San Gabriel Valley, CA Irvine, CA
Education
Both cities have excellent educational opportunities. Irvine stands out with its highly rated public schools, and being home to the University of California, Irvine. Upper San Gabriel Valley, on the other hand, is in close proximity to a number of prestigious colleges and institutions like the California Institute of Technology and Pasadena City College.
While the Upper San Gabriel Valley has a diverse economy covering sectors like health care, education, and retail, Irvine is a powerhouse in the tech industry, with numerous start-ups and established companies operating within its boundaries. This offers promising job prospects, especially for tech professionals.
Biggest Employers
In Irvine, major employers include Blizzard Entertainment, Broadcom Corporation, and Edwards Lifesciences. In contrast, Upper San Gabriel Valley's biggest employers are in the healthcare sector with Kaiser Permanente and City of Hope Medical Center leading the way.
In Upper San Gabriel Valley (Los Angeles County), 69.7% voted for Democrats and 27.8% for Republicans in 2012 Presidential Election. In Irvine (Orange County), 45.8% voted for Democrats and 52.0% for Republicans.
Elections
Type
Democrats
Republicans
Other
Year
Upper San Gabriel Valley
Irvine
Upper San Gabriel Valley
Irvine
Upper San Gabriel Valley
Irvine
2020
71.0%
53.6%
26.9%
44.6%
2.1%
1.8%
2016
72.0%
50.9%
22.5%
42.4%
5.5%
6.7%
2012
69.7%
45.8%
27.8%
52.0%
2.4%
2.3%
2008
69.2%
47.8%
28.8%
50.3%
1.9%
1.9%
2004
63.3%
39.3%
35.7%
60.2%
1.0%
0.5%
2000
63.6%
40.4%
32.4%
55.9%
4.0%
3.7%
1996
59.3%
37.9%
31.0%
51.7%
9.7%
10.5%
Breakdown of population affiliated with a religious congregation
Type
Adherents
Congregations
Religion
Upper San Gabriel Valley
Irvine
Upper San Gabriel Valley
Irvine
CATHOLIC CHURCH
36.1%
26.5%
4.7%
4.4%
SOUTHERN BAPTIST CONVENTION
1.0%
2.3%
9.0%
8.8%
MUSLIM ESTIMATE
0.7%
0.8%
1.0%
1.3%
AMERICAN BAPTIST CHURCHES IN THE USA
0.5%
0.2%
3.1%
1.7%
SEVENTH DAY ADVENTIST CHURCH
0.5%
0.4%
2.4%
1.3%
EPISCOPAL CHURCH
0.4%
0.4%
1.4%
1.4%
EVANGELICAL LUTHERAN CHURCH IN AMERICA
0.2%
0.4%
1.9%
2.3%
LUTHERAN CHURCH
0.2%
0.6%
1.6%
2.0%
REFORMED CHURCH IN AMERICA
0.1%
0.3%
0.2%
0.2%
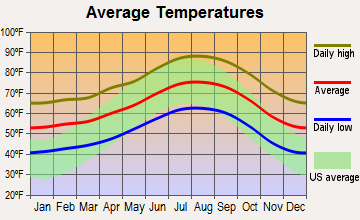
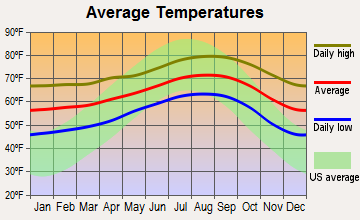
Weather
Both areas feature a Mediterranean climate, known for warm, dry summers, and cool, wet winters. However, being closer to the coast, Irvine has more moderate temperatures than Upper San Gabriel Valley, especially in the summer. This factor could appeal to those sensitive to heat.
Weather and climate
Type
Upper San Gabriel Valley
Irvine
Temperature - Average
63.5°F
63.6°F
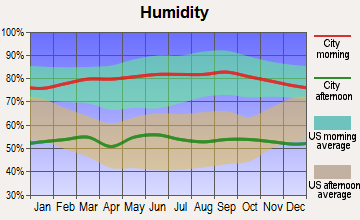
Humidity - Average morning or afternoon humidity
62.2%
69.5%
Humidity - Differences between morning and afternoon humidity
17.3%
25.7%
Humidity - Maximum monthly morning or afternoon humidity
67%
77.7%
Humidity - Minimum monthly morning or afternoon humidity
49.7%
52%
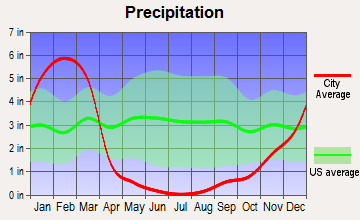
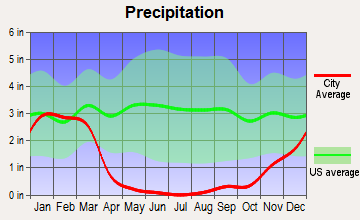
Precipitation - Yearly average
24.3 in
13.1 in
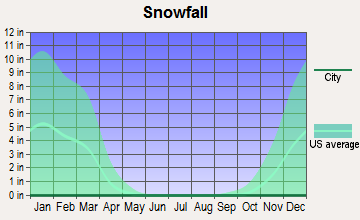
Snowfall - Yearly average
0 in
0 in
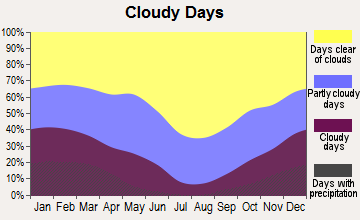
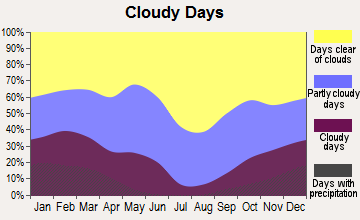
Clouds - Number of days clear of clouds
29.4%
26.6%
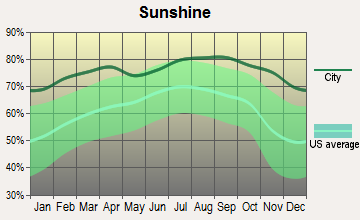
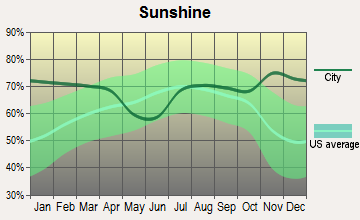
Sunshine amount - Average
78.4%
78.3%
Sunshine amount - Differences during a year
22%
21.7%
Sunshine amount - Maximum monthly
85%
84.4%
Sunshine amount - Minimum monthly
63%
62.7%
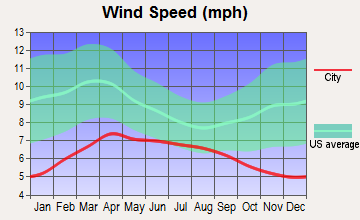
Wind speed - Average
2.6 mph
5.7 mph
Average climate in Upper San Gabriel Valley, California
Average climate in Irvine, California
Air pollution
Type
AQI
CO
NO2
OZONE
PB
PM10
PM25
SO2
Year
Upper San Gabriel Valley
Irvine
Upper San Gabriel Valley
Irvine
Upper San Gabriel Valley
Irvine
Upper San Gabriel Valley
Irvine
Upper San Gabriel Valley
Irvine
Upper San Gabriel Valley
Irvine
Upper San Gabriel Valley
Irvine
Upper San Gabriel Valley
Irvine
2018
142
119
0.37
0.25
14.2
13.5
28.5
31.5
0.007
N/A
28.5
27.5
14.1
12.5
0.4
N/A
2017
146
116
0.36
0.27
15.1
13.1
29.8
32.5
0.007
N/A
31.2
26.7
14.0
13.7
0.5
N/A
2016
136
102
0.33
0.24
15.5
11.6
28.1
31.6
0.007
N/A
28.6
24.1
13.0
12.6
0.4
0.1
2015
143
104
0.33
0.21
15.2
12.6
28.4
31.3
0.007
N/A
28.4
25.0
15.2
14.6
0.3
0.1
2014
141
109
0.35
0.20
16.7
12.3
28.0
30.1
0.007
N/A
31.3
26.7
14.9
15.8
0.5
0.3
2013
144
107
0.39
0.25
17.3
13.1
26.6
28.8
0.007
0.003
29.3
29.2
14.4
14.1
0.4
0.2
2012
148
103
0.43
0.28
18.2
12.1
25.9
28.1
0.006
0.004
28.7
27.9
16.5
14.4
0.5
0.1
2011
146
109
0.47
0.24
19.1
13.8
24.8
28.6
0.008
0.006
28.9
27.6
17.6
15.9
0.5
0.3
2010
133
102
0.48
0.27
19.2
13.4
24.6
28.4
0.011
0.011
27.0
23.6
15.5
14.3
0.5
0.6
2009
153
118
0.39
0.26
21.0
15.3
25.4
29.3
0.011
0.009
32.0
24.3
17.2
14.7
0.4
1.1
2008
155
124
0.54
0.33
23.1
16.0
24.9
29.8
0.013
0.008
32.1
29.7
16.9
21.6
0.6
1.1
2007
135
100
0.55
0.31
24.6
15.9
23.1
28.6
0.016
0.010
N/A
N/A
N/A
N/A
1.0
0.8
2006
128
109
0.58
0.36
24.9
16.7
22.8
28.1
0.009
0.005
N/A
N/A
N/A
N/A
1.5
1.3
2005
128
91
0.61
0.35
25.4
17.0
21.3
28.8
0.015
0.011
N/A
N/A
N/A
N/A
1.7
1.3
2004
134
118
0.71
0.42
26.0
18.3
23.8
31.8
0.018
0.012
N/A
N/A
N/A
N/A
2.4
1.6
2003
143
116
0.89
0.53
30.7
21.1
23.3
29.9
0.025
0.046
N/A
N/A
N/A
N/A
1.6
1.1
2002
137
103
0.91
0.54
32.5
20.7
21.9
26.5
0.022
0.010
N/A
N/A
N/A
N/A
2.2
1.6
2001
143
109
1.04
0.65
33.1
20.7
20.1
26.5
0.031
0.011
N/A
N/A
N/A
N/A
2.3
1.4
2000
151
116
1.07
0.67
33.5
23.6
20.1
24.1
0.028
0.016
N/A
N/A
N/A
N/A
1.3
1.9
Natural disasters
Type
Upper San Gabriel Valley
Irvine
Tornado activity compared to U.S. average
18%
18.7%
Earthquake activity compared to U.S. average
7,264.5%
6,900.9%
Natural disasters compared to U.S. average
57%
32%
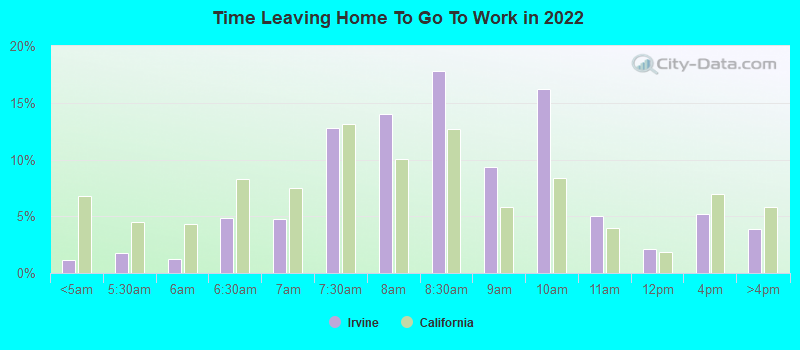
Transportation
Both areas offer diverse transportation options including buses, trains, and ample roadways. Commuting times can be lengthy due to traffic congestion in both areas, but access to public transit options like the Metrolink in the Upper San Gabriel Valley and OCTA in Irvine may ease this.
Transport
Type
Upper San Gabriel Valley
Irvine
Amtrak stations
0
1
Amtrak stations nearby
3
3
FAA registered aircraft
0
173
FAA registered aircraft manufacturers and dealers
0
2
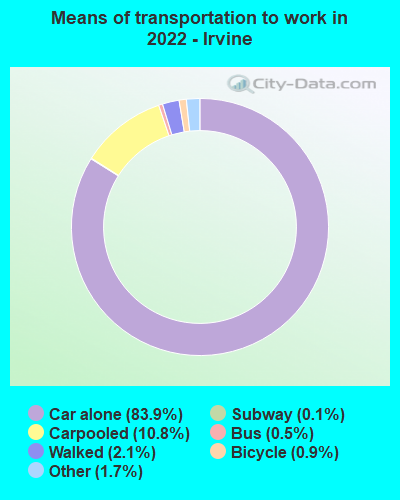
Means of transportation to work
Type
Upper San Gabriel Valley
Irvine
Bicycle
1.1%
1.2%
Bus
3.9%
0.2%
Carpooled
16.6%
9.5%
Car alone
71.1%
84.4%
Motorcycle
0.1%
0.2%
Railroad
0.1%
0.1%
Taxicab
0.1%
0%
Walked
3.2%
2.2%
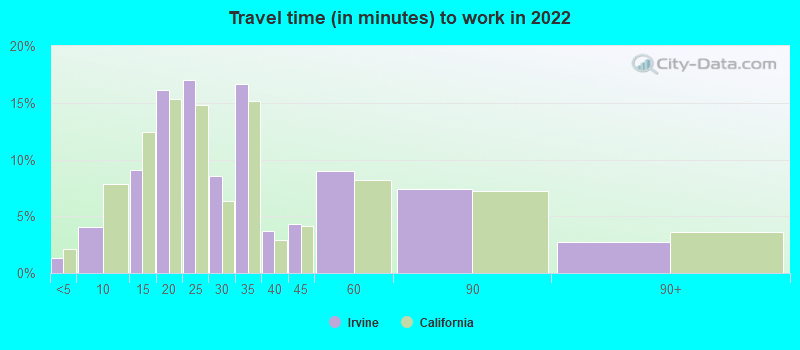
Average travel time to work
Type
Upper San Gabriel Valley
Irvine
Average
29.1 min
30.7 min
Real Estate
The real estate market in both locations is robust but Irvine tends to be more expensive. While Upper San Gabriel Valley offers a blend of residential options from historic homes to modern condos, Irvine is known for its high-end, planned neighborhoods.
Neighborhoods
Upper San Gabriel Valley's neighborhoods provide a mix of urban and suburban living with access to cultural spots, while Irvine's communities are meticulously planned with ample green spaces and community amenities, offering a distinct suburban feel.
Houses and residents
Type
Upper San Gabriel Valley
Irvine
Houses
99,295
122,260
Average household size (people)
3.3
2.6
Houses occupied
96,186 (96.9%)
111,648 (91.3%)
Houses occupied by owners
52,398 (54.5%)
49,861 (44.7%)
Houses occupied by renters
43,788 (45.5%)
61,787 (55.3%)
Median rent asked for vacant for-rent units
$1,771
$3,151
Median price asked for vacant for-sale houses and condos
$1,138,428
$948,000
Estimated median house or condo value
$740,686
$970,500
Median number of rooms in apartments
3.7
3.8
Median number of rooms in houses and condos
5.9
5.9
Renting percentage
44.9%
49.8%
Housing density (houses/condos per square mile)
2,008.8
2,647.3
Household income disparities
44%
41.8%
Housing units without a mortgage
11,525 (24.8%)
316 (1%)
Housing units with both a second mortgage and home equity loan
137 (0.3%)
2,738 (8.4%)
Housing units with a mortgage
34,867 (75.2%)
32,261 (99%)
Housing units with a home equity loan
3,133 (6.8%)
0 (0%)
Housing units with a second mortgage
4,036 (8.7%)
3,066 (9.4%)
Housing units lacking complete kitchen facilities
1.5%
2.2%
Housing units lacking complete plumbing facilities
Self-employed workers in own not incorporated business
10,209
9,200
State government workers
3,180
9,735
Unpaid family workers
401
399
Industries and Occupations
The high-tech sector dominates in Irvine with occupations in this industry being highly sought-after. Upper San Gabriel Valley, however, has a diverse range of industries from education and health to manufacturing, providing a wider breadth of job opportunities.
Both communities provide excellent health care facilities. Upper San Gabriel Valley is home to renowned medical institutions like the City of Hope. Irvine, apart from having top-notch clinics and hospitals, also benefits from proximity to specialized healthcare services in nearby Los Angeles and Orange County.
Health (county statistics)
Type
Upper San Gabriel Valley
Irvine
General health status score of residents in this county from 1 (poor) to 5 (excellent)
Both cities offer sound infrastructure with well-maintained roads, public spaces, and utilities. Irvine, being a master-planned city, presents a more organized urban layout. However, Upper San Gabriel Valley’s urban sprawl has a charm of its own, featuring iconic landmarks like the San Gabriel Mission.
Infrastructure
Type
Upper San Gabriel Valley
Irvine
TV stations
27
2
Nuclear power plants nearby
0
2
Culture and Food
Upper San Gabriel Valley shines in the cultural diversity reflected in its food choices, offering a range of Asian cuisines. Irvine, while also diverse, leans towards a more California-style cuisine, with a focus on fresh, local ingredients.
Sports Teams
Neither city houses major professional sports teams. However, the proximity of Upper San Gabriel Valley to Los Angeles allows easy access to LA's teams. Irvine residents enjoy collegiate sports from the University of California, Irvine.
 Upper San Gabriel Valley, CA
 Irvine, CA