Upper San Gabriel Valley and Fullerton, California, though both located in the same state, offer unique experiences which can cater to different preferences and situations. While Upper San Gabriel Valley brims with natural beauty and a slower-paced lifestyle, Fullerton boasts a vibrant culture centered around education, arts, music, and a happening downtown scene. Understanding the differences from a variety of aspects can help residents and visitors appreciate what each city has to offer.
Both Upper San Gabriel Valley and Fullerton have crime rates that are significantly below the national average, making them safer than many other cities in California. However, Fullerton does experience a slightly higher crime rate primarily due to its more urban terrain and dense population. Authorities in both areas are active and responsive, ensuring the safety and wellbeing of both residents and tourists.
Cost of Living
Living in Upper San Gabriel Valley tends to be more expensive than Fullerton because of its higher housing costs. Groceries, health care, and other basic necessities are also slightly costlier in Upper San Gabriel Valley. Fullerton, on the other hand, offers more affordability in terms of rental prices and overall living costs.
Income Tax
The state of California has a progressive income tax, and both Upper San Gabriel Valley and Fullerton adhere to it. This means that tax rates can vary from 1% to 13.3% depending on income level.
Property Tax
Property tax rates in California are set at the county level and both Fullerton, in Orange County, and Upper San Gabriel Valley, in Los Angeles County, have similar rates, around 1.1%.
Sales Tax
Both Upper San Gabriel Valley and Fullerton adhere to California’s state sales tax rate of 7.25%. However, with local add-ons, the total sales tax comes to approximately 9.5% in Upper San Gabriel Valley and about 8.75% in Fullerton.
Income
Type
Upper San Gabriel Valley
Fullerton
Estimated median household income
$80,436
$95,431
Estimated per capita income
$33,562
$46,429
Cost of living index (U.S. average is 100)
159.5
88.6
If you make $50,000 in Fullerton, you will have to make $90,011 in Upper San Gabriel Valley to maintain the same standard of living.
Geographical Conditions
Geographically, Upper San Gabriel Valley is more naturally scenic, with mountains, valleys, and rivers. Fullerton, while more urbanized, also offers its share of green spaces and parks.
Geographical information
Type
Upper San Gabriel Valley
Fullerton
Land area
49.4 sq. miles
22.2 sq. miles
Population density
6,624.2 people per sq. mile
6,390.8 people per sq. mile
Relative area comparison
Upper San Gabriel Valley, CA Fullerton, CA
Education
While both cities have good quality public and private schools, Fullerton is renowned for its higher education institutions. The city is home to the highly-rated California State University, Fullerton and Fullerton College. Upper San Gabriel Valley, however, boasts of being near some of the top-rated school districts in the Los Angeles County.
The economy of Fullerton is diversified with sectors such as manufacturing, education, and retail playing a significant role. Upper San Gabriel Valley, on the other hand, is known for its strong real estate, healthcare, and retail sectors. Both areas have relatively low unemployment rates with plenty of job opportunities.
Biggest Employers
In Fullerton, some of the biggest employers include California State University, Fullerton, Fullerton School District and St. Jude Medical Center. For Upper San Gabriel Valley, organizations like the City of Hope and East Valley Hospital Medical Center provide significant employment.
In Upper San Gabriel Valley (Los Angeles County), 69.7% voted for Democrats and 27.8% for Republicans in 2012 Presidential Election. In Fullerton (Orange County), 45.8% voted for Democrats and 52.0% for Republicans.
Elections
Type
Democrats
Republicans
Other
Year
Upper San Gabriel Valley
Fullerton
Upper San Gabriel Valley
Fullerton
Upper San Gabriel Valley
Fullerton
2020
71.0%
53.6%
26.9%
44.6%
2.1%
1.8%
2016
72.0%
50.9%
22.5%
42.4%
5.5%
6.7%
2012
69.7%
45.8%
27.8%
52.0%
2.4%
2.3%
2008
69.2%
47.8%
28.8%
50.3%
1.9%
1.9%
2004
63.3%
39.3%
35.7%
60.2%
1.0%
0.5%
2000
63.6%
40.4%
32.4%
55.9%
4.0%
3.7%
1996
59.3%
37.9%
31.0%
51.7%
9.7%
10.5%
Breakdown of population affiliated with a religious congregation
Type
Adherents
Congregations
Religion
Upper San Gabriel Valley
Fullerton
Upper San Gabriel Valley
Fullerton
CATHOLIC CHURCH
36.1%
26.5%
4.7%
4.4%
SOUTHERN BAPTIST CONVENTION
1.0%
2.3%
9.0%
8.8%
MUSLIM ESTIMATE
0.7%
0.8%
1.0%
1.3%
AMERICAN BAPTIST CHURCHES IN THE USA
0.5%
0.2%
3.1%
1.7%
SEVENTH DAY ADVENTIST CHURCH
0.5%
0.4%
2.4%
1.3%
EPISCOPAL CHURCH
0.4%
0.4%
1.4%
1.4%
EVANGELICAL LUTHERAN CHURCH IN AMERICA
0.2%
0.4%
1.9%
2.3%
LUTHERAN CHURCH
0.2%
0.6%
1.6%
2.0%
REFORMED CHURCH IN AMERICA
0.1%
0.3%
0.2%
0.2%
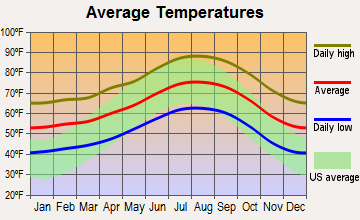
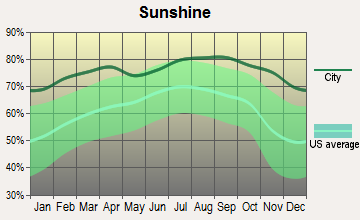
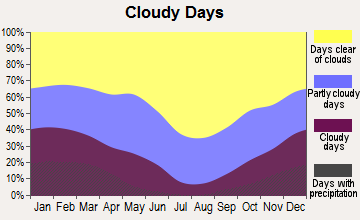
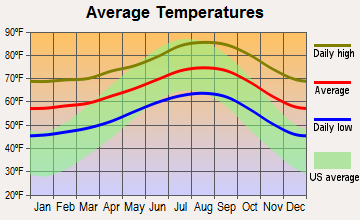
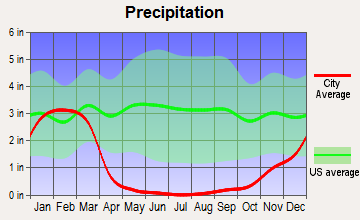
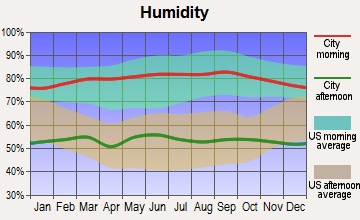
Weather
Upper San Gabriel Valley and Fullerton share a typical southern California climate. They receive ample sunshine throughout the year with mild winters and warm to hot summers. However, due to its proximity to the mountains, Upper San Gabriel Valley can sometimes experience slightly cooler temperatures and more rainfall compared to Fullerton.
Weather and climate
Type
Upper San Gabriel Valley
Fullerton
Temperature - Average
63.5°F
65.4°F
Humidity - Average morning or afternoon humidity
62.2%
69.4%
Humidity - Differences between morning and afternoon humidity
17.3%
25.5%
Humidity - Maximum monthly morning or afternoon humidity
67%
77.5%
Humidity - Minimum monthly morning or afternoon humidity
49.7%
52%
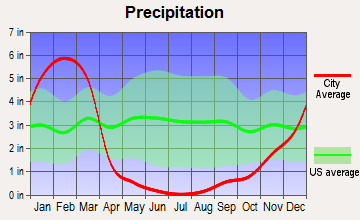
Precipitation - Yearly average
24.3 in
12.8 in
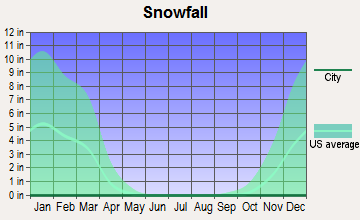
Snowfall - Yearly average
0 in
0 in
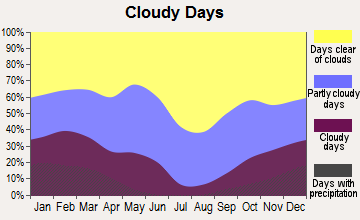
Clouds - Number of days clear of clouds
29.4%
26.7%
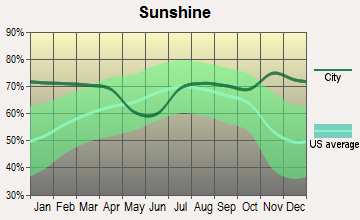
Sunshine amount - Average
78.4%
78.4%
Sunshine amount - Differences during a year
22%
22%
Sunshine amount - Maximum monthly
85%
85%
Sunshine amount - Minimum monthly
63%
63%
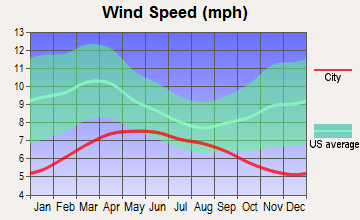
Wind speed - Average
2.6 mph
5.6 mph
Average climate in Upper San Gabriel Valley, California
Average climate in Fullerton, California
Air pollution
Type
AQI
CO
NO2
OZONE
PB
PM10
PM25
SO2
Year
Upper San Gabriel Valley
Fullerton
Upper San Gabriel Valley
Fullerton
Upper San Gabriel Valley
Fullerton
Upper San Gabriel Valley
Fullerton
Upper San Gabriel Valley
Fullerton
Upper San Gabriel Valley
Fullerton
Upper San Gabriel Valley
Fullerton
Upper San Gabriel Valley
Fullerton
2018
142
142
0.37
0.33
14.2
13.6
28.5
26.1
0.007
0.007
28.5
27.4
14.1
12.3
0.4
0.6
2017
146
146
0.36
0.38
15.1
14.7
29.8
26.5
0.007
0.007
31.2
27.1
14.0
13.6
0.5
0.5
2016
136
136
0.33
0.41
15.5
14.7
28.1
26.2
0.007
0.007
28.6
24.4
13.0
12.9
0.4
0.4
2015
143
143
0.33
0.39
15.2
15.1
28.4
26.2
0.007
0.006
28.4
25.2
15.2
14.8
0.3
0.4
2014
141
141
0.35
0.35
16.7
15.4
28.0
25.5
0.007
0.007
31.3
27.0
14.9
16.1
0.5
0.6
2013
144
144
0.39
0.40
17.3
16.1
26.6
24.4
0.007
0.006
29.3
28.6
14.4
14.0
0.4
0.5
2012
148
148
0.43
0.43
18.2
16.0
25.9
24.5
0.006
0.005
28.7
27.4
16.5
14.8
0.5
0.3
2011
146
146
0.47
0.43
19.1
17.1
24.8
25.4
0.008
0.007
28.9
27.6
17.6
16.1
0.5
0.7
2010
133
133
0.48
0.46
19.2
17.7
24.6
24.8
0.011
0.012
27.0
24.2
15.5
14.9
0.5
0.6
2009
153
156
0.39
0.47
21.0
19.4
25.4
25.3
0.011
0.010
32.0
25.1
17.2
15.5
0.4
0.9
2008
155
157
0.54
0.48
23.1
20.7
24.9
25.1
0.013
0.012
32.1
30.5
16.9
18.7
0.6
1.0
2007
135
135
0.55
0.49
24.6
20.9
23.1
24.7
0.016
0.014
N/A
N/A
N/A
N/A
1.0
0.9
2006
128
128
0.58
0.54
24.9
21.4
22.8
25.2
0.009
0.008
N/A
N/A
N/A
N/A
1.5
1.5
2005
128
128
0.61
0.54
25.4
22.9
21.3
24.3
0.015
0.014
N/A
N/A
N/A
N/A
1.7
1.4
2004
134
134
0.71
0.63
26.0
23.0
23.8
28.5
0.018
0.016
N/A
N/A
N/A
N/A
2.4
1.8
2003
143
143
0.89
0.78
30.7
26.2
23.3
22.3
0.025
0.026
N/A
N/A
N/A
N/A
1.6
1.3
2002
137
134
0.91
0.81
32.5
25.6
21.9
20.7
0.022
0.021
N/A
N/A
N/A
N/A
2.2
2.3
2001
143
143
1.04
0.93
33.1
27.9
20.1
20.5
0.031
0.037
N/A
N/A
N/A
N/A
2.3
2.1
2000
151
152
1.07
0.96
33.5
30.9
20.1
21.1
0.028
0.031
N/A
N/A
N/A
N/A
1.3
1.8
Natural disasters
Type
Upper San Gabriel Valley
Fullerton
Tornado activity compared to U.S. average
18%
19.3%
Earthquake activity compared to U.S. average
7,264.5%
7,071.6%
Natural disasters compared to U.S. average
57%
32%
Transportation
Public transit is more accessible in Fullerton, with the city served by several bus and rail lines. Upper San Gabriel Valley also has public transportation options, but their spread and frequency are lesser than Fullerton. For commuting, both cities offer easy connectivity to other parts of Southern California.
Transport
Type
Upper San Gabriel Valley
Fullerton
Amtrak stations
0
1
Amtrak stations nearby
3
3
FAA registered aircraft
0
99
FAA registered aircraft manufacturers and dealers
0
6
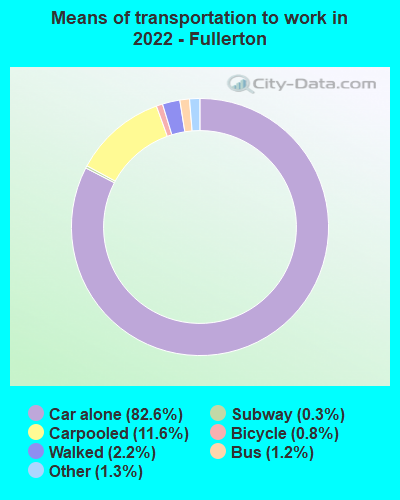
Means of transportation to work
Type
Upper San Gabriel Valley
Fullerton
Bicycle
1.1%
0.3%
Bus
3.9%
0.8%
Carpooled
16.6%
12.7%
Car alone
71.1%
82.9%
Motorcycle
0.1%
0.3%
Railroad
0.1%
0.6%
Subway
0%
0.1%
Taxicab
0.1%
0%
Walked
3.2%
1.5%
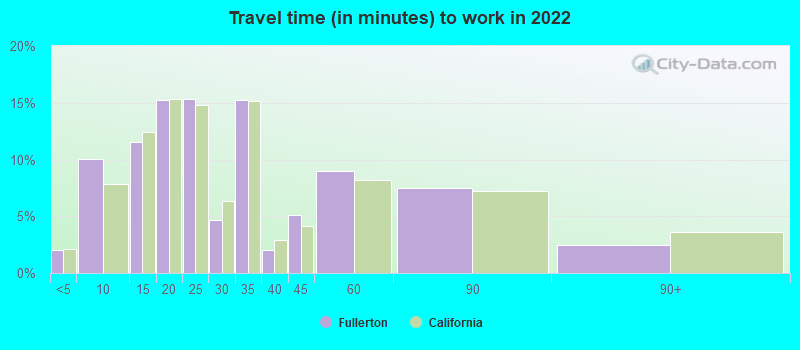
Average travel time to work
Type
Upper San Gabriel Valley
Fullerton
Average
29.1 min
29.7 min
Real Estate
Real estate in Upper San Gabriel Valley tends to be on the pricier side due to its more desirable locations, larger lot sizes, and the prevalence of single-family homes. Fullerton, meanwhile, offers a more affordable housing market with a mix of single-family homes, apartments, and condos.
Neighborhoods
Upper San Gabriel Valley is known for its tranquil, family-friendly neighborhoods mingling with the natural landscape. Fullerton offers a mix of residential areas, from bustling downtown apartments to peaceful suburban neighborhoods.
Houses and residents
Type
Upper San Gabriel Valley
Fullerton
Houses
99,295
49,834
Average household size (people)
3.3
2.9
Houses occupied
96,186 (96.9%)
48,423 (97.2%)
Houses occupied by owners
52,398 (54.5%)
23,525 (48.6%)
Houses occupied by renters
43,788 (45.5%)
24,898 (51.4%)
Median rent asked for vacant for-rent units
$1,771
$875.95
Median price asked for vacant for-sale houses and condos
$1,138,428
$972,430
Estimated median house or condo value
$740,686
$790,900
Median number of rooms in apartments
3.7
3.6
Median number of rooms in houses and condos
5.9
6.3
Renting percentage
44.9%
45.8%
Housing density (houses/condos per square mile)
2,008.8
2,244.8
Household income disparities
44%
42.3%
Housing units without a mortgage
11,525 (24.8%)
371 (2.4%)
Housing units with both a second mortgage and home equity loan
137 (0.3%)
1,362 (8.8%)
Housing units with a mortgage
34,867 (75.2%)
15,028 (97.6%)
Housing units with a home equity loan
3,133 (6.8%)
0 (0%)
Housing units with a second mortgage
4,036 (8.7%)
1,474 (9.6%)
Housing units lacking complete kitchen facilities
1.5%
4%
Housing units lacking complete plumbing facilities
Self-employed workers in own not incorporated business
10,209
4,512
State government workers
3,180
2,615
Unpaid family workers
401
22
Industries and Occupations
In Upper San Gabriel Valley, the healthcare, retail, and real estate sectors dominate, while Fullerton has a robust manufacturing sector alongside education and retail. Many residents in Fullerton work in education, owing to the presence of several higher education institutions.
Both cities are served by commendable healthcare systems. Fullerton’s St Jude Medical Center is nationally recognized, while Upper San Gabriel Valley hosts the renowned City of Hope, well-known for its cancer research and treatment.
Health (county statistics)
Type
Upper San Gabriel Valley
Fullerton
General health status score of residents in this county from 1 (poor) to 5 (excellent)
Upper San Gabriel Valley has well-maintained infrastructure with good road and transit systems although it being more rural means less urban amenities. Fullerton, being a larger city, has more developed infrastructure with more public spaces, parks, and cultural facilities.
Infrastructure
Type
Upper San Gabriel Valley
Fullerton
TV stations
27
15
Culture and Food
Fullerton is revered for its lively cultural scene, diverse food options, and thriving music and arts scene. Upper San Gabriel Valley, while quieter, boasts of a rich Asian influence in its culture and cuisine, offering authentic dining experiences.
Sports Teams
Neither Fullerton nor Upper San Gabriel Valley have a major sports team based in the city. However, being in Southern California, residents are close to Los Angeles' major professional sports teams, such as the Lakers, Clippers, Dodgers, and Rams.
 Upper San Gabriel Valley, CA
 Fullerton, CA