Upper San Gabriel Valley, CA vs East Los Angeles, CA
Comparison between living in Upper San Gabriel Valley and East Los Angeles, CA tends to reveal significant contrasts. These contrasting factors can be outlined across diverse aspects including crime and safety, cost of living, education, economy, infrastructure, taxation, food, sports, geographical conditions, and healthcare. Existing residents seeking to relocate or prospective tourists will discover unique and insightful perspectives of the two regions.
In terms of crime and safety, Upper San Gabriel Valley is typically safer than East Los Angeles. Crime rates are notably lower in Upper San Gabriel Valley, providing a more safe and serene environment for residents and tourists. East Los Angeles, while having made strides in recent years, still experiences higher crime rates compared to Upper San Gabriel Valley. Nonetheless, residents and visitors are advised to remain vigilant at all times.
Cost of Living
The cost of living in Upper San Gabriel Valley is significantly higher compared to East Los Angeles. This is largely attributed to the vast economic differences, with Upper San Gabriel Valley being home to an affluent population and featuring more upscale amenities and services. East Los Angeles is generally more affordable, making it a popular destination for people seeking cheaper accommodation and lower living costs.
Income Tax
Income tax is also equal in both places, as it is governed by the state of California. The income tax rates vary based on income brackets, ranging from 1% to 13.3%.
Property Tax
Property tax rates vary more significantly, due to the difference in property values between the two regions. Upper San Gabriel Valley, with its higher property values, generally experiences higher property tax bills compared to East Los Angeles.
Sales Tax
Both regions are governed by California's sales tax policy, which is currently set at 7.25%. However, including local city sales taxes, the total can be higher. As such, this isn't a differentiating factor between Upper San Gabriel Valley and East Los Angeles.
Income
Type
Upper San Gabriel Valley
East Los Angeles
Estimated median household income
$80,436
$65,971
Estimated per capita income
$33,562
$21,820
Cost of living index (U.S. average is 100)
159.5
140.8
If you make $50,000 in East Los Angeles, you will have to make $56,641 in Upper San Gabriel Valley to maintain the same standard of living.
Geographical Conditions
The Upper San Gabriel Valley is nestled against the scenic San Gabriel Mountains, offering beautiful natural views and opportunities for outdoor activities. East Los Angeles, while more urban, is known for its parks and locally treasured landmarks like the Mariachi Plaza.
Geographical information
Type
Upper San Gabriel Valley
East Los Angeles
Land area
49.4 sq. miles
7.4 sq. miles
Population density
6,624.2 people per sq. mile
15,558 people per sq. mile
Relative area comparison
Upper San Gabriel Valley, CA East Los Angeles, CA
Education
In terms of education, Upper San Gabriel Valley is renowned for its high-ranking schools, making it an ideal place for families. On the other hand, the education system in East Los Angeles has faced challenges, though recent improvements have been notable. Nonetheless, East Los Angeles houses some high-quality educational institutions and unique cultural learning opportunities.
The economy in Upper San Gabriel Valley is robust, with thriving sectors in technology, education, healthcare and retail. In contrast, East Los Angeles has a more industrial-based economy with a focus on manufacturing, logistics, and food services. Both regions have healthy job markets but Upper San Gabriel Valley typically offers more high-paying job opportunities.
Biggest Employers
In Upper San Gabriel Valley, some of the biggest employers are educational institutions, healthcare facilities, and tech companies. East Los Angeles, on the other hand, has large manufacturing companies, logistics firms, and food service providers as major employers. Both offer diverse employment opportunities suited to different skill sets.
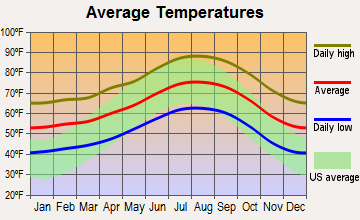
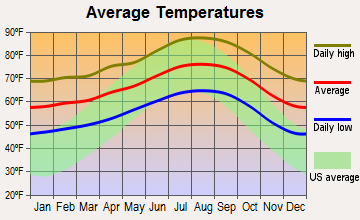
Weather
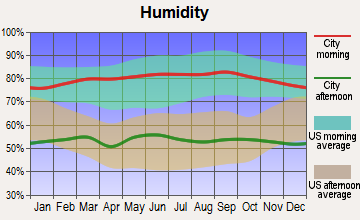
Climate-wise, both regions share a Mediterranean climate characterized by warm, dry summers and cool, wet winters. However, the Upper San Gabriel Valley experiences slightly hotter summers due to its inland position which is a contrast to East Los Angeles that benefits from the coastal breezes which help moderate temperatures.
Weather and climate
Type
Upper San Gabriel Valley
East Los Angeles
Temperature - Average
63.5°F
66.6°F
Humidity - Average morning or afternoon humidity
62.2%
61%
Humidity - Differences between morning and afternoon humidity
17.3%
16.2%
Humidity - Maximum monthly morning or afternoon humidity
67%
65.3%
Humidity - Minimum monthly morning or afternoon humidity
49.7%
49.1%
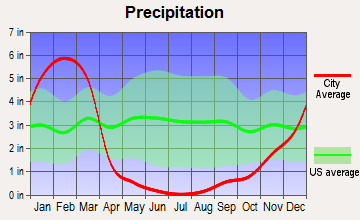
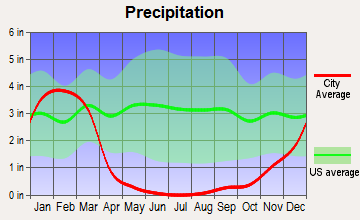
Precipitation - Yearly average
24.3 in
15.6 in
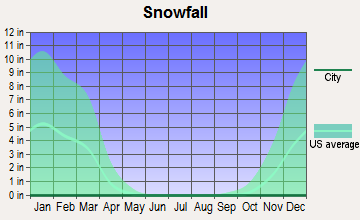
Snowfall - Yearly average
0 in
0 in
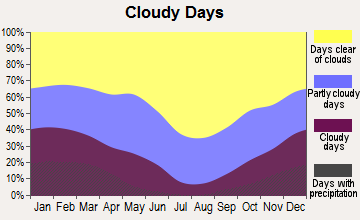
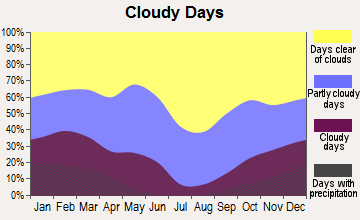
Clouds - Number of days clear of clouds
29.4%
30.4%
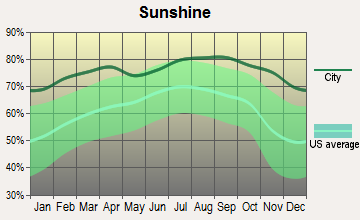
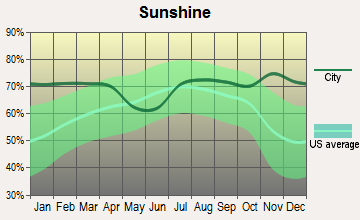
Sunshine amount - Average
78.4%
78.4%
Sunshine amount - Differences during a year
22%
22%
Sunshine amount - Maximum monthly
85%
85%
Sunshine amount - Minimum monthly
63%
63%
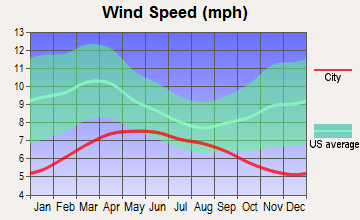
Wind speed - Average
2.6 mph
2.1 mph
Average climate in Upper San Gabriel Valley, California
Average climate in East Los Angeles, California
Air pollution
Type
AQI
CO
NO2
OZONE
PB
PM10
PM25
SO2
Year
Upper San Gabriel Valley
East Los Angeles
Upper San Gabriel Valley
East Los Angeles
Upper San Gabriel Valley
East Los Angeles
Upper San Gabriel Valley
East Los Angeles
Upper San Gabriel Valley
East Los Angeles
Upper San Gabriel Valley
East Los Angeles
Upper San Gabriel Valley
East Los Angeles
Upper San Gabriel Valley
East Los Angeles
2018
142
142
0.37
0.41
14.2
14.1
28.5
25.4
0.007
0.008
28.5
27.4
14.1
15.6
0.4
0.4
2017
146
143
0.36
0.44
15.1
15.0
29.8
26.4
0.007
0.007
31.2
29.7
14.0
15.8
0.5
0.4
2016
136
129
0.33
0.41
15.5
14.9
28.1
25.7
0.007
0.007
28.6
27.2
13.0
14.9
0.4
0.3
2015
143
138
0.33
0.43
15.2
15.3
28.4
26.7
0.007
0.005
28.4
27.2
15.2
16.9
0.3
0.2
2014
141
138
0.35
0.46
16.7
16.0
28.0
26.1
0.007
0.007
31.3
29.2
14.9
19.0
0.5
0.3
2013
144
142
0.39
0.48
17.3
17.3
26.6
24.3
0.007
0.007
29.3
28.2
14.4
17.8
0.4
0.4
2012
148
145
0.43
0.49
18.2
17.5
25.9
24.1
0.006
0.007
28.7
27.5
16.5
18.7
0.5
0.5
2011
146
143
0.47
0.50
19.1
18.8
24.8
22.8
0.008
0.009
28.9
30.8
17.6
17.8
0.5
0.4
2010
133
131
0.48
0.52
19.2
19.0
24.6
21.8
0.011
0.023
27.0
31.7
15.5
16.7
0.5
0.4
2009
153
151
0.39
0.50
21.0
21.2
25.4
22.5
0.011
0.012
32.0
42.7
17.2
18.2
0.4
0.5
2008
155
154
0.54
0.46
23.1
24.1
24.9
21.7
0.013
0.014
32.1
41.8
16.9
18.7
0.6
0.6
2007
135
130
0.55
0.52
24.6
24.3
23.1
21.0
0.016
0.018
N/A
N/A
N/A
N/A
1.0
1.1
2006
128
125
0.58
0.58
24.9
24.8
22.8
21.4
0.009
0.010
N/A
N/A
N/A
N/A
1.5
1.8
2005
128
128
0.61
0.64
25.4
25.7
21.3
20.2
0.015
0.016
N/A
N/A
N/A
N/A
1.7
2.0
2004
134
138
0.71
0.74
26.0
27.6
23.8
23.0
0.018
0.020
N/A
N/A
N/A
N/A
2.4
2.4
2003
143
144
0.89
0.93
30.7
30.9
23.3
21.0
0.025
0.028
N/A
N/A
N/A
N/A
1.6
1.9
2002
137
143
0.91
1.02
32.5
33.0
21.9
21.6
0.022
0.025
N/A
N/A
N/A
N/A
2.2
2.4
2001
143
143
1.04
1.15
33.1
35.4
20.1
18.7
0.031
0.041
N/A
N/A
N/A
N/A
2.3
2.3
2000
151
147
1.07
1.09
33.5
34.0
20.1
17.7
0.028
0.034
N/A
N/A
N/A
N/A
1.3
1.4
Natural disasters
Type
Upper San Gabriel Valley
East Los Angeles
Tornado activity compared to U.S. average
18%
17.9%
Earthquake activity compared to U.S. average
7,264.5%
7,124.7%
Natural disasters compared to U.S. average
57%
57%
Transportation
Both Upper San Gabriel Valley and East Los Angeles feature accessible public transit systems. However, commuting is typically shorter in Upper San Gabriel Valley due to its more organized layout and superior infrastructure. East LA, while having a denser population, still offers reliable public transport and highways for commuting.
Transport
Type
Upper San Gabriel Valley
East Los Angeles
Amtrak stations nearby
3
3
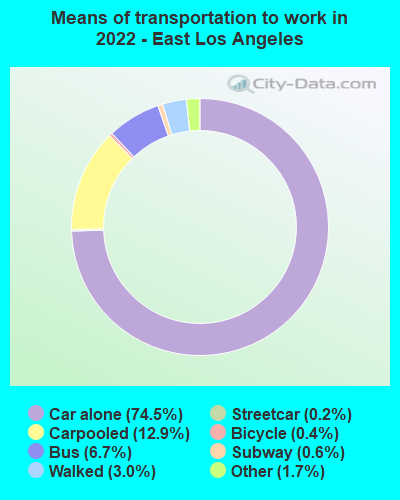
Means of transportation to work
Type
Upper San Gabriel Valley
East Los Angeles
Bicycle
1.1%
0.6%
Bus
3.9%
4.4%
Carpooled
16.6%
13.3%
Car alone
71.1%
75.8%
Motorcycle
0.1%
0%
Streetcar
0.1%
0.3%
Subway
0%
0.4%
Taxicab
0.1%
0.1%
Walked
3.2%
2.8%
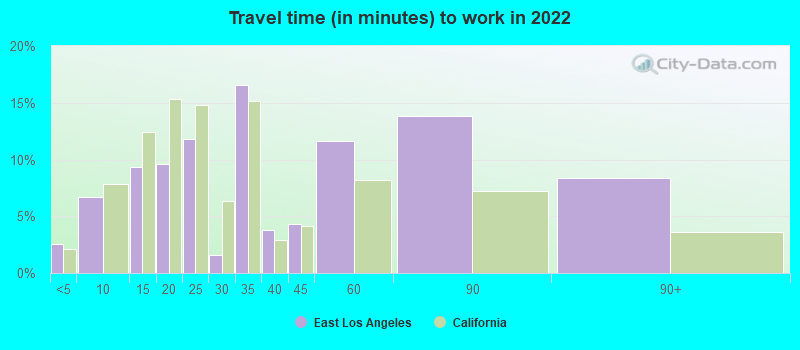
Average travel time to work
Type
Upper San Gabriel Valley
East Los Angeles
Average
29.1 min
36.1 min
Real Estate
Upper San Gabriel Valley's real estate market is more expensive compared to East Los Angeles due to the area's affluent population and higher demand for properties. East LA properties are generally more affordable, making it a viable option for those seeking a less expensive housing market.
Neighborhoods
Neighborhoods in Upper San Gabriel Valley are often upscale, featuring well-maintained homes, lush landscaping, and access to high-quality amenities. East Los Angeles neighborhoods, while more modest, boast a traditional, vibrant Latino culture, and are known for their tight-knit communities.
Houses and residents
Type
Upper San Gabriel Valley
East Los Angeles
Houses
99,295
33,124
Average household size (people)
3.3
4.1
Houses occupied
96,186 (96.9%)
31,072 (93.8%)
Houses occupied by owners
52,398 (54.5%)
9,953 (32%)
Houses occupied by renters
43,788 (45.5%)
21,119 (68%)
Median rent asked for vacant for-rent units
$1,771
$1,359
Median price asked for vacant for-sale houses and condos
$1,138,428
$1,683,130
Estimated median house or condo value
$740,686
$592,100
Median number of rooms in apartments
3.7
3.9
Median number of rooms in houses and condos
5.9
5.1
Renting percentage
44.9%
64.4%
Housing density (houses/condos per square mile)
2,008.8
4,450.2
Household income disparities
44%
40.5%
Housing units without a mortgage
11,525 (24.8%)
129 (2.3%)
Housing units with both a second mortgage and home equity loan
137 (0.3%)
276 (5%)
Housing units with a mortgage
34,867 (75.2%)
5,365 (97.7%)
Housing units with a home equity loan
3,133 (6.8%)
76 (1.4%)
Housing units with a second mortgage
4,036 (8.7%)
604 (11%)
Housing units lacking complete kitchen facilities
1.5%
4.3%
Housing units lacking complete plumbing facilities
Self-employed workers in own not incorporated business
10,209
4,362
State government workers
3,180
1,105
Unpaid family workers
401
134
Industries and Occupations
Major industries in Upper San Gabriel Valley include technology, healthcare, and education, whereas in East Los Angeles, the leading industries are manufacturing, logistics, and food services. As such, the types of occupations available in these regions differ markedly, matching the respective dominant industries.
Health Care
Healthcare facilities in Upper San Gabriel Valley are robust, with several renowned hospitals and specialty clinics. East Los Angeles has also adequate healthcare facilities, but Upper San Gabriel Valley has a higher per capita availability of healthcare resources.
Infrastructure
Upper San Gabriel Valley boasts superior infrastructure, featuring well-maintained roads, high-end real estate, advanced health facilities, and excellent schools. Meanwhile, East Los Angeles, though having an improved infrastructure over the years, lags behind in comparison. However, it's worth noting that East LA is currently undergoing significant revitalization efforts.
Infrastructure
Type
Upper San Gabriel Valley
East Los Angeles
TV stations
27
23
Culture and Food
Culturally, Upper San Gabriel Valley is known for its variety of food scenes, upscale restaurants, and shopping centers. East Los Angeles, on the other hand, is celebrated for its Latino heritage, vibrant street food scene, and community markets, offering a more authentic cultural experience.
Sports Teams
Both regions are close to Los Angeles, home to multiple professional sports teams such as the Los Angeles Lakers, Clippers, Dodgers, and Rams. As such, sports fans in both Upper San Gabriel Valley and East Los Angeles have access to high-level sports entertainment.
 Upper San Gabriel Valley, CA
 East Los Angeles, CA