The Upper San Gabriel Valley and the Central Coast of California are two diverse regions within the state, each offering distinct experiences and a unique pace of life. While the former is defined by its suburban atmosphere and proximity to Los Angeles, the latter is recognized by its scenic coastline and a laid-back lifestyle. Below, we will compare these two regions based on various factors including crime and safety, weather, cost of living, education, and more to help individuals considering relocation or a visit.
The Upper San Gabriel Valley, known for cities like Pasadena and Arcadia, generally has reported lower crime rates than the national average, offering a level of safety that many find desirable. However, like any densely populated area, crime levels can vary by neighborhood.
In contrast, the Central Coast, which includes towns like Santa Barbara and San Luis Obispo, also demonstrates low crime rates, with some areas offering notably safe environments. Again, it's advisable to research individual neighborhoods prior to making any decisions.
Cost of Living
Living expenses in the Upper San Gabriel Valley are high, reflecting the going rate for convenience and proximity to LA. Housing costs are notably steep, largely contributing to the overall cost of living.
The Central Coast shares a high cost of living, driven largely by high housing costs. Some coastal areas, such as Santa Barbara, are particularly expensive.
Income Tax
In both regions, the state income tax follows the California State tax schedule. Rates range from 1% on the first $8,932 of taxable income, up to 13.3% on income over $1,000,000.
Property Tax
The property tax rate in the Upper San Gabriel Valley averages around 1.16% of assessed home value.
In the Central Coast region, the property tax rate averages around 0.80% of a property's assessed fair market value, although it can fluctuate depending on the specific county.
Sales Tax
The sales tax in the Upper San Gabriel Valley varies by city, typically ranging from 9.5% to 10.25%.
The Central Coast usually sees a sales tax rate of about 8.75%, although it can go up to around 9% in some cities.
Income
Type
Upper San Gabriel Valley
Central Coast
Estimated median household income
$80,436
$106,582
Estimated per capita income
$33,562
$70,103
Cost of living index (U.S. average is 100)
159.5
101.8
If you make $50,000 in Central Coast, you will have to make $78,340 in Upper San Gabriel Valley to maintain the same standard of living.
Geographical Conditions
Geographically, the Upper San Gabriel Valley is characterized by its valley terrain and urban sprawl.
The Central Coast is known for its stunning coastlines, rolling vineyards, and mountain ranges, offering a variety of recreational opportunities.
Geographical information
Type
Upper San Gabriel Valley
Central Coast
Land area
49.4 sq. miles
50.4 sq. miles
Population density
6,624.2 people per sq. mile
4,732.1 people per sq. mile
Relative area comparison
Upper San Gabriel Valley, CA Central Coast, CA
Education
The Upper San Gabriel Valley is home to some impressive educational institutions, including the California Institute of Technology in Pasadena.
The Central Coast also rates highly for education, with school systems in areas like San Luis Obispo earning high ratings. Additionally, it is home to several universities, including University of California, Santa Barbara.
Economic activity in the Upper San Gabriel Valley is diverse, with health care and social assistance, retail trade, and educational services being the primary industries.
The Central Coast economy is similarly varied, with health care and social assistance, educational services, and agriculture playing large roles. Santa Barbara County is also recognized for its thriving wine industry.
Biggest Employers
In the Upper San Gabriel Valley, major employers include the Huntington Memorial Hospital in Pasadena and the City of Hope National Medical Center in Duarte.
On the Central Coast, the largest employers include the University of California, Santa Barbara, and Pacific Gas & Electric.
In Upper San Gabriel Valley (Los Angeles County), 69.7% voted for Democrats and 27.8% for Republicans in 2012 Presidential Election. In Central Coast (Orange County), 45.8% voted for Democrats and 52.0% for Republicans.
Elections
Type
Democrats
Republicans
Other
Year
Upper San Gabriel Valley
Central Coast
Upper San Gabriel Valley
Central Coast
Upper San Gabriel Valley
Central Coast
2020
71.0%
53.6%
26.9%
44.6%
2.1%
1.8%
2016
72.0%
50.9%
22.5%
42.4%
5.5%
6.7%
2012
69.7%
45.8%
27.8%
52.0%
2.4%
2.3%
2008
69.2%
47.8%
28.8%
50.3%
1.9%
1.9%
2004
63.3%
39.3%
35.7%
60.2%
1.0%
0.5%
2000
63.6%
40.4%
32.4%
55.9%
4.0%
3.7%
1996
59.3%
37.9%
31.0%
51.7%
9.7%
10.5%
Breakdown of population affiliated with a religious congregation
Type
Adherents
Congregations
Religion
Upper San Gabriel Valley
Central Coast
Upper San Gabriel Valley
Central Coast
CATHOLIC CHURCH
36.1%
26.5%
4.7%
4.4%
SOUTHERN BAPTIST CONVENTION
1.0%
2.3%
9.0%
8.8%
MUSLIM ESTIMATE
0.7%
0.8%
1.0%
1.3%
AMERICAN BAPTIST CHURCHES IN THE USA
0.5%
0.2%
3.1%
1.7%
SEVENTH DAY ADVENTIST CHURCH
0.5%
0.4%
2.4%
1.3%
EPISCOPAL CHURCH
0.4%
0.4%
1.4%
1.4%
EVANGELICAL LUTHERAN CHURCH IN AMERICA
0.2%
0.4%
1.9%
2.3%
LUTHERAN CHURCH
0.2%
0.6%
1.6%
2.0%
REFORMED CHURCH IN AMERICA
0.1%
0.3%
0.2%
0.2%
Weather
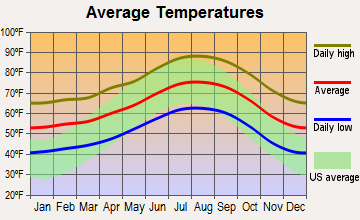
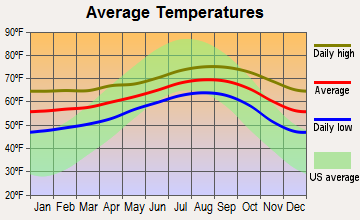
The Upper San Gabriel Valley is renowned for its Mediterranean-like climate, characterized by hot summers and mild winters. Temperatures can reach the 90s (degrees Fahrenheit) during summer months.
On the other hand, the Central Coast offers a cooler, more temperate climate. The coastal influence ensures milder summers and somewhat cooler winters, making it closer to a true Mediterranean climate.
Weather and climate
Type
Upper San Gabriel Valley
Central Coast
Temperature - Average
63.5°F
62.4°F
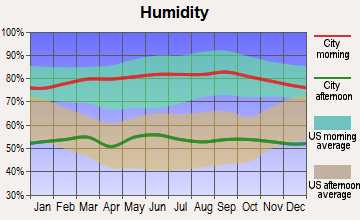
Humidity - Average morning or afternoon humidity
62.2%
69.7%
Humidity - Differences between morning and afternoon humidity
17.3%
26%
Humidity - Maximum monthly morning or afternoon humidity
67%
78.1%
Humidity - Minimum monthly morning or afternoon humidity
49.7%
52%
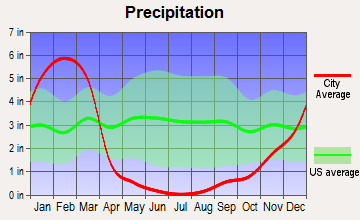
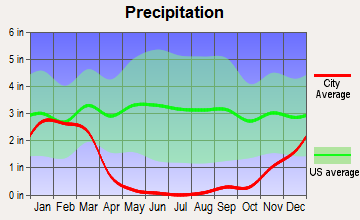
Precipitation - Yearly average
24.3 in
12.1 in
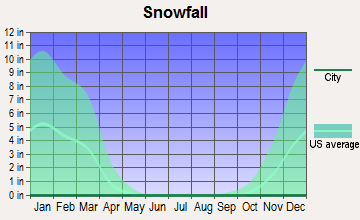
Snowfall - Yearly average
0 in
0 in
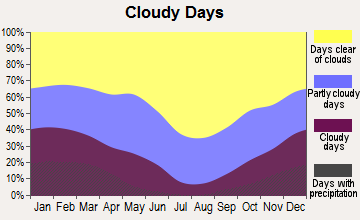
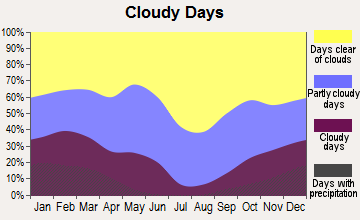
Clouds - Number of days clear of clouds
29.4%
26.6%
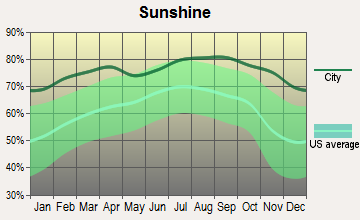
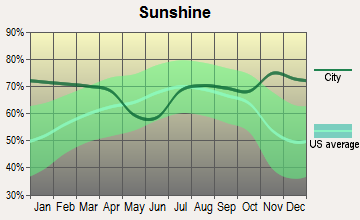
Sunshine amount - Average
78.4%
78.3%
Sunshine amount - Differences during a year
22%
21.7%
Sunshine amount - Maximum monthly
85%
84.4%
Sunshine amount - Minimum monthly
63%
62.7%
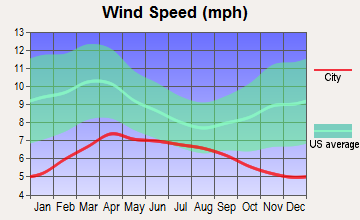
Wind speed - Average
2.6 mph
5.8 mph
Average climate in Upper San Gabriel Valley, California
Average climate in Central Coast, California
Air pollution
Type
AQI
CO
NO2
OZONE
PB
PM10
PM25
SO2
Year
Upper San Gabriel Valley
Central Coast
Upper San Gabriel Valley
Central Coast
Upper San Gabriel Valley
Central Coast
Upper San Gabriel Valley
Central Coast
Upper San Gabriel Valley
Central Coast
Upper San Gabriel Valley
Central Coast
Upper San Gabriel Valley
Central Coast
Upper San Gabriel Valley
Central Coast
2018
142
119
0.37
0.29
14.2
14.2
28.5
28.9
0.007
N/A
28.5
27.5
14.1
12.6
0.4
0.7
2017
146
116
0.36
0.27
15.1
12.9
29.8
31.6
0.007
N/A
31.2
26.7
14.0
13.8
0.5
0.5
2016
136
102
0.33
0.26
15.5
10.6
28.1
31.2
0.007
N/A
28.6
24.1
13.0
12.5
0.4
0.1
2015
143
106
0.33
0.26
15.2
11.8
28.4
31.8
0.007
N/A
28.4
25.0
15.2
14.5
0.3
0.1
2014
141
109
0.35
0.23
16.7
11.3
28.0
30.2
0.007
N/A
31.3
26.7
14.9
15.6
0.5
0.3
2013
144
107
0.39
0.27
17.3
12.3
26.6
29.3
0.007
0.003
29.3
29.4
14.4
14.1
0.4
0.2
2012
148
103
0.43
0.21
18.2
10.6
25.9
28.0
0.006
0.004
28.7
28.1
16.5
14.4
0.5
0.1
2011
146
109
0.47
0.25
19.1
12.7
24.8
28.2
0.008
0.006
28.9
27.7
17.6
15.9
0.5
0.6
2010
133
102
0.48
0.26
19.2
12.0
24.6
27.6
0.011
0.011
27.0
23.6
15.5
14.1
0.5
0.6
2009
153
118
0.39
0.29
21.0
13.6
25.4
29.2
0.011
0.009
32.0
24.3
17.2
14.5
0.4
1.1
2008
155
124
0.54
0.35
23.1
14.0
24.9
30.1
0.013
0.008
32.1
29.5
16.9
21.6
0.6
1.1
2007
135
100
0.55
0.32
24.6
14.0
23.1
28.5
0.016
0.010
N/A
N/A
N/A
N/A
1.0
0.8
2006
128
109
0.58
0.35
24.9
15.1
22.8
27.2
0.009
0.005
N/A
N/A
N/A
N/A
1.5
1.3
2005
128
91
0.61
0.32
25.4
14.6
21.3
29.4
0.015
0.011
N/A
N/A
N/A
N/A
1.7
1.3
2004
134
118
0.71
0.46
26.0
16.3
23.8
31.5
0.018
0.012
N/A
N/A
N/A
N/A
2.4
1.6
2003
143
116
0.89
0.59
30.7
19.1
23.3
32.5
0.025
0.046
N/A
N/A
N/A
N/A
1.6
1.1
2002
137
103
0.91
0.58
32.5
18.8
21.9
28.2
0.022
0.010
N/A
N/A
N/A
N/A
2.2
1.6
2001
143
109
1.04
0.67
33.1
18.2
20.1
27.8
0.031
0.011
N/A
N/A
N/A
N/A
2.3
1.5
2000
151
116
1.07
0.79
33.5
20.6
20.1
26.0
0.028
0.016
N/A
N/A
N/A
N/A
1.3
1.9
Natural disasters
Type
Upper San Gabriel Valley
Central Coast
Tornado activity compared to U.S. average
18%
18.4%
Earthquake activity compared to U.S. average
7,264.5%
6,801.5%
Natural disasters compared to U.S. average
57%
32%
Transportation
Public transportation in the Upper San Gabriel Valley is robust, with multiple rail and bus lines serving the area. The extensive transportation network makes commuting straightforward, although traffic congestion is common.
The Central Coast provides a range of public transport options, and while some areas are well-served, service might be limited in more rural areas. Traffic can also be a concern during the summer and holiday seasons.
Transport
Type
Upper San Gabriel Valley
Central Coast
Amtrak stations nearby
3
3
Means of transportation to work
Type
Upper San Gabriel Valley
Central Coast
Bicycle
1.1%
1.8%
Bus
3.9%
2.4%
Carpooled
16.6%
9%
Car alone
71.1%
75.9%
Motorcycle
0.1%
0.2%
Railroad
0.1%
0.1%
Taxicab
0.1%
0.1%
Walked
3.2%
4.4%
Average travel time to work
Type
Upper San Gabriel Valley
Central Coast
Average
29.1 min
23.2 min
Real Estate
Real estate prices in the Upper San Gabriel Valley, particularly in upscale neighborhoods like South Pasadena or San Marino, can be exorbitantly high relative to the national average.
Likewise, the Central Coast, especially in areas like Santa Barbara and Pismo Beach, is known for its expensive real estate.
Neighborhoods
The Upper San Gabriel Valley is home to numerous suburban neighborhoods, each offering unique community environments. The residential areas within Pasadena are especially appealing.
The Central Coast provides a mix of suburban and rural neighborhoods, each with its own charm. Particularly, the beach communities are sought after for their scenic beauty.
Houses and residents
Type
Upper San Gabriel Valley
Central Coast
Houses
99,295
96,674
Average household size (people)
3.3
2.4
Houses occupied
96,186 (96.9%)
90,435 (93.5%)
Houses occupied by owners
52,398 (54.5%)
43,559 (48.2%)
Houses occupied by renters
43,788 (45.5%)
46,876 (51.8%)
Median rent asked for vacant for-rent units
$1,771
$2,849
Median price asked for vacant for-sale houses and condos
$1,138,428
$1,099,558
Estimated median house or condo value
$740,686
Over $1,000,000
Median number of rooms in apartments
3.7
3.9
Median number of rooms in houses and condos
5.9
6.1
Renting percentage
44.9%
53.9%
Housing density (houses/condos per square mile)
2,008.8
1,918.7
Household income disparities
44%
38.4%
Housing units without a mortgage
11,525 (24.8%)
8,041 (21.3%)
Housing units with both a second mortgage and home equity loan
137 (0.3%)
100 (0.3%)
Housing units with a mortgage
34,867 (75.2%)
29,764 (78.7%)
Housing units with a home equity loan
3,133 (6.8%)
3,303 (8.7%)
Housing units with a second mortgage
4,036 (8.7%)
3,451 (9.1%)
Housing units lacking complete kitchen facilities
1.5%
0.7%
Housing units lacking complete plumbing facilities
0.9%
0.4%
Housing units in structures
Housing units in structures
Upper San Gabriel Valley
Central Coast
One, detached
61.5%
38.4%
One, attached
9.3%
16.3%
Two
2.0%
5.0%
3 or 4
4.2%
8.7%
5 to 9
5.7%
5.9%
10 to 19
5.5%
5.3%
20 to 49
5.5%
4.7%
50 or more
3.6%
13.4%
Mobile homes
2.6%
2.0%
Boats, RVs, vans, etc.
0.1%
0.2%
Median real estate property taxes paid for housing units
Self-employed workers in own not incorporated business
10,209
13,281
State government workers
3,180
6,404
Unpaid family workers
401
456
Industries and Occupations
Healthcare, retail, and educational services dominate the job market in the Upper San Gabriel Valley, but manufacturing and professional, scientific, and technical services also supply significant employment.
The Central Coast, with its diverse economy, offers several employment opportunities in the hospitality industry, education, healthcare, and wine production.
The Upper San Gabriel Valley is served by many quality hospitals, including the world-renowned City of Hope.
The Central Coast also offers excellent healthcare services, with major hospitals like Cottage Hospital in Santa Barbara and French Hospital in San Luis Obispo.
Health (county statistics)
Type
Upper San Gabriel Valley
Central Coast
General health status score of residents in this county from 1 (poor) to 5 (excellent)
The infrastructure within the Upper San Gabriel Valley is extensive, benefitting from proximity to Los Angeles and facilitating easy access to facilities and services.
The Central Coast boasts strong infrastructure too, consistent with its role as a major tourist destination, but it lacks the metropolitan conveniences of the San Gabriel Valley.
Infrastructure
Type
Upper San Gabriel Valley
Central Coast
TV stations
27
2
Culture and Food
The Upper San Gabriel Valley is a cultural melting pot, particularly known for its Asian populations and associated cuisine. Pasadena offers a buzzing arts scene, theaters, and museums.
The Central Coast is a food lover's paradise, with a culinary scene centered on farm-to-table dining, local wines, and freshly caught seafood. It also nurtures a vibrant arts scene.
Sports Teams
While the Upper San Gabriel Valley doesn't host any major league professional sports teams itself, its proximity to LA gives residents easy access to teams in all major sports.
The Central Coast doesn't have any major sports teams either, but it does offer a variety of outdoor sports activities thanks to its diverse landscapes.
 Upper San Gabriel Valley, CA
 Central Coast, CA