Southwest San Gabriel Valley, CA vs South Gate, CA
Southwest San Gabriel Valley and South Gate are two distinct regions in California, each with their unique attributes and differences. For potential residents and tourists alike, there are several key factors to consider such as crime and safety, climate, cost of living, education, economy, infrastructure, industries, real estate, neighborhoods, transportation, taxes, culture, sports, geography, and healthcare. This comparison will provide a comprehensive analysis of each area based on these variables.
Crime rates tend to be higher in South Gate than in Southwest San Gabriel Valley, making the latter comparatively safer. Southwest San Gabriel Valley residents often report feeling a higher sense of security. That said, South Gate has been working towards improving its safety by implementing community policing and neighborhood watches.
Cost of Living
Generally, the cost of living in Southwest San Gabriel Valley is higher than in South Gate. This difference is mainly due to higher housing costs in Southwest San Gabriel Valley. Essentials such as groceries, utilities, and healthcare are somewhat comparable in both locations.
Income Tax
No difference exists between the two areas regarding state income tax, as they fall under California State jurisdiction which has progressive tax rates based on income.
Property Tax
Property tax in California is generally consistent. However, due to the higher house prices in Southwest San Gabriel Valley, residents there could end up paying more property taxes.
Sales Tax
Both Southwest San Gabriel Valley and South Gate have the same state sales tax rate. However, some individual cities in the Southwest San Gabriel Valley may have additional local sales taxes.
Income
Type
Southwest San Gabriel Valley
South Gate
Estimated median household income
$73,720
$65,351
Estimated per capita income
$29,945
$22,035
Cost of living index (U.S. average is 100)
161.2
139.7
If you make $50,000 in South Gate, you will have to make $57,695 in Southwest San Gabriel Valley to maintain the same standard of living.
Geographical Conditions
Southwest San Gabriel Valley extends from suburban neighborhoods to scenic foothills, offering a taste of both urban and outdoors living. South Gate is relatively flat and urban, situated in the Los Angeles metropolitan area.
Geographical information
Type
Southwest San Gabriel Valley
South Gate
Land area
35.3 sq. miles
7.4 sq. miles
Population density
9,252.7 people per sq. mile
12,376 people per sq. mile
Relative area comparison
Southwest San Gabriel Valley, CA South Gate, CA
Education
In terms of education, Southwest San Gabriel Valley homes several top-rated schools and is in close proximity to renowned universities like the University of Southern California. South Gate's education system is improving but lags slightly behind Southwest San Gabriel Valley.
Southwest San Gabriel Valley has a robust economy sustained by sectors like tech, healthcare, and retail. In comparison, South Gate's economy hinges on manufacturing and retail. The unemployment rate is generally lower in Southwest San Gabriel Valley compared to South Gate.
Biggest Employers
In Southwest San Gabriel Valley, some of the biggest employers include healthcare centers and educational institutions. For South Gate, the largest hiring sectors are manufacturing companies and retail businesses.
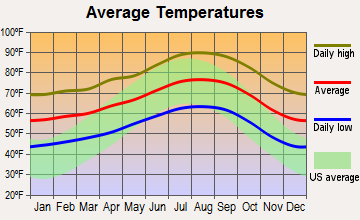
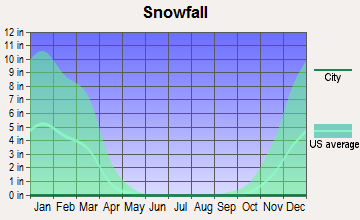
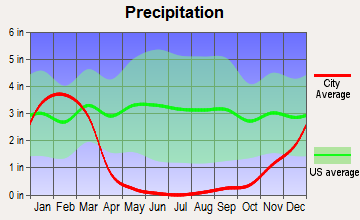
Weather
Both areas enjoy that classic sunny California weather. However, Southwest San Gabriel Valley tends to have hotter summers because it's further inland, away from the moderating influence of the ocean. South Gate, on the other hand, enjoys a more Mediterranean climate with mild, wet winters and warm, dry summers.
Weather and climate
Type
Southwest San Gabriel Valley
South Gate
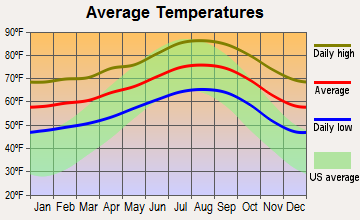
Temperature - Average
66.3°F
66.4°F
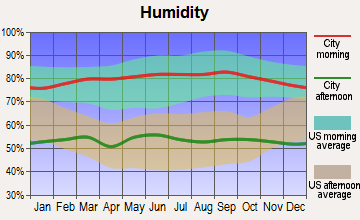
Humidity - Average morning or afternoon humidity
61.4%
63.2%
Humidity - Differences between morning and afternoon humidity
16.5%
18.2%
Humidity - Maximum monthly morning or afternoon humidity
65.8%
68.5%
Humidity - Minimum monthly morning or afternoon humidity
49.3%
50.2%
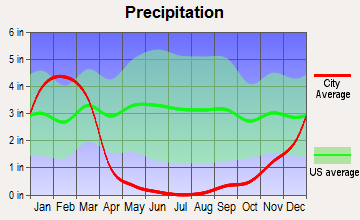
Precipitation - Yearly average
17.6 in
15 in
Snowfall - Yearly average
0 in
0 in
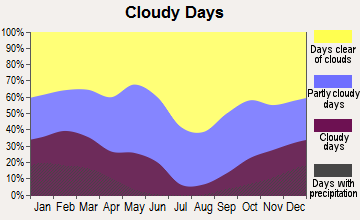
Clouds - Number of days clear of clouds
30.1%
28.9%
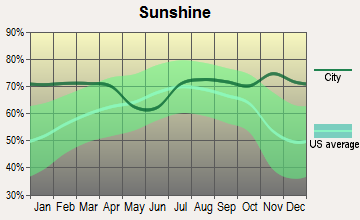
Sunshine amount - Average
78.4%
78.4%
Sunshine amount - Differences during a year
22%
22%
Sunshine amount - Maximum monthly
85%
85%
Sunshine amount - Minimum monthly
63%
63%
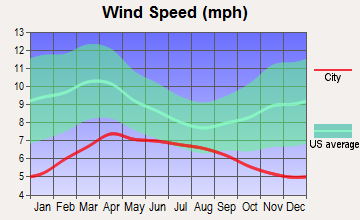
Wind speed - Average
2.3 mph
3 mph
Average climate in Southwest San Gabriel Valley, California
Average climate in South Gate, California
Air pollution
Type
AQI
CO
NO2
OZONE
PB
PM10
PM25
SO2
Year
Southwest San Gabriel Valley
South Gate
Southwest San Gabriel Valley
South Gate
Southwest San Gabriel Valley
South Gate
Southwest San Gabriel Valley
South Gate
Southwest San Gabriel Valley
South Gate
Southwest San Gabriel Valley
South Gate
Southwest San Gabriel Valley
South Gate
Southwest San Gabriel Valley
South Gate
2018
140
140
0.39
0.45
14.2
15.0
26.6
24.9
0.008
0.008
27.5
27.2
15.1
14.5
0.4
0.5
2017
142
142
0.38
0.49
15.1
15.8
27.8
25.9
0.007
0.007
30.2
28.8
15.3
15.0
0.5
0.6
2016
128
128
0.36
0.55
15.2
15.3
26.5
25.2
0.007
0.007
27.8
26.2
14.3
13.5
0.4
0.5
2015
137
133
0.36
0.51
15.3
16.5
26.7
26.6
0.006
0.006
27.6
26.4
16.4
15.6
0.3
0.4
2014
138
138
0.39
0.46
16.3
15.5
26.8
25.8
0.007
0.007
29.9
28.4
18.0
17.0
0.4
0.6
2013
140
140
0.44
0.51
17.5
17.3
25.2
25.5
0.007
0.006
28.3
29.8
17.0
15.8
0.4
0.5
2012
144
144
0.47
0.49
17.7
17.3
25.0
24.7
0.007
0.006
27.6
29.2
18.1
16.3
0.5
0.5
2011
142
142
0.50
0.46
19.3
18.5
23.6
23.4
0.008
0.007
29.8
29.4
17.6
16.5
0.4
0.6
2010
128
128
0.52
0.62
19.4
18.1
22.9
20.4
0.020
0.016
30.0
27.7
16.3
14.7
0.5
0.5
2009
150
150
0.43
0.55
21.5
21.0
23.5
23.0
0.011
0.012
40.0
36.5
18.0
16.2
0.5
0.8
2008
152
152
0.53
0.52
23.5
29.3
22.8
17.2
0.014
0.015
39.1
34.4
18.3
18.4
0.6
0.8
2007
128
126
0.58
0.51
24.2
28.0
21.8
20.1
0.017
0.016
N/A
N/A
N/A
N/A
1.1
1.4
2006
125
124
0.63
0.57
24.6
29.8
22.1
24.9
0.009
0.011
N/A
N/A
N/A
N/A
1.7
1.7
2005
123
121
0.66
0.60
25.6
30.2
20.5
20.7
0.015
0.016
N/A
N/A
N/A
N/A
2.1
2.6
2004
132
132
0.77
0.64
27.7
29.7
22.9
21.9
0.019
0.019
N/A
N/A
N/A
N/A
2.4
2.4
2003
143
143
0.98
0.84
31.8
31.0
22.0
16.8
0.027
0.022
N/A
N/A
N/A
N/A
1.8
1.4
2002
137
137
1.00
0.91
33.0
34.9
21.1
15.8
0.025
0.024
N/A
N/A
N/A
N/A
2.4
2.3
2001
143
143
1.11
0.98
34.2
36.0
18.9
14.1
0.039
0.052
N/A
N/A
N/A
N/A
2.4
2.6
2000
147
149
1.12
0.94
33.4
37.9
18.9
12.3
0.033
0.036
N/A
N/A
N/A
N/A
1.4
1.7
Natural disasters
Type
Southwest San Gabriel Valley
South Gate
Tornado activity compared to U.S. average
18%
18.1%
Earthquake activity compared to U.S. average
7,182.3%
7,018%
Natural disasters compared to U.S. average
57%
57%
Transportation
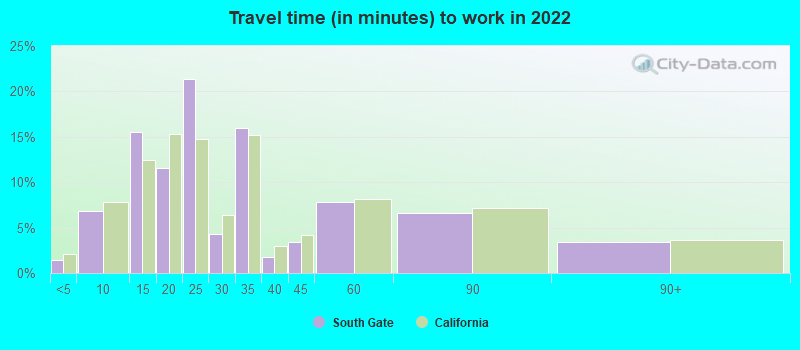
Both regions have good public transportation with regular bus services and access to L.A. Metro Rail. Commutes might be slightly longer from Southwest San Gabriel Valley due to greater distances from central L.A.
Transport
Type
Southwest San Gabriel Valley
South Gate
Amtrak stations nearby
3
3
FAA registered aircraft
0
3
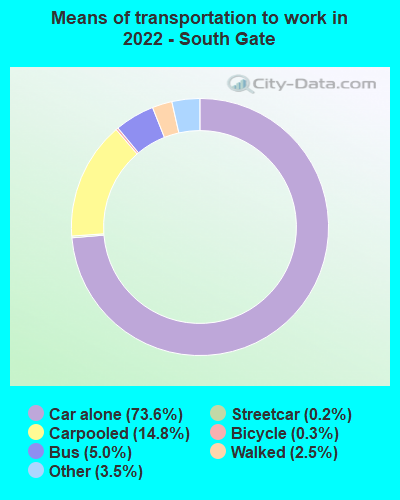
Means of transportation to work
Type
Southwest San Gabriel Valley
South Gate
Bicycle
0.5%
0.4%
Bus
4.7%
4.6%
Carpooled
16.1%
14%
Car alone
73%
74.7%
Railroad
0%
0.1%
Streetcar
0%
0.2%
Subway
0%
0.2%
Walked
2.5%
3%
Average travel time to work
Type
Southwest San Gabriel Valley
South Gate
Average
29.1 min
27.4 min
Real Estate
Real estate in Southwest San Gabriel Valley is more expensive, reflecting the area's desirability. South Gate property prices are lower, making it a more affordable option for home buyers.
Neighborhoods
Southwest San Gabriel Valley neighborhoods are typically quiet, affluent, and family-friendly. South Gate has diverse neighborhoods that range from quiet suburban areas to bustling urban zones.
Houses and residents
Type
Southwest San Gabriel Valley
South Gate
Houses
102,656
25,375
Average household size (people)
3.1
4.1
Houses occupied
99,543 (97%)
24,891 (98.1%)
Houses occupied by owners
47,333 (47.6%)
12,191 (49%)
Houses occupied by renters
52,210 (52.5%)
12,700 (51%)
Median rent asked for vacant for-rent units
$1,828
$1,102
Median price asked for vacant for-sale houses and condos
$1,138,428
$491,338
Estimated median house or condo value
$723,161
$559,900
Median number of rooms in apartments
3.7
3.5
Median number of rooms in houses and condos
5.9
5.4
Renting percentage
51.7%
54.2%
Housing density (houses/condos per square mile)
2,909.6
3,445.1
Household income disparities
44%
40.2%
Housing units without a mortgage
13,166 (31.1%)
240 (3%)
Housing units with both a second mortgage and home equity loan
88 (0.2%)
309 (3.9%)
Housing units with a mortgage
29,118 (68.9%)
7,668 (97%)
Housing units with a home equity loan
2,557 (6%)
93 (1.2%)
Housing units with a second mortgage
2,975 (7%)
564 (7.1%)
Housing units lacking complete kitchen facilities
1.5%
2.2%
Housing units lacking complete plumbing facilities
Self-employed workers in own not incorporated business
8,660
2,821
State government workers
4,158
1,068
Unpaid family workers
639
62
Industries and Occupations
Southwest San Gabriel Valley has a diversified economy with occupations spread across sectors like healthcare, education, and tech. South Gate's mainstay is the manufacturing sector, but there's a growing presence of service industry jobs.
Health Care
Both locations have access to high-quality healthcare services. Southwest San Gabriel Valley, given its proximity to large cities like Pasadena, may have a slightly more diverse range of services.
Infrastructure
Southwest San Gabriel Valley boasts a better infrastructure with wider streets, a reliable power supply, and quality sewage systems. While South Gate also has good infrastructure, some areas need improvement, like expanding public facilities.
Infrastructure
Type
Southwest San Gabriel Valley
South Gate
TV stations
26
17
Culture and Food
Both locations offer diverse cultural experiences and cuisines. However, Southwest San Gabriel Valley boasts a larger Asian influence, whereas South Gate enjoys a stronger Latino impact.
Sports Teams
No major league sports teams reside in either area. However, both are within reach of L.A.'s sports scene, housing teams like the Lakers, Dodgers, and Rams.
 Southwest San Gabriel Valley, CA
 South Gate, CA