As two cities in the lush Pacific Northwest, Seattle, WA, and Vancouver, WA, each have unique offerings for both potential residents and tourists. Although they share a common state, each has its own distinct lifestyle, economic make-up, and cultural experiences. The following comparison considers crime and safety, weather, cost of living, and other significant factors that may affect your decision to visit or relocate.
Distance between
Seattle, WA and
Vancouver, WA : 138.3 miles
Seattle's population is larger by 282%. Its population has grown by 170,545 people (30.3%) since 2000. The population of Vancouver has grown by 48,609 people (33.9%) during that time.
When it comes to crime and safety, both Seattle and Vancouver have their challenges. According to the FBI's crime data, Seattle has a higher crime rate than Vancouver. Property crimes, such as burglary, theft, and motor vehicle theft, are particularly prevalent in Seattle. Though Vancouver also handles crime, the rate is considerably lower compared to Seattle.
City-data.com crime index counts serious crimes and violent crime more heavily. It adjusts for the number of visitors and daily workers commuting into cities. (higher means more crime, U.S. average = 301.1)
City-data.com crime index counts serious crimes and violent crime more heavily. It adjusts for the number of visitors and daily workers commuting into cities. (higher means more crime, U.S. average = 301.1)
Sex Offenders
According to our data, there are 595 registered sex offenders living in Seattle and 363 registered sex offenders living in . The ratio of residents to sex offenders in Seattle is 1,184 to 1; the ratio in Vancouver is 482 to 1. The number of registered sex offenders compared to the number of residents is a smaller in Seattle than in Vancouver.
Cost of Living
The cost of living is significantly higher in Seattle than in Vancouver. This is primarily due to Seattle's booming tech industry driving up housing costs. In Vancouver, housing, groceries, healthcare, and transportation are all notably cheaper.
Income Tax
Washington State, including both Seattle and Vancouver, does not impose a state income tax. This is a significant advantage for residents in both cities.
Property Tax
Property taxes are higher in Seattle compared to Vancouver, due to the higher property values in the city. This higher property tax contributes to Seattle's higher overall cost of living.
Sales Tax
Seattle has a higher sales tax rate than Vancouver. Seattle's sales tax rate is 10.1%, while Vancouver's sales tax rate is 8.4%. This difference can make a noticeable impact on everyday purchases.
Income
Type
Seattle
Vancouver
Estimated median household income
$110,781
$69,993
Estimated per capita income
$74,733
$39,959
Cost of living index (U.S. average is 100)
118.5
104
If you make $50,000 in Vancouver, you will have to make $56,971 in Seattle to maintain the same standard of living.
Geographical Conditions
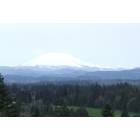
Seattle is geographically situated between the Puget Sound and Lake Washington, with an abundance of hills, making it more scenic. Vancouver is relatively flat, located north of the Columbia River, with beautiful views of Mount St. Helens and the Cascade Range.
Both Seattle and Vancouver offer excellent education systems. Seattle, however, offers more variety with several high-ranking schools and highly-rated universities like the University of Washington. Vancouver has good schools but less diversity in educational choices compared to Seattle.
Seattle's economy is robust, powered by a thriving tech industry with big names like Microsoft and Amazon. On the other hand, Vancouver has a more diverse economy with sectors such as technology, healthcare, and manufacturing playing significant roles. Unemployment rates are lower in Seattle due to its stronger economy.
Biggest Employers
Seattle is home to global giants like Amazon, Microsoft, and Starbucks. These companies provide thousands of jobs to the city's residents. On the other hand, Vancouver's largest employers include PeaceHealth Southwest Medical Center, the Evergreen Public Schools, and The Vancouver Clinic.
There were 264 building permits issued in Seattle in 2012 (52 less than in 2011) compared to 572 building permits issued in Vancouver in 2012 (476 more than in 2011).
In Seattle (King County), 69.0% voted for Democrats and 28.5% for Republicans in 2012 Presidential Election. In Vancouver (Clark County), 48.7% voted for Democrats and 48.5% for Republicans.
Elections
Type
Democrats
Republicans
Other
Year
Seattle
Vancouver
Seattle
Vancouver
Seattle
Vancouver
2020
75.1%
51.0%
22.3%
45.9%
2.6%
3.1%
2016
70.0%
44.6%
21.1%
44.4%
8.9%
11.0%
2012
69.0%
48.7%
28.5%
48.5%
2.5%
2.9%
2008
70.2%
51.9%
28.1%
45.8%
1.7%
2.3%
2004
65.1%
46.8%
33.8%
52.1%
1.1%
1.1%
2000
60.3%
45.7%
34.5%
49.7%
5.2%
4.6%
1996
56.4%
46.4%
31.4%
41.5%
12.2%
12.1%
Breakdown of population affiliated with a religious congregation
Type
Adherents
Congregations
Religion
Seattle
Vancouver
Seattle
Vancouver
CATHOLIC CHURCH
14.4%
6.3%
4.9%
3.0%
EVANGELICAL LUTHERAN CHURCH IN AMERICA
1.3%
1.1%
4.7%
3.3%
EPISCOPAL CHURCH
0.8%
0.3%
2.4%
1.7%
AMERICAN BAPTIST CHURCHES IN THE USA
0.6%
0.0%
2.9%
0.7%
MUSLIM ESTIMATE
0.6%
0.1%
1.4%
0.3%
SEVENTH DAY ADVENTIST CHURCH
0.6%
0.9%
2.3%
3.0%
LUTHERAN CHURCH
0.5%
0.6%
2.0%
2.3%
SOUTHERN BAPTIST CONVENTION
0.3%
0.8%
3.8%
7.3%
Weather
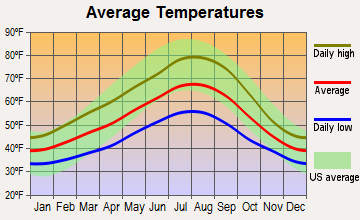
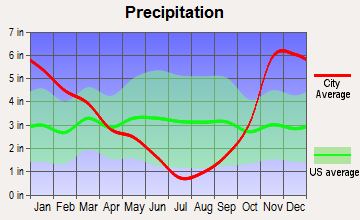
Seattle and Vancouver both experience similar weather, characterized by mild, wet winters and warm, dry summers. Seattle gets slightly more rain annually, and because it's closer to the coast, it can be cooler. Residents of both cities would benefit from a fondness for rainy, overcast weather.
Weather and climate
Type
Seattle
Vancouver
Temperature - Average
52.5°F
52.9°F
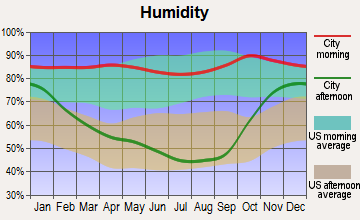
Humidity - Average morning or afternoon humidity
78.5%
76.5%
Humidity - Differences between morning and afternoon humidity
38%
42%
Humidity - Maximum monthly morning or afternoon humidity
86%
86%
Humidity - Minimum monthly morning or afternoon humidity
48%
44%
Precipitation - Yearly average
36.6 in
39.5 in
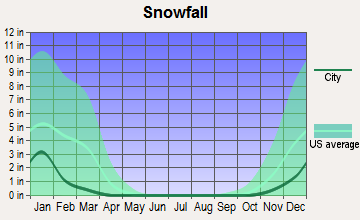
Snowfall - Yearly average
21.4 in
12.8 in
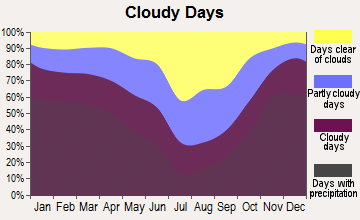
Clouds - Number of days clear of clouds
11.6%
11.3%
Sunshine amount - Average
49.4%
54.7%
Sunshine amount - Differences during a year
44%
52%
Sunshine amount - Maximum monthly
64%
72%
Sunshine amount - Minimum monthly
20%
20%
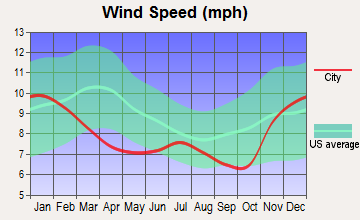
Wind speed - Average
8.6 mph
8.1 mph
Average climate in Seattle, Washington
Average climate in Vancouver, Washington
Air pollution
Type
AQI
CO
NO2
OZONE
PB
PM10
PM25
SO2
Year
Seattle
Vancouver
Seattle
Vancouver
Seattle
Vancouver
Seattle
Vancouver
Seattle
Vancouver
Seattle
Seattle
Vancouver
Seattle
Vancouver
2018
82
78
0.21
0.26
10.6
8.8
20.7
22.2
N/A
N/A
N/A
N/A
8.3
7.4
0.7
0.4
2017
92
89
0.23
0.26
11.1
8.7
21.0
23.3
N/A
N/A
N/A
N/A
8.8
8.8
0.3
0.4
2016
67
67
0.22
0.25
11.9
8.7
20.3
21.0
N/A
N/A
N/A
N/A
6.6
6.1
0.6
0.2
2015
81
90
0.23
0.28
10.8
9.2
19.3
21.7
N/A
N/A
N/A
N/A
8.5
9.6
0.8
0.5
2014
75
82
0.24
0.24
11.5
8.5
19.5
21.6
N/A
N/A
N/A
N/A
7.4
8.0
N/A
0.8
2013
81
83
0.24
0.29
N/A
9.6
17.4
18.3
N/A
N/A
N/A
N/A
9.1
11.4
0.8
1.1
2012
77
75
0.23
0.30
N/A
9.1
19.5
21.3
N/A
N/A
N/A
N/A
7.7
7.1
1.0
0.6
2011
72
88
0.24
0.34
N/A
9.4
18.6
19.3
N/A
N/A
N/A
N/A
7.5
9.0
1.1
0.8
2010
71
70
0.24
0.33
N/A
9.1
18.0
19.3
N/A
N/A
N/A
N/A
6.7
5.9
1.1
1.4
2009
94
90
0.27
0.32
N/A
10.2
17.7
20.5
N/A
N/A
N/A
N/A
8.0
9.7
1.4
1.6
2008
80
97
0.30
0.34
N/A
10.9
17.8
20.4
N/A
N/A
N/A
N/A
6.5
7.7
1.3
1.0
2007
83
96
0.30
0.35
N/A
11.4
18.2
20.2
N/A
N/A
20.3
N/A
7.9
8.5
1.5
1.3
2006
98
95
N/A
N/A
N/A
N/A
18.3
N/A
N/A
N/A
22.6
N/A
8.7
8.6
N/A
1.5
2005
101
94
0.80
N/A
18.3
N/A
N/A
N/A
N/A
N/A
24.5
N/A
9.5
10.1
3.5
1.7
2004
102
85
0.81
N/A
17.9
N/A
N/A
N/A
N/A
N/A
N/A
N/A
10.3
10.0
3.0
N/A
2003
91
73
0.78
N/A
18.5
N/A
N/A
N/A
N/A
0.008
N/A
N/A
9.9
8.6
2.4
N/A
2002
87
68
0.82
N/A
19.3
N/A
N/A
N/A
N/A
0.010
N/A
N/A
11.7
8.4
2.7
N/A
2001
88
68
0.90
N/A
20.7
N/A
N/A
N/A
0.005
0.004
N/A
N/A
12.3
8.9
3.7
N/A
2000
98
52
1.06
N/A
20.9
N/A
N/A
N/A
N/A
N/A
N/A
N/A
13.3
N/A
3.2
N/A
Natural disasters
Type
Seattle
Vancouver
Tornado activity compared to U.S. average
5.5%
8.3%
Earthquake activity compared to U.S. average
1,394.2%
1,588.4%
Natural disasters compared to U.S. average
30%
13%
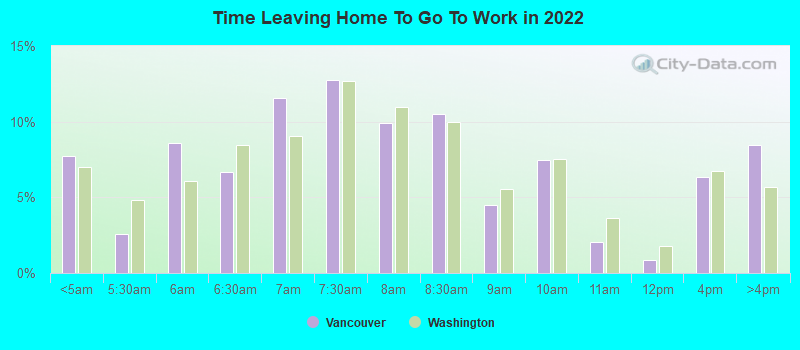
Transportation
Seattle's public transit, consisting of buses, light rail, and ferries, is extensive and well-organized, while Vancouver's public transit is less extensive but efficient. Commute times are generally longer in Seattle due to its larger size and population.
Transport
Type
Seattle
Vancouver
Amtrak stations
1
1
Amtrak stations nearby
2
3
FAA registered aircraft
1
248
FAA registered aircraft manufacturers and dealers
2
0
Means of transportation to work
Type
Seattle
Vancouver
Bicycle
2.1%
0.4%
Bus
8.9%
0.9%
Carpooled
8.7%
8.7%
Car alone
67.8%
85.7%
Ferryboat
0.7%
0%
Motorcycle
0.3%
0.1%
Railroad
1.2%
0%
Streetcar
0.3%
0.1%
Subway
0.6%
0.1%
Taxicab
0.1%
0%
Walked
8%
1.6%
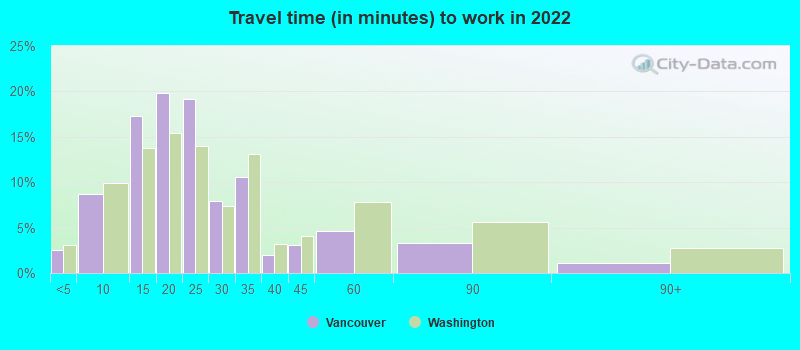
Average travel time to work
Type
Seattle
Vancouver
Average
35 min
22.7 min
Other means
23.5 min
22.5 min
Public transportation
35.6 min
48.8 min
Private vehicle occupancy
Type
Seattle
Vancouver
Average
1.2
1.1
Drove alone
89%
89.8%
In 2 person carpool
8.7%
7.1%
In 3 person carpool
0.8%
1.4%
In 4 person carpool
0.2%
1.3%
In 5-6 person carpool
1.1%
0.1%
In 7+ person carpool
0.2%
0%
How many people usually rode to work in the car, truck or van.
Real Estate
Real estate is notably more expensive in Seattle than in Vancouver due to its strong economy and the city's attraction to tech employees, resulting in higher demand. Vancouver's real estate market is less pricey, making it more accessible for families and first-time home buyers.
Neighborhoods
Seattle's neighborhoods are diverse, ranging from the densely populated Downtown to quieter residential neighborhoods like Ballard and Green Lake. Vancouver's neighborhoods, on the contrary, are more suburban with relaxed atmospheres.
Houses and residents
Type
Seattle
Vancouver
Houses
384,799
86,065
Average household size (people)
2.1
2.4
Median year apartment built
1987
1993
Median year house/condo built
1955
1982
Length of stay in the house since moving in
12.4 years
12.9 years
Houses occupied
351,650 (91.4%)
81,814 (95.1%)
Houses occupied by owners
161,587 (46%)
41,484 (50.7%)
Houses occupied by renters
190,063 (54%)
40,330 (49.3%)
Median rent asked for vacant for-rent units
$2,780
$1,581
Median monthly housing costs
$1,984
$1,408
Median price asked for vacant for-sale houses and condos
$860,506
$666,701
Estimated median house or condo value
$848,100
$399,100
Median numbers of rooms
4.1
5.1
Median number of rooms in apartments
3
4
Median number of rooms in houses and condos
6.3
6.2
Median house price - detached houses
Over $1,000,000
$457,784
Median house price - in 2-unit structures
$764,579
Over $1,000,000
Median house price - in 3-to-4-unit structures
$719,049
Over $1,000,000
Median house price - in 5 or more unit structures
$626,370
$393,544
Median house price - mobile homes
$226,727
$109,677
Median house price - Townhouses or other attached units
$925,507
$310,311
Median house price - All housing units
Over $1,000,000
$447,005
Median house age
47
33
Renting percentage
51.9%
49.1%
Housing density (houses/condos per square mile)
4,587.9
2,011.2
House value disparities
20.6%
23.6%
Household income disparities
42.2%
43.1%
Median household income for houses/condes with a mortgage
$189,767
$103,167
Median household income for apartments without a mortgage
$112,771
$70,630
Housing units without a mortgage
2,459 (2.1%)
646 (2.4%)
Housing units with both a second mortgage and home equity loan
12,354 (10.5%)
2,199 (8.2%)
Housing units with a mortgage
115,481 (97.9%)
26,315 (97.6%)
Housing units with a home equity loan
240 (0.2%)
0 (0%)
Housing units with a second mortgage
13,881 (11.8%)
2,472 (9.2%)
House/condo owner moved in on average (years ago)
8
10
House/condo renter moved in on average (years ago)
1
1
Housing units lacking complete kitchen facilities
2.2%
2.5%
Housing units lacking complete plumbing facilities
0.4%
1.1%
Housing units in structures
Housing units in structures
Seattle
Vancouver
One, detached
39.6%
52.5%
One, attached
6.0%
7.6%
Two
2.0%
5.1%
3 or 4
3.2%
4.8%
5 to 9
5.7%
8.5%
10 to 19
7.0%
3.3%
20 to 49
11.9%
3.3%
50 or more
24.4%
11.5%
Mobile homes
0.1%
3.2%
Boats, RVs, vans, etc.
0.0%
0.2%
Median real estate property taxes paid for housing units
Self-employed workers in own not incorporated business
24,994
5,380
State government workers
27,235
3,415
Unpaid family workers
947
94
Industries and Occupations
Seattle's leading industries include technology, aerospace, and healthcare. The city is an employment hub for software developers, IT managers, and healthcare professionals. Compared to Seattle, Vancouver has a more diversified economy with an emphasis on manufacturing, healthcare, retail, and construction.
Seattle has a higher number of hospitals and a wider range of specialized medical services than Vancouver, including the highly-acclaimed UW Medical Center. Vancouver offers reliable healthcare services but on a smaller scale.
Health (county statistics)
Type
Seattle
Vancouver
General health status score of residents in this county from 1 (poor) to 5 (excellent)
Seattle's infrastructure is more developed, with a large international airport, well-maintained highways, and an effective mass transit system. On the other hand, Vancouver's infrastructure is smaller and less intricate, reflecting its smaller population and less urban character.
Infrastructure
Type
Seattle
Vancouver
Hospitals
22
5
TV stations
17
16
Bank branches located here
236
83
Bank institutions located here
37
16
Main business address for public companies
54
3
Drinking water stations with no reported violations in the past
3
4
Drinking water stations with reported violations in the past
HMDA - Conventional home purchase loans - Applications denied
Year
Seattle
Vancouver
1999
1,357
411
2000
1,148
225
2001
890
168
2002
840
175
2003
1,421
483
2004
1,810
713
2005
2,341
1,024
2006
2,789
934
2007
2,273
699
2008
1,113
233
2009
748
112
Culture and Food
Seattle is known for its vibrant culture and food scene, with an array of international cuisines, museums, art galleries, and music festivals. Vancouver, conversely, offers a quieter cultural scene, with local events and a farm-to-table food culture.
Sports Teams
Seattle is home to professional sports teams like the Seattle Seahawks (NFL), Seattle Sounders (MLS), and the Seattle Mariners (MLB). Vancouver has amateur and semi-pro sports teams, but nothing on the scale of Seattle's professional sports franchises.


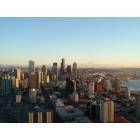

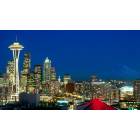
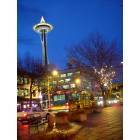


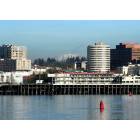
 Seattle, WA
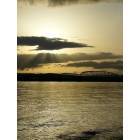
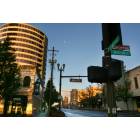
 Vancouver, WA