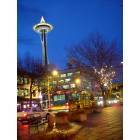
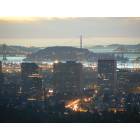
Seattle, WA, and Oakland, CA, are two prominent cities on the West Coast of the United States with distinctive characteristics. The Emerald City, Seattle, renowned for its thriving tech scene, and Oakland, a crucial cultural hub recognized for its diversity, offer unique living experiences. Understandably, deciding between the two cities should be based on individual preferences regarding crime rates, weather, cost of living, education, working opportunities, taxes, culture, and more.
Distance between
Seattle, WA and
Oakland, CA : 679.3 miles
Seattle's population is larger by 69%. Its population has grown by 170,545 people (30.3%) since 2000. The population of Oakland has grown by 34,339 people (8.6%) during that time.
In terms of safety, both cities have higher crime rates compared to the national average, but Oakland, CA, tends to have a higher crime rate. Seattle, WA, seems to be slightly safer, making it more appealing to those who prioritize security. However, specific neighborhoods in both cities have notably lower crime rates, so choosing the right neighborhood could significantly influence your personal experience.
City-data.com crime index counts serious crimes and violent crime more heavily. It adjusts for the number of visitors and daily workers commuting into cities. (higher means more crime, U.S. average = 301.1)
City-data.com crime index counts serious crimes and violent crime more heavily. It adjusts for the number of visitors and daily workers commuting into cities. (higher means more crime, U.S. average = 301.1)
Sex Offenders
According to our data, there are 595 registered sex offenders living in Seattle and 967 registered sex offenders living in . The ratio of residents to sex offenders in Seattle is 1,184 to 1; the ratio in Oakland is 434 to 1. The number of registered sex offenders compared to the number of residents is a lot smaller in Seattle than in Oakland.
Cost of Living
Both cities are costly compared to the national average. Seattle has a higher cost of living, especially concerning housing prices. Oakland is less expensive in comparison, but the general cost of living there still surpasses most other U.S. cities.
Income Tax
Seattle has one of the most attractive tax structures, with no state income tax. On the contrary, California has one of the highest state income tax rates in the country, negatively impacting Oakland residents.
Property Tax
Property tax rates in Seattle and Oakland are relatively high compared to the national average, reflecting their high real estate values.
Sales Tax
Washington has a high sales tax, currently set at 6.5%, and Seattle adds a local tax for a total of 9.6%. On the other hand, California has a 7.25% state sales tax, to which Oakland adds a local tax for a total of 9.25%.
Income
Type
Seattle
Oakland
Estimated median household income
$110,781
$82,236
Estimated per capita income
$74,733
$49,966
Cost of living index (U.S. average is 100)
118.5
126.7
If you make $50,000 in Seattle, you will have to make $53,460 in Oakland to maintain the same standard of living.
Geographical Conditions
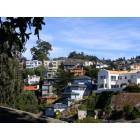
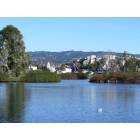
Seattle offers beautiful hills, bodies of water, and views of mountains, including Mt. Rainier. Oakland has warmer weather, coastline access, and is near to several natural attractions, including Redwood and Tilden Regional Parks.
Both Seattle and Oakland have diverse options for education. Seattle’s public schools are renowned for their quality, and the city is home to well-regarded universities like the University of Washington. Oakland's education system is diverse with a mix of public, charter, and private schools, along with notable universities like Mills College and nearby University of California, Berkeley.
Seattle boasts a robust economy, heavily driven by the tech industry. It is home to giant tech companies like Amazon and Microsoft, which offer ample job opportunities. Oakland, on the other hand, offers a wide variety of industries including healthcare and tech, with major employers like Kaiser Permanente and Clorox Company.
Biggest Employers
Seattle is well-known for being home to Amazon and Microsoft, two of the largest employers in the city. In Oakland, healthcare provider Kaiser Permanente and the Clorox Company are the most prominent employers.
There were 264 building permits issued in Seattle in 2012 (52 less than in 2011) compared to 114 building permits issued in Oakland in 2012 (73 more than in 2011).
In Seattle (King County), 69.0% voted for Democrats and 28.5% for Republicans in 2012 Presidential Election. In Oakland (Alameda County), 78.9% voted for Democrats and 18.2% for Republicans.
Elections
Type
Democrats
Republicans
Other
Year
Seattle
Oakland
Seattle
Oakland
Seattle
Oakland
2020
75.1%
79.8%
22.3%
17.6%
2.6%
2.6%
2016
70.0%
78.2%
21.1%
14.6%
8.9%
7.2%
2012
69.0%
78.9%
28.5%
18.2%
2.5%
3.0%
2008
70.2%
78.8%
28.1%
19.3%
1.7%
2.0%
2004
65.1%
75.5%
33.8%
23.4%
1.1%
1.1%
2000
60.3%
69.6%
34.5%
24.2%
5.2%
6.2%
1996
56.4%
65.8%
31.4%
23.1%
12.2%
11.2%
Breakdown of population affiliated with a religious congregation
Type
Adherents
Congregations
Religion
Seattle
Oakland
Seattle
Oakland
CATHOLIC CHURCH
14.4%
15.3%
4.9%
4.9%
EVANGELICAL LUTHERAN CHURCH IN AMERICA
1.3%
0.3%
4.7%
2.3%
EPISCOPAL CHURCH
0.8%
0.3%
2.4%
1.7%
AMERICAN BAPTIST CHURCHES IN THE USA
0.6%
0.5%
2.9%
2.5%
MUSLIM ESTIMATE
0.6%
2.0%
1.4%
2.5%
SEVENTH DAY ADVENTIST CHURCH
0.6%
0.3%
2.3%
1.4%
LUTHERAN CHURCH
0.5%
0.3%
2.0%
1.6%
SOUTHERN BAPTIST CONVENTION
0.3%
1.5%
3.8%
10.9%
Weather
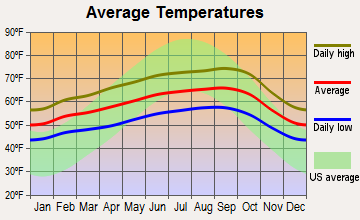
Weatherwise, Seattle is famous for its grey, rainy winters, but it has beautiful mild summers. Controlling for winter gloom, Seattle is relatively comfortable with lower temperatures than the national average. Conversely, Oakland enjoys more sunshine throughout the year with warm summers and mild winters, making it an attractive choice for sun-lovers.
Weather and climate
Type
Seattle
Oakland
Temperature - Average
52.5°F
59.1°F
Humidity - Average morning or afternoon humidity
78.5%
84.2%
Humidity - Differences between morning and afternoon humidity
38%
29%
Humidity - Maximum monthly morning or afternoon humidity
86%
90.9%
Humidity - Minimum monthly morning or afternoon humidity
48%
61.9%
Precipitation - Yearly average
36.6 in
23.5 in
Snowfall - Yearly average
21.4 in
0 in
Clouds - Number of days clear of clouds
11.6%
26.9%
Sunshine amount - Average
49.4%
73%
Sunshine amount - Differences during a year
44%
22%
Sunshine amount - Maximum monthly
64%
77%
Sunshine amount - Minimum monthly
20%
55%
Wind speed - Average
8.6 mph
11.4 mph
Average climate in Seattle, Washington
Average climate in Oakland, California
Air pollution
Type
AQI
CO
NO2
OZONE
PB
PM10
PM25
SO2
Year
Seattle
Oakland
Seattle
Oakland
Seattle
Oakland
Seattle
Oakland
Seattle
Oakland
Seattle
Seattle
Oakland
Seattle
Oakland
2018
82
105
0.21
0.46
10.6
13.0
20.7
20.9
N/A
0.012
N/A
N/A
8.3
13.7
0.7
0.4
2017
92
100
0.23
0.48
11.1
13.5
21.0
21.2
N/A
0.008
N/A
N/A
8.8
11.3
0.3
0.5
2016
67
80
0.22
0.41
11.9
12.9
20.3
20.3
N/A
0.005
N/A
N/A
6.6
7.9
0.6
0.9
2015
81
93
0.23
0.43
10.8
14.5
19.3
20.6
N/A
0.004
N/A
N/A
8.5
9.5
0.8
0.8
2014
75
90
0.24
0.42
11.5
14.7
19.5
20.6
N/A
0.005
N/A
N/A
7.4
9.1
N/A
0.5
2013
81
89
0.24
0.39
N/A
15.2
17.4
18.0
N/A
0.004
N/A
N/A
9.1
11.6
0.8
0.5
2012
77
87
0.23
0.38
N/A
13.7
19.5
18.7
N/A
0.003
N/A
N/A
7.7
8.5
1.0
0.7
2011
72
94
0.24
0.32
N/A
14.4
18.6
18.5
N/A
0.003
N/A
N/A
7.5
10.1
1.1
1.1
2010
71
90
0.24
0.21
N/A
14.4
18.0
19.4
N/A
0.013
N/A
N/A
6.7
8.4
1.1
1.0
2009
94
99
0.27
0.22
N/A
15.2
17.7
19.0
N/A
0.006
N/A
N/A
8.0
11.3
1.4
1.3
2008
80
110
0.30
0.29
N/A
15.1
17.8
20.1
N/A
0.006
N/A
N/A
6.5
12.4
1.3
1.0
2007
83
100
0.30
0.41
N/A
13.4
18.2
21.3
N/A
0.006
20.3
N/A
7.9
9.5
1.5
1.1
2006
98
106
N/A
0.47
N/A
13.8
18.3
22.6
N/A
N/A
22.6
N/A
8.7
9.4
N/A
1.3
2005
101
97
0.80
0.56
18.3
13.3
N/A
15.3
N/A
N/A
24.5
N/A
9.5
9.6
3.5
1.4
2004
102
107
0.81
0.51
17.9
14.3
N/A
15.3
N/A
0.004
N/A
N/A
10.3
11.3
3.0
1.8
2003
91
82
0.78
0.63
18.5
16.1
N/A
15.8
N/A
N/A
N/A
N/A
9.9
N/A
2.4
1.7
2002
87
81
0.82
0.69
19.3
18.8
N/A
16.7
N/A
0.008
N/A
N/A
11.7
N/A
2.7
1.6
2001
88
87
0.90
0.70
20.7
17.2
N/A
12.7
0.005
0.008
N/A
N/A
12.3
N/A
3.7
1.5
2000
98
78
1.06
0.84
20.9
17.1
N/A
11.8
N/A
0.012
N/A
N/A
13.3
N/A
3.2
1.8
Natural disasters
Type
Seattle
Oakland
Tornado activity compared to U.S. average
5.5%
8.8%
Earthquake activity compared to U.S. average
1,394.2%
7,647.7%
Natural disasters compared to U.S. average
30%
20%
Transportation
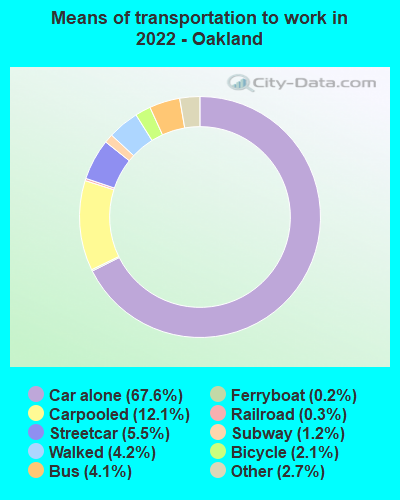
Seattle has a robust public transportation system, including buses, light rail, ferries, and a streetcar system. Oakland also offers a mix of public transit options like BART (Bay Area Rapid Transit), buses, and ferries.
Transport
Type
Seattle
Oakland
Amtrak stations
1
1
Amtrak stations nearby
2
3
FAA registered aircraft
1
154
FAA registered aircraft manufacturers and dealers
2
2
Means of transportation to work
Type
Seattle
Oakland
Bicycle
2.1%
1%
Bus
8.9%
3.2%
Carpooled
8.7%
12.6%
Car alone
67.8%
72.2%
Ferryboat
0.7%
0.1%
Motorcycle
0.3%
0.4%
Railroad
1.2%
0.1%
Streetcar
0.3%
2.3%
Subway
0.6%
0.5%
Taxicab
0.1%
0.1%
Walked
8%
5.5%
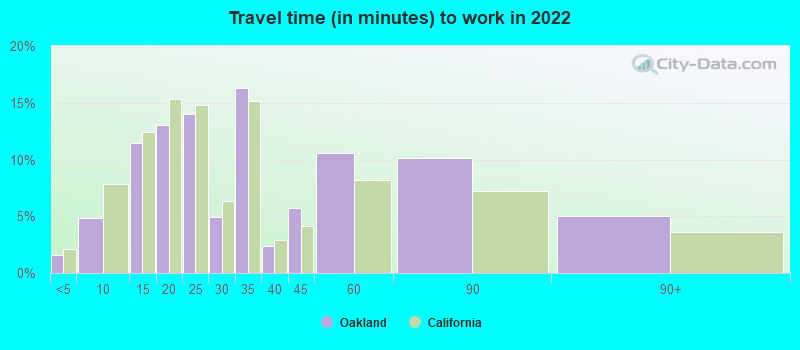
Average travel time to work
Type
Seattle
Oakland
Average
35 min
33.6 min
Other means
23.5 min
29 min
Public transportation
35.6 min
45.3 min
Private vehicle occupancy
Type
Seattle
Oakland
Average
1.2
1.2
Drove alone
89%
88.1%
In 2 person carpool
8.7%
9.2%
In 3 person carpool
0.8%
2%
In 4 person carpool
0.2%
0.6%
In 5-6 person carpool
1.1%
0%
In 7+ person carpool
0.2%
0%
How many people usually rode to work in the car, truck or van.
Real Estate
Seattle's real estate market is more expensive, driven by high demand and limited supply. Oakland's real estate market is somewhat cheaper but still expensive by national standards.
Neighborhoods
Neighborhood-wise, Seattle offers a range from bustling urban areas like Downtown to quieter residential areas like Fremont. Oakland offers neighborhoods rich in culture and diversity, like Chinatown and Rockridge.
Houses and residents
Type
Seattle
Oakland
Houses
384,799
186,660
Average household size (people)
2.1
2.5
Median year apartment built
1987
1958
Median year house/condo built
1955
1943
Length of stay in the house since moving in
12.4 years
15.4 years
Houses occupied
351,650 (91.4%)
170,366 (91.3%)
Houses occupied by owners
161,587 (46%)
72,661 (42.7%)
Houses occupied by renters
190,063 (54%)
97,705 (57.4%)
Median rent asked for vacant for-rent units
$2,780
$3,127
Median monthly housing costs
$1,984
$1,921
Median price asked for vacant for-sale houses and condos
$860,506
$923,387
Estimated median house or condo value
$848,100
$848,600
Median numbers of rooms
4.1
4.3
Median number of rooms in apartments
3
3.6
Median number of rooms in houses and condos
6.3
5.7
Median house price - detached houses
Over $1,000,000
Over $1,000,000
Median house price - in 2-unit structures
$764,579
$781,885
Median house price - in 3-to-4-unit structures
$719,049
$716,428
Median house price - in 5 or more unit structures
$626,370
$709,698
Median house price - mobile homes
$226,727
$365,144
Median house price - occupied boats, rvs, vans etc.
Over $1,000,000
$485,645
Median house price - Townhouses or other attached units
$925,507
$834,685
Median house price - All housing units
Over $1,000,000
$991,120
Median house age
47
69
Renting percentage
51.9%
58.9%
Housing density (houses/condos per square mile)
4,587.9
3,329.9
House value disparities
20.6%
22.3%
Household income disparities
42.2%
45.9%
Median household income for houses/condes with a mortgage
$189,767
$153,718
Median household income for apartments without a mortgage
$112,771
$81,904
Housing units without a mortgage
2,459 (2.1%)
1,176 (2.2%)
Housing units with both a second mortgage and home equity loan
12,354 (10.5%)
4,996 (9.4%)
Housing units with a mortgage
115,481 (97.9%)
51,720 (97.8%)
Housing units with a home equity loan
240 (0.2%)
139 (0.3%)
Housing units with a second mortgage
13,881 (11.8%)
6,096 (11.5%)
House/condo owner moved in on average (years ago)
8
13
House/condo renter moved in on average (years ago)
1
4
Housing units lacking complete kitchen facilities
2.2%
2.4%
Housing units lacking complete plumbing facilities
0.4%
1.6%
Housing units in structures
Housing units in structures
Seattle
Oakland
One, detached
39.6%
42.3%
One, attached
6.0%
4.9%
Two
2.0%
6.2%
3 or 4
3.2%
11.1%
5 to 9
5.7%
6.6%
10 to 19
7.0%
6.9%
20 to 49
11.9%
9.9%
50 or more
24.4%
11.7%
Mobile homes
0.1%
0.3%
Boats, RVs, vans, etc.
0.0%
0.1%
Median real estate property taxes paid for housing units
Self-employed workers in own not incorporated business
24,994
20,615
State government workers
27,235
9,112
Unpaid family workers
947
529
Industries and Occupations
In Seattle, the tech sector reigns, offering high-paying jobs. However, other sectors like healthcare and education are also significant. In Oakland, healthcare, education, and social services sectors predominantly provide jobs, alongside an emerging tech sector.
Both Seattle and Oakland provide excellent healthcare services. Seattle is renowned for its healthcare facilities, including the University of Washington Medicine. Oakland residents benefit from top-ranked facilities like Kaiser Permanente Medical Center.
Health (county statistics)
Type
Seattle
Oakland
General health status score of residents in this county from 1 (poor) to 5 (excellent)
Seattle enjoys robust infrastructure, with many modern amenities and structures, including skyscrapers and the famous Space Needle. Oakland also boasts impressive infrastructure, including historic theatres and modern sports facilities.
Infrastructure
Type
Seattle
Oakland
Hospitals
22
9
TV stations
17
28
Arenas or stadiums
5
2
Bank branches located here
236
76
Bank institutions located here
37
29
Main business address for public companies
54
10
Drinking water stations with no reported violations in the past
3
10
Drinking water stations with reported violations in the past
HMDA - Conventional home purchase loans - Applications denied
Year
Seattle
Oakland
1999
1,357
1,291
2000
1,148
1,721
2001
890
1,244
2002
840
1,370
2003
1,421
2,021
2004
1,810
3,261
2005
2,341
3,850
2006
2,789
4,422
2007
2,273
2,645
2008
1,113
1,041
2009
748
700
Culture and Food
Both cities are rich in culture and food. Seattle has a thriving music scene and is famous for its coffee culture and seafood. Oakland, known for its racial and ethnic diversity, offers a wide variety of cuisine from around the world.
Sports Teams
Seattle is home to popular teams such as the NFL's Seahawks and MLB's Mariners. Recently, it also welcomed the NHL's Kraken. Oakland used to host the NFL's Raiders and the NBA's Golden State Warriors, but now its most notable team is MLB's Athletics.


 Seattle, WA
 Oakland, CA