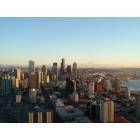
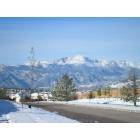
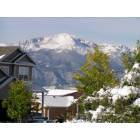
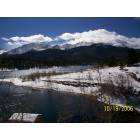
Seattle, Washington and Colorado Springs, Colorado are both vibrant cities that offer greatly different experiences to residents and visitors alike. Seattle is known for its bustling tech industry and coffee culture, centered in a cityscape full of high rises and surrounded by waterfronts and mountains. In contrast, Colorado Springs offers a more relaxed lifestyle, with a military presence and great access to outdoor activities due to being located at the foothills of the Rocky Mountains. This post compares these two cities across multiple dimensions.
Distance between
Seattle, WA and
Colorado Springs, CO : 1,066.5 miles
Seattle's population is larger by 52%. Its population has grown by 170,545 people (30.3%) since 2000. The population of Colorado Springs has grown by 123,066 people (34.1%) during that time.
Crime rates vary between Seattle and Colorado Springs. While both have their share of crime, it is generally considered that Seattle has a higher rate of crime compared to Colorado Springs. Though both cities share typical urban crime issues, the majority of incidents are generally non-violent property crimes in both areas. It's advised for residents and tourists to maintain awareness in all public spaces.
City-data.com crime index counts serious crimes and violent crime more heavily. It adjusts for the number of visitors and daily workers commuting into cities. (higher means more crime, U.S. average = 301.1)
City-data.com crime index counts serious crimes and violent crime more heavily. It adjusts for the number of visitors and daily workers commuting into cities. (higher means more crime, U.S. average = 301.1)
Sex Offenders
According to our data, there are 595 registered sex offenders living in Seattle and 1,683 registered sex offenders living in . The ratio of residents to sex offenders in Seattle is 1,184 to 1; the ratio in Colorado Springs is 276 to 1. The number of registered sex offenders compared to the number of residents is a lot smaller in Seattle than in Colorado Springs.
Cost of Living
The cost of living in Seattle is drastically higher than in Colorado Springs. Seattle has one of the highest costs of living among U.S. cities, largely driven by the city's housing costs. This means that for those looking to relocate, Colorado Springs is substantially more affordable, particularly in terms of housing.
Income Tax
Washington state, including Seattle, does not have a state income tax. On the other hand, Colorado Springs residents are subject to the state income tax imposed by Colorado.
Property Tax
Homeowners in Seattle pay higher property taxes than those in Colorado Springs due to Washington state's relatively high rates and the city's high real estate values.
Sales Tax
Seattle has a higher combined city and state sales tax rate than Colorado Springs. While the choice between cities may not hinge on sales tax, it's worth noting that Seattle's rate is among one of the highest in the country.
Income
Type
Seattle
Colorado Springs
Estimated median household income
$110,781
$74,579
Estimated per capita income
$74,733
$39,808
Cost of living index (U.S. average is 100)
118.5
99.6
If you make $50,000 in Colorado Springs, you will have to make $59,488 in Seattle to maintain the same standard of living.
Geographical Conditions
Seattle is located between the Puget Sound and Lake Washington, surrounded by mountains, forests, and bodies of water, which welcomes an array of outdoor activities. Colorado Springs is situated at the base of the Rocky Mountains and Pikes Peak, offering a variety of hiking, biking and other outdoor activities.
Both cities boast strong education systems. Seattle's school district is larger and more diverse, while Colorado Springs offers a range of school districts varying in size. In terms of higher education, Seattle houses the University of Washington, a top-ranked public university. Meanwhile, Colorado Springs is home to the United States Air Force Academy and several small colleges.
Seattle's economy is marked by thriving tech, healthcare, and retail industries. Companies like Amazon and Microsoft offer extensive job opportunities. Colorado Springs has a strong military presence supporting its economy, alongside high-tech industries and tourism. The cost of doing business in Colorado Springs is generally lower than in Seattle, which could be appealing to entrepreneurs and businesses.
Biggest Employers
In Seattle, the biggest employers are Amazon and the University of Washington. Conversely, Colorado Springs' largest employers are the military installations and defense contractors like Lockheed Martin. Both cities offer diverse job opportunities across sectors.
In Seattle (King County), 69.0% voted for Democrats and 28.5% for Republicans in 2012 Presidential Election. In Colorado Springs (El Paso County), 38.7% voted for Democrats and 59.2% for Republicans.
Elections
Type
Democrats
Republicans
Other
Year
Seattle
Colorado Springs
Seattle
Colorado Springs
Seattle
Colorado Springs
2020
75.1%
43.0%
22.3%
53.9%
2.6%
3.1%
2016
70.0%
34.1%
21.1%
56.6%
8.9%
9.4%
2012
69.0%
38.7%
28.5%
59.2%
2.5%
2.0%
2008
70.2%
40.0%
28.1%
58.9%
1.7%
1.1%
2004
65.1%
32.2%
33.8%
66.9%
1.1%
0.9%
2000
60.3%
30.9%
34.5%
64.1%
5.2%
5.0%
1996
56.4%
32.2%
31.4%
59.0%
12.2%
8.8%
Breakdown of population affiliated with a religious congregation
Type
Adherents
Congregations
Religion
Seattle
Colorado Springs
Seattle
Colorado Springs
CATHOLIC CHURCH
14.4%
8.4%
4.9%
5.4%
EVANGELICAL LUTHERAN CHURCH IN AMERICA
1.3%
1.0%
4.7%
2.3%
EPISCOPAL CHURCH
0.8%
0.4%
2.4%
1.6%
AMERICAN BAPTIST CHURCHES IN THE USA
0.6%
0.3%
2.9%
1.2%
MUSLIM ESTIMATE
0.6%
0.0%
1.4%
0.2%
SEVENTH DAY ADVENTIST CHURCH
0.6%
0.2%
2.3%
1.2%
LUTHERAN CHURCH
0.5%
0.7%
2.0%
1.9%
SOUTHERN BAPTIST CONVENTION
0.3%
2.6%
3.8%
11.3%
PRESBYTERIAN CHURCH IN AMERICA
0.1%
0.4%
0.9%
1.2%
Weather
Seattle is known for its cloudy and rainy weather with cool summers and mild winters, while Colorado Springs enjoys over 300 days of sunshine a year with warm summers and cold, snowy winters. For those who prefer abundant sunshine and don't mind some snow, Colorado Springs will be more appealing. Seattle's climate will be preferable for those who enjoy cooler, wetter weather.
Weather and climate
Type
Seattle
Colorado Springs
Temperature - Average
52.5°F
43.4°F
Humidity - Average morning or afternoon humidity
78.5%
53.3%
Humidity - Differences between morning and afternoon humidity
38%
30%
Humidity - Maximum monthly morning or afternoon humidity
86%
64%
Humidity - Minimum monthly morning or afternoon humidity
48%
34%
Precipitation - Yearly average
36.6 in
18.6 in
Snowfall - Yearly average
21.4 in
77 in
Clouds - Number of days clear of clouds
11.6%
21.2%
Sunshine amount - Average
49.4%
82.2%
Sunshine amount - Differences during a year
44%
10.5%
Sunshine amount - Maximum monthly
64%
79.7%
Sunshine amount - Minimum monthly
20%
69.2%
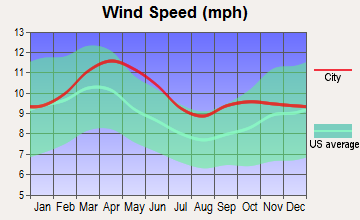
Wind speed - Average
8.6 mph
10.3 mph
Average climate in Seattle, Washington
Average climate in Colorado Springs, Colorado
Air pollution
Type
AQI
CO
NO2
OZONE
PB
PM10
PM25
SO2
Year
Seattle
Colorado Springs
Seattle
Colorado Springs
Seattle
Colorado Springs
Seattle
Seattle
Colorado Springs
Seattle
Colorado Springs
Seattle
Colorado Springs
Seattle
Colorado Springs
2018
82
60
0.21
N/A
10.6
N/A
20.7
N/A
N/A
N/A
N/A
N/A
8.3
6.3
0.7
N/A
2017
92
58
0.23
N/A
11.1
N/A
21.0
N/A
N/A
N/A
N/A
N/A
8.8
6.1
0.3
N/A
2016
67
48
0.22
N/A
11.9
N/A
20.3
N/A
N/A
N/A
N/A
N/A
6.6
6.9
0.6
N/A
2015
81
N/A
0.23
N/A
10.8
N/A
19.3
N/A
N/A
N/A
N/A
N/A
8.5
N/A
0.8
N/A
2014
75
N/A
0.24
N/A
11.5
N/A
19.5
N/A
N/A
N/A
N/A
N/A
7.4
N/A
N/A
N/A
2013
81
N/A
0.24
N/A
N/A
N/A
17.4
N/A
N/A
N/A
N/A
N/A
9.1
N/A
0.8
N/A
2012
77
N/A
0.23
N/A
N/A
N/A
19.5
N/A
N/A
N/A
N/A
N/A
7.7
N/A
1.0
N/A
2011
72
N/A
0.24
N/A
N/A
N/A
18.6
N/A
N/A
N/A
N/A
N/A
7.5
N/A
1.1
N/A
2010
71
N/A
0.24
N/A
N/A
N/A
18.0
N/A
N/A
N/A
N/A
N/A
6.7
N/A
1.1
N/A
2009
94
N/A
0.27
N/A
N/A
N/A
17.7
N/A
N/A
N/A
N/A
N/A
8.0
N/A
1.4
N/A
2008
80
N/A
0.30
N/A
N/A
N/A
17.8
N/A
N/A
N/A
N/A
N/A
6.5
N/A
1.3
N/A
2007
83
N/A
0.30
N/A
N/A
N/A
18.2
N/A
N/A
N/A
20.3
N/A
7.9
N/A
1.5
N/A
2006
98
15
N/A
0.50
N/A
N/A
18.3
N/A
N/A
0.005
22.6
N/A
8.7
N/A
N/A
N/A
2005
101
17
0.80
0.55
18.3
N/A
N/A
N/A
N/A
0.027
24.5
N/A
9.5
N/A
3.5
N/A
2004
102
17
0.81
0.56
17.9
N/A
N/A
N/A
N/A
0.010
N/A
N/A
10.3
N/A
3.0
N/A
2003
91
19
0.78
0.59
18.5
N/A
N/A
N/A
N/A
0.011
N/A
N/A
9.9
N/A
2.4
N/A
2002
87
24
0.82
0.66
19.3
N/A
N/A
N/A
N/A
0.010
N/A
N/A
11.7
N/A
2.7
N/A
2001
88
51
0.90
0.63
20.7
16.7
N/A
N/A
0.005
0.005
N/A
21.3
12.3
N/A
3.7
1.9
2000
98
78
1.06
0.58
20.9
22.5
N/A
N/A
N/A
0.010
N/A
21.0
13.3
N/A
3.2
2.3
Natural disasters
Type
Seattle
Colorado Springs
Tornado activity compared to U.S. average
5.5%
78.4%
Earthquake activity compared to U.S. average
1,394.2%
816.1%
Natural disasters compared to U.S. average
30%
17%
Transportation
Seattle offers a range of public transportation, including buses, ferries, and a light rail system. Meanwhile, Colorado Springs relies more on personal and commuter vehicle usage with limited options for public transportation but less congestion overall.
Transport
Type
Seattle
Colorado Springs
Amtrak stations
1
1
Amtrak stations nearby
2
1
FAA registered aircraft
1
552
FAA registered aircraft manufacturers and dealers
2
44
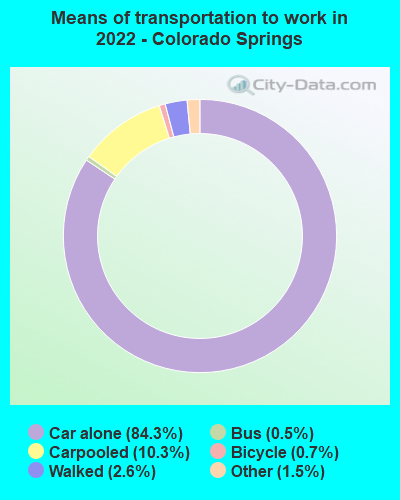
Means of transportation to work
Type
Seattle
Colorado Springs
Bicycle
2.1%
0.3%
Bus
8.9%
0.4%
Carpooled
8.7%
9.2%
Car alone
67.8%
87%
Ferryboat
0.7%
0%
Motorcycle
0.3%
0.1%
Railroad
1.2%
0%
Streetcar
0.3%
0%
Subway
0.6%
0%
Taxicab
0.1%
0.1%
Walked
8%
2.1%
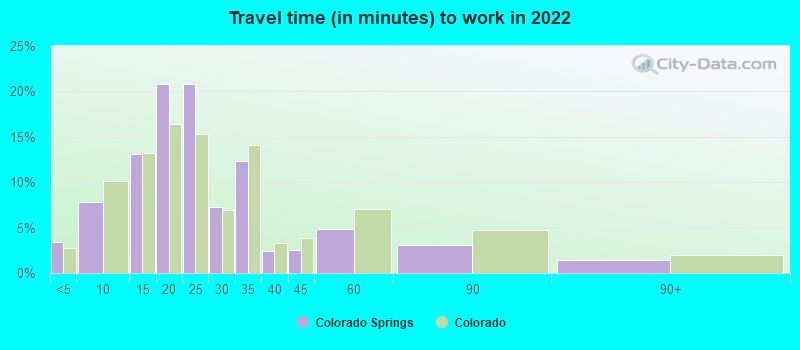
Average travel time to work
Type
Seattle
Colorado Springs
Average
35 min
23.8 min
Other means
23.5 min
21.3 min
Public transportation
35.6 min
39 min
Private vehicle occupancy
Type
Seattle
Colorado Springs
Average
1.2
1.1
Drove alone
89%
90%
In 2 person carpool
8.7%
7.5%
In 3 person carpool
0.8%
1.9%
In 4 person carpool
0.2%
0.2%
In 5-6 person carpool
1.1%
0.4%
In 7+ person carpool
0.2%
0.1%
How many people usually rode to work in the car, truck or van.
Real Estate
Seattle's real estate market is hotter than Colorado Springs', with higher home prices and faster selling times. However, in Colorado Springs, the property prices are more reasonable, giving home buyers and renters more options.
Neighborhoods
Seattle offers an array of urban neighborhoods each with its unique culture and vibe, making it a vibrant place to live. Colorado Springs offers a mix of suburban and urban neighborhoods with good access to outdoor activities, making it suitable for those who enjoy a quieter, outdoor-focused lifestyle.
Houses and residents
Type
Seattle
Colorado Springs
Houses
384,799
205,380
Average household size (people)
2.1
2.4
Median year apartment built
1987
1984
Median year house/condo built
1955
1987
Length of stay in the house since moving in
12.4 years
10.6 years
Houses occupied
351,650 (91.4%)
197,542 (96.2%)
Houses occupied by owners
161,587 (46%)
123,398 (62.5%)
Houses occupied by renters
190,063 (54%)
74,144 (37.5%)
Median rent asked for vacant for-rent units
$2,780
$1,458
Median monthly housing costs
$1,984
$1,422
Median price asked for vacant for-sale houses and condos
$860,506
$595,239
Estimated median house or condo value
$848,100
$390,500
Median numbers of rooms
4.1
6
Median number of rooms in apartments
3
4.1
Median number of rooms in houses and condos
6.3
7.2
Median house price - detached houses
Over $1,000,000
$427,641
Median house price - in 2-unit structures
$764,579
$389,381
Median house price - in 3-to-4-unit structures
$719,049
$295,560
Median house price - in 5 or more unit structures
$626,370
$258,564
Median house price - mobile homes
$226,727
$30,081
Median house price - Townhouses or other attached units
$925,507
$308,944
Median house price - All housing units
Over $1,000,000
$403,675
Median house age
47
35
Renting percentage
51.9%
39.9%
Housing density (houses/condos per square mile)
4,587.9
1,105.7
House value disparities
20.6%
25.2%
Household income disparities
42.2%
41%
Median household income for houses/condes with a mortgage
$189,767
$99,037
Median household income for apartments without a mortgage
$112,771
$72,581
Housing units without a mortgage
2,459 (2.1%)
1,835 (2.1%)
Housing units with both a second mortgage and home equity loan
12,354 (10.5%)
6,564 (7.3%)
Housing units with a mortgage
115,481 (97.9%)
87,580 (97.9%)
Housing units with a home equity loan
240 (0.2%)
86 (0.1%)
Housing units with a second mortgage
13,881 (11.8%)
7,898 (8.8%)
House/condo owner moved in on average (years ago)
8
7
House/condo renter moved in on average (years ago)
1
1
Housing units lacking complete kitchen facilities
2.2%
0.6%
Housing units lacking complete plumbing facilities
0.4%
0.3%
Housing units in structures
Housing units in structures
Seattle
Colorado Springs
One, detached
39.6%
62.3%
One, attached
6.0%
8.3%
Two
2.0%
1.4%
3 or 4
3.2%
4.7%
5 to 9
5.7%
4.9%
10 to 19
7.0%
6.7%
20 to 49
11.9%
6.1%
50 or more
24.4%
4.0%
Mobile homes
0.1%
1.7%
Median real estate property taxes paid for housing units
Self-employed workers in own not incorporated business
24,994
13,110
State government workers
27,235
7,029
Unpaid family workers
947
735
Industries and Occupations
Seattle is dominated by the tech industry with its largest employers being Amazon and Microsoft. Meanwhile, Colorado Springs is home to a significant military presence with multiple bases and defense contractors. Both cities also have emerging healthcare sectors.
Seattle is home to some of the top-ranked hospitals in the nation, while Colorado Springs boasts strong healthcare services but falls short when compared to Seattle's extensive offerings. Any healthcare needs are easily addressed in both cities.
Health (county statistics)
Type
Seattle
Colorado Springs
General health status score of residents in this county from 1 (poor) to 5 (excellent)
Seattle's infrastructure is marked by its public transit systems and bridges connecting different parts of the city. Colorado Springs has less public transit but offers a simplistic layout, making it easier to drive. However, both cities are investing in their infrastructure to accommodate growing populations.
Infrastructure
Type
Seattle
Colorado Springs
Hospitals
22
10
TV stations
17
18
Arenas or stadiums
5
3
Bank branches located here
236
133
Bank institutions located here
37
33
Main business address for public companies
54
6
Drinking water stations with no reported violations in the past
3
6
Drinking water stations with reported violations in the past
HMDA - Conventional home purchase loans - Applications denied
Year
Seattle
Colorado Springs
1999
1,357
1,957
2000
1,148
985
2001
890
756
2002
840
502
2003
1,421
1,131
2004
1,810
1,811
2005
2,341
2,631
2006
2,789
2,188
2007
2,273
1,246
2008
1,113
496
2009
748
233
Culture and Food
Seattle is known for its thriving coffee culture, seafood, and Pike Place Market. Colorado Springs offers a variety of dining options that cater to its health-conscious and outdoor-oriented residents. Both offer strong local arts scenes and plenty of cultural offerings.
Sports Teams
Seattle is home to the Seattle Seahawks (NFL) and Seattle Mariners (MLB), along with newly established NHL team, the Seattle Kraken. Colorado Springs does not have its own major sports teams, but residents and visitors can enjoy minor league games and Colorado’s professional teams are just an hour away in Denver.


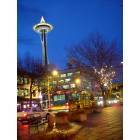


 Seattle, WA
 Colorado Springs, CO