Santa Ana and Southwest San Gabriel Valley are two vibrant locales in California, each with its unique characteristics. While Santa Ana is more populous and urban, Southwest San Gabriel Valley offers a quieter, more suburban environment. The cities vary in terms of crime rates, weather patterns, cost of living, education, work and economy, infrastructure, industries, and occupations. Differences can also be seen in major employers, real estate trends, neighborhoods, transportation modes, taxation, culture, sports, geographical features, and healthcare. This content analyzes these aspects, aiding individuals to make an informed choice in terms of visitation or relocation.
Santa Ana and Southwest San Gabriel Valley both strive for community safety, but perceptibly, crime rates differ. Santa Ana has higher crime rates compared to the latter, particularly in theft and burglary, although steady efforts are underway to fortify law and order. In Southwest San Gabriel Valley, the crime rates are lower providing a safer environment for families and individuals.
Cost of Living
Santa Ana's cost of living index is generally higher than that of Southwest San Gabriel Valley. The price of necessities such as groceries, healthcare, and housing tend to be a bit more expensive in Santa Ana. The latter city remains a little less taxing on the wallet, making it potentially more appealing for people wanting a more affordable Californian lifestyle.
Income Tax
As part of California, both cities have a progressive state income tax system. The rates range from 1% up to a top rate of 13.3% depending on income level. There are no city-specific income taxes in either location.
Property Tax
Property tax rates are identical in both locales, adhering to California's standard rate of 1% of the property's assessed value, plus any local levies or bonds.
Sales Tax
The state of California has a base sales tax rate of 7.25%. Santa Ana applies an additional city tax, taking overall rate to 8.25%, while Southwest San Gabriel Valley complies strictly with the base state rate.
Income
Type
Santa Ana
Southwest San Gabriel Valley
Estimated median household income
$80,265
$73,720
Estimated per capita income
$26,691
$29,945
Cost of living index (U.S. average is 100)
88.6
161.2
If you make $50,000 in Santa Ana, you will have to make $90,971 in Southwest San Gabriel Valley to maintain the same standard of living.
Geographical Conditions
Santa Ana resides inland but close to the coast, characterized by its flat plains and Santa Ana river. Meanwhile, Southwest San Gabriel Valley borders the stunning San Gabriel Mountains to the north, offering more geographical variation and access to hiking and outdoor activities.
Geographical information
Type
Santa Ana
Southwest San Gabriel Valley
Land area
27.1 sq. miles
35.3 sq. miles
Population density
11,401 people per sq. mile
9,252.7 people per sq. mile
Relative area comparison
Santa Ana, CA Southwest San Gabriel Valley, CA
Education
Both Santa Ana and Southwest San Gabriel Valley offer quality educational options. Santa Ana Unified School District is second largest in the county, with a variety of K-12 options, along with Santa Ana College. In contrast, Southwest San Gabriel Valley offers several reputable public and private school options, though it lacks large higher education institutions compared to Santa Ana.
Santa Ana’s economy leans heavily on service industries, retail, and manufacturing while Southwest San Gabriel Valley primarily thrives on healthcare, retail, and professional services. Job growth in both cities is positive and is expected to increase in the future.
Biggest Employers
In Santa Ana, some of the biggest employers include the County of Orange, Ingram Micro, and Tenet Healthcare. Meanwhile, in Southwest San Gabriel Valley, healthcare institutions like Citrus Valley Health Partners, and West Covina Unified School District are among the largest employers.
In Santa Ana (Orange County), 45.8% voted for Democrats and 52.0% for Republicans in 2012 Presidential Election. In Southwest San Gabriel Valley (Los Angeles County), 69.7% voted for Democrats and 27.8% for Republicans.
Elections
Type
Democrats
Republicans
Other
Year
Santa Ana
Southwest San Gabriel Valley
Santa Ana
Southwest San Gabriel Valley
Santa Ana
Southwest San Gabriel Valley
2020
53.6%
71.0%
44.6%
26.9%
1.8%
2.1%
2016
50.9%
72.0%
42.4%
22.5%
6.7%
5.5%
2012
45.8%
69.7%
52.0%
27.8%
2.3%
2.4%
2008
47.8%
69.2%
50.3%
28.8%
1.9%
1.9%
2004
39.3%
63.3%
60.2%
35.7%
0.5%
1.0%
2000
40.4%
63.6%
55.9%
32.4%
3.7%
4.0%
1996
37.9%
59.3%
51.7%
31.0%
10.5%
9.7%
Breakdown of population affiliated with a religious congregation
Type
Adherents
Congregations
Religion
Santa Ana
Southwest San Gabriel Valley
Santa Ana
Southwest San Gabriel Valley
CATHOLIC CHURCH
26.5%
36.1%
4.4%
4.7%
SOUTHERN BAPTIST CONVENTION
2.3%
1.0%
8.8%
9.0%
MUSLIM ESTIMATE
0.8%
0.7%
1.3%
1.0%
LUTHERAN CHURCH
0.6%
0.2%
2.0%
1.6%
EPISCOPAL CHURCH
0.4%
0.4%
1.4%
1.4%
EVANGELICAL LUTHERAN CHURCH IN AMERICA
0.4%
0.2%
2.3%
1.9%
SEVENTH DAY ADVENTIST CHURCH
0.4%
0.5%
1.3%
2.4%
REFORMED CHURCH IN AMERICA
0.3%
0.1%
0.2%
0.2%
AMERICAN BAPTIST CHURCHES IN THE USA
0.2%
0.5%
1.7%
3.1%
Weather
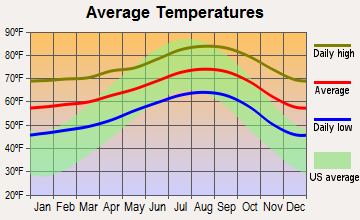
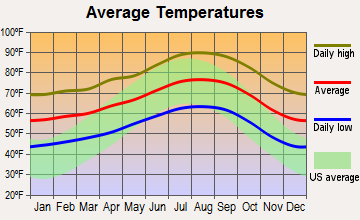
Santa Ana enjoys a warm Mediterranean climate, with summers often reaching into the high 80s and winters averaging in the 60s. Conversely, Southwest San Gabriel Valley experiences the subtropical Mediterranean climate, with just slightly cooler temperatures both in summer and winters compared to Santa Ana.
Weather and climate
Type
Santa Ana
Southwest San Gabriel Valley
Temperature - Average
65.4°F
66.3°F
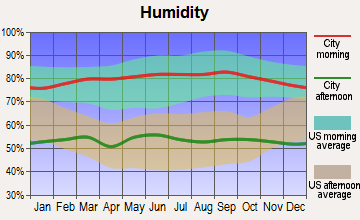
Humidity - Average morning or afternoon humidity
69.9%
61.4%
Humidity - Differences between morning and afternoon humidity
26.2%
16.5%
Humidity - Maximum monthly morning or afternoon humidity
78.3%
65.8%
Humidity - Minimum monthly morning or afternoon humidity
52%
49.3%
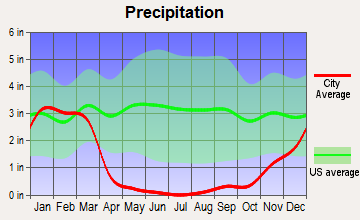
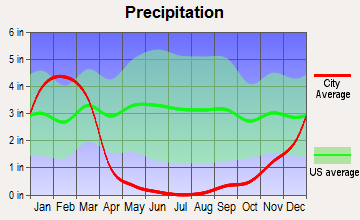
Precipitation - Yearly average
13.8 in
17.6 in
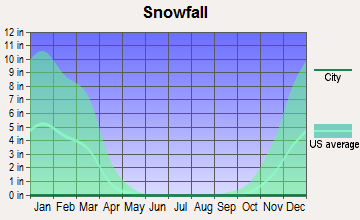
Snowfall - Yearly average
0 in
0 in
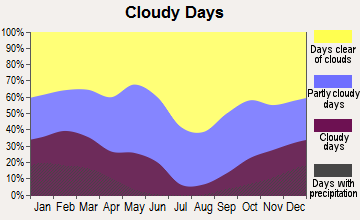
Clouds - Number of days clear of clouds
26.5%
30.1%
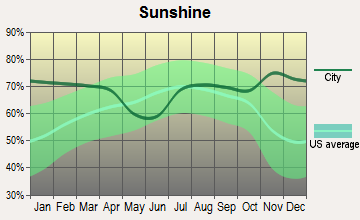
Sunshine amount - Average
78.4%
78.4%
Sunshine amount - Differences during a year
21.9%
22%
Sunshine amount - Maximum monthly
84.8%
85%
Sunshine amount - Minimum monthly
62.9%
63%
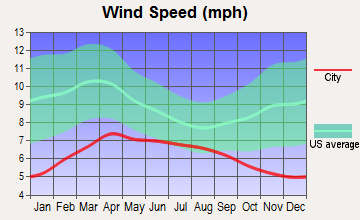
Wind speed - Average
5.9 mph
2.3 mph
Average climate in Santa Ana, California
Average climate in Southwest San Gabriel Valley, California
Air pollution
Type
AQI
CO
NO2
OZONE
PB
PM10
PM25
SO2
Year
Santa Ana
Southwest San Gabriel Valley
Santa Ana
Southwest San Gabriel Valley
Santa Ana
Southwest San Gabriel Valley
Santa Ana
Southwest San Gabriel Valley
Santa Ana
Southwest San Gabriel Valley
Santa Ana
Southwest San Gabriel Valley
Santa Ana
Southwest San Gabriel Valley
Santa Ana
Southwest San Gabriel Valley
2018
124
140
0.34
0.39
14.2
14.2
27.0
26.6
N/A
0.008
27.5
27.5
12.3
15.1
0.7
0.4
2017
129
142
0.35
0.38
13.9
15.1
29.1
27.8
N/A
0.007
26.7
30.2
13.6
15.3
0.5
0.5
2016
107
128
0.35
0.36
12.6
15.2
29.2
26.5
N/A
0.007
24.1
27.8
12.7
14.3
0.2
0.4
2015
128
137
0.32
0.36
13.4
15.3
29.6
26.7
N/A
0.006
25.0
27.6
14.7
16.4
0.2
0.3
2014
127
138
0.29
0.39
13.2
16.3
28.6
26.8
N/A
0.007
26.7
29.9
15.9
18.0
0.4
0.4
2013
123
140
0.34
0.44
13.9
17.5
27.6
25.2
0.003
0.007
28.8
28.3
14.0
17.0
0.3
0.4
2012
115
144
0.31
0.47
12.9
17.7
26.7
25.0
0.004
0.007
27.5
27.6
14.5
18.1
0.1
0.5
2011
118
142
0.31
0.50
14.8
19.3
27.1
23.6
0.006
0.008
27.5
29.8
15.9
17.6
0.7
0.4
2010
107
128
0.34
0.52
14.4
19.4
26.5
22.9
0.011
0.020
23.5
30.0
14.6
16.3
0.6
0.5
2009
133
150
0.35
0.43
16.0
21.5
27.7
23.5
0.010
0.011
24.4
40.0
14.9
18.0
1.1
0.5
2008
138
152
0.38
0.53
17.1
23.5
28.2
22.8
0.010
0.014
30.1
39.1
21.6
18.3
1.1
0.6
2007
121
128
0.36
0.58
17.0
24.2
27.1
21.8
0.012
0.017
N/A
N/A
N/A
N/A
0.8
1.1
2006
120
125
0.40
0.63
17.7
24.6
26.6
22.1
0.007
0.009
N/A
N/A
N/A
N/A
1.3
1.7
2005
119
123
0.40
0.66
18.2
25.6
28.3
20.5
0.013
0.015
N/A
N/A
N/A
N/A
1.3
2.1
2004
128
132
0.50
0.77
19.4
27.7
31.2
22.9
0.014
0.019
N/A
N/A
N/A
N/A
1.6
2.4
2003
139
143
0.64
0.98
22.3
31.8
28.3
22.0
0.029
0.027
N/A
N/A
N/A
N/A
1.1
1.8
2002
122
137
0.66
1.00
22.3
33.0
25.1
21.1
0.019
0.025
N/A
N/A
N/A
N/A
1.7
2.4
2001
120
143
0.76
1.11
22.6
34.2
25.1
18.9
0.036
0.039
N/A
N/A
N/A
N/A
1.5
2.4
2000
127
147
0.80
1.12
25.7
33.4
23.7
18.9
0.028
0.033
N/A
N/A
N/A
N/A
1.9
1.4
Natural disasters
Type
Santa Ana
Southwest San Gabriel Valley
Tornado activity compared to U.S. average
19.1%
18%
Earthquake activity compared to U.S. average
6,931.4%
7,182.3%
Natural disasters compared to U.S. average
32%
57%
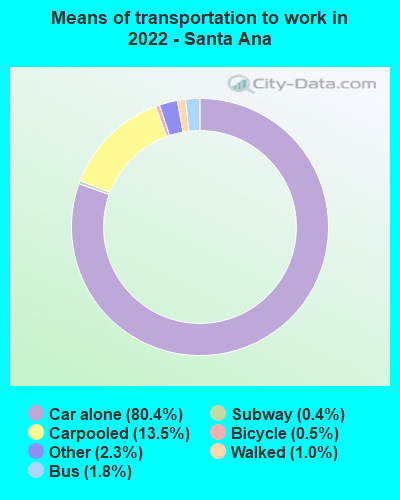
Transportation
Santa Ana's well-planned infrastructure ensures easy access to public transit, including buses and trains. Alternatively, Southwest San Gabriel Valley, while still providing public transit options, may require more dependency on personal vehicles due to its larger spread and less dense population.
Transport
Type
Santa Ana
Southwest San Gabriel Valley
Amtrak stations
1
0
Amtrak stations nearby
3
3
FAA registered aircraft
150
0
FAA registered aircraft manufacturers and dealers
15
0
Means of transportation to work
Type
Santa Ana
Southwest San Gabriel Valley
Bicycle
0.2%
0.5%
Bus
0.9%
4.7%
Carpooled
12%
16.1%
Car alone
83.6%
73%
Walked
1.4%
2.5%
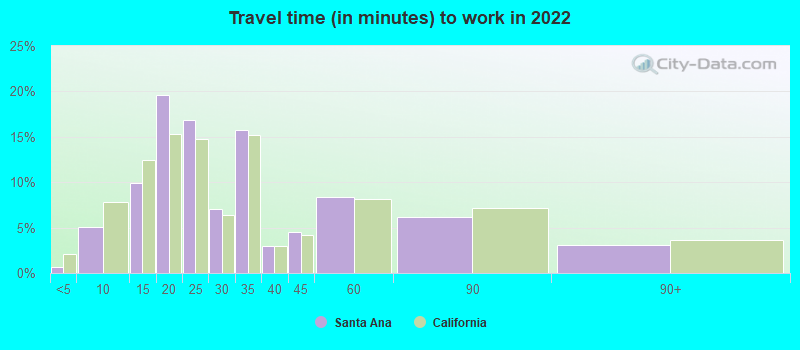
Average travel time to work
Type
Santa Ana
Southwest San Gabriel Valley
Average
30.4 min
29.1 min
Real Estate
Real estate in Santa Ana has seen steady appreciation over the years, but it's generally more expensive than in Southwest San Gabriel Valley. Single-family homes are prevalent in both locales, although Santa Ana also offers more condominium and high-rise residential options.
Neighborhoods
Both cities boast diverse neighborhoods, from bustling downtown areas to quieter suburbs. Santa Ana's Downtown and Floral Park are steeped in history and culture, while SouthWest San Gabriel Valley's quieter residential neighborhoods offer tree-lined streets and parks such as in the cities of San Marino and South Pasadena.
Houses and residents
Type
Santa Ana
Southwest San Gabriel Valley
Houses
80,604
102,656
Average household size (people)
4.4
3.1
Houses occupied
78,674 (97.6%)
99,543 (97%)
Houses occupied by owners
35,317 (44.9%)
47,333 (47.6%)
Houses occupied by renters
43,357 (55.1%)
52,210 (52.5%)
Median rent asked for vacant for-rent units
$1,407
$1,828
Median price asked for vacant for-sale houses and condos
$976,981
$1,138,428
Estimated median house or condo value
$623,000
$723,161
Median number of rooms in apartments
3.9
3.7
Median number of rooms in houses and condos
5.6
5.9
Renting percentage
52.5%
51.7%
Housing density (houses/condos per square mile)
2,969.6
2,909.6
Household income disparities
40.4%
44%
Housing units without a mortgage
318 (1.2%)
13,166 (31.1%)
Housing units with both a second mortgage and home equity loan
Self-employed workers in own not incorporated business
13,591
8,660
State government workers
3,716
4,158
Unpaid family workers
355
639
Industries and Occupations
Santa Ana is a hub for various industries, including manufacturing, aerospace, and technology with a strong presence of public administration. In contrast, Southwest San Gabriel Valley has a more diverse economy with healthcare, education, and retail playing vital roles in the job market.
Both Santa Ana and Southwest San Gabriel Valley have excellent health care provisions. Santa Ana is the home to various esteemed medical facilities like the St. Joseph Hospital, while Southwest San Gabriel Valley houses notable institutions such as Emanate Health Queen of the Valley Hospital.
Health (county statistics)
Type
Santa Ana
Southwest San Gabriel Valley
General health status score of residents in this county from 1 (poor) to 5 (excellent)
Santa Ana boasts modern infrastructure with well-organized city streets, public buildings, and commercial spaces, making it quite appealing. The city's development continues to be on the upward trajectory. On the other hand, Southwest San Gabriel Valley balances urban development with open green spaces and lacks some of the high-rise structure density found in Santa Ana.
Infrastructure
Type
Santa Ana
Southwest San Gabriel Valley
TV stations
2
26
Culture and Food
Santa Ana boasts a lively arts scene, rich history, and exciting culinary experiences, particularly in Latin cuisine owing to its high Mexican-American population. Meanwhile, Southwest San Gabriel Valley mirrors much of the Asian-American culture, hosting a plethora of quality Asian eateries.
Sports Teams
Neither Santa Ana nor Southwest San Gabriel Valley host major league sports teams. However, proximity to Los Angeles ensures easy access to LA's renowned sports scene, from the Lakers and Clippers in basketball to Dodgers and Angels in baseball.
 Santa Ana, CA
 Southwest San Gabriel Valley, CA