Santa Ana and Pomona are diverse cities in California, each with its unique appeal. Both cities embody California's dynamic culture and vibrant economy. However, the two cities vary in terms of safety, cost of living, education, work opportunities, real estate, and other lifestyle aspects. This comparison seeks to offer an in-depth look at these two cities, providing valuable insights for potential residents and tourists alike.
Distance between
Santa Ana, CA and
Pomona, CA : 23.3 miles
Santa Ana's population is larger by 109%. Its population has decreased by 28,536 people (8.4%) since 2000. The population of Pomona has decreased by 1,135 people (0.8%) during that time.
Santa Ana, the county seat of Orange County, has been improving in terms of safety over the years. However, its crime rate is still higher than the national average. Pomona, located in Los Angeles County, also grapples with crime issues although the crime rate has been decreasing recently. Travellers and residents are always advised to be cautious and aware of their surroundings in both cities.
City-data.com crime index counts serious crimes and violent crime more heavily. It adjusts for the number of visitors and daily workers commuting into cities. (higher means more crime, U.S. average = 301.1)
City-data.com crime index counts serious crimes and violent crime more heavily. It adjusts for the number of visitors and daily workers commuting into cities. (higher means more crime, U.S. average = 301.1)
Sex Offenders
According to our data, there are 425 registered sex offenders living in Santa Ana and 251 registered sex offenders living in . The ratio of residents to sex offenders in Santa Ana is 786 to 1; the ratio in Pomona is 607 to 1. The number of registered sex offenders compared to the number of residents is a smaller in Santa Ana than in Pomona.
Cost of Living
The cost of living in Pomona is significantly lower compared to Santa Ana, largely due to the cheaper housing market. Santa Ana, being in the heart of Orange County, has a cost of living significantly higher than the national average. Both cities, however, are less costly compared to many other California cities like Los Angeles and San Francisco.
Income Tax
California's income tax is progressively structured, and since both cities are in California, residents can expect to pay the same state income tax rates, regardless of whether they live in Santa Ana or Pomona.
Property Tax
Orange County, where Santa Ana is located, has slightly higher property tax rates compared to Los Angeles County, where Pomona is. However, the actual property tax paid depends on the assessed value of the property.
Sales Tax
With regards to sales tax, both Santa Ana and Pomona have high rates due to California's generally high state sales tax. While you will find minor variations between the two cities, they are negligible.
Income
Type
Santa Ana
Pomona
Estimated median household income
$80,265
$70,494
Estimated per capita income
$26,691
$24,692
Cost of living index (U.S. average is 100)
88.6
136.8
If you make $50,000 in Santa Ana, you will have to make $77,201 in Pomona to maintain the same standard of living.
Geographical Conditions
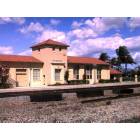
Santa Ana is located near the coast with flat, low-lying geography characterized by lush green spaces and parks. Pomona, on the other hand, is further inland and surrounded by the Pomona Valley, San Gabriel Valley, and the San Bernardino Mountains.
Santa Ana and Pomona offer quality education with several public and private schools, colleges, and universities. Santa Ana is home to Santa Ana College and several quality K-12 schools. In Pomona, top institutions like the Cal Poly Pomona and the Western University of Health Sciences show the commitment of the city towards education.
Santa Ana’s economy revolves around various industries like healthcare, education, government services, and retail. In Pomona, the economy is driven by education, health services, trade, and manufacturing. Both cities present ample job opportunities for residents and have commendable economic growth.
Biggest Employers
In Santa Ana, the County of Orange, Ingram Micro, and Tenet Healthcare are among the largest employers. In contrast, Pomona's biggest employers are Pomona Valley Hospital Medical Center, Cal Poly Pomona, and the Pomona Unified School District.
There were 231 building permits issued in Santa Ana in 2012 (189 more than in 2011) compared to 118 building permits issued in Pomona in 2012 (114 more than in 2011).
In Santa Ana (Orange County), 45.8% voted for Democrats and 52.0% for Republicans in 2012 Presidential Election. In Pomona (Los Angeles County), 69.7% voted for Democrats and 27.8% for Republicans.
Elections
Type
Democrats
Republicans
Other
Year
Santa Ana
Pomona
Santa Ana
Pomona
Santa Ana
Pomona
2020
53.6%
71.0%
44.6%
26.9%
1.8%
2.1%
2016
50.9%
72.0%
42.4%
22.5%
6.7%
5.5%
2012
45.8%
69.7%
52.0%
27.8%
2.3%
2.4%
2008
47.8%
69.2%
50.3%
28.8%
1.9%
1.9%
2004
39.3%
63.3%
60.2%
35.7%
0.5%
1.0%
2000
40.4%
63.6%
55.9%
32.4%
3.7%
4.0%
1996
37.9%
59.3%
51.7%
31.0%
10.5%
9.7%
Breakdown of population affiliated with a religious congregation
Type
Adherents
Congregations
Religion
Santa Ana
Pomona
Santa Ana
Pomona
CATHOLIC CHURCH
26.5%
36.1%
4.4%
4.7%
SOUTHERN BAPTIST CONVENTION
2.3%
1.0%
8.8%
9.0%
MUSLIM ESTIMATE
0.8%
0.7%
1.3%
1.0%
LUTHERAN CHURCH
0.6%
0.2%
2.0%
1.6%
EPISCOPAL CHURCH
0.4%
0.4%
1.4%
1.4%
EVANGELICAL LUTHERAN CHURCH IN AMERICA
0.4%
0.2%
2.3%
1.9%
SEVENTH DAY ADVENTIST CHURCH
0.4%
0.5%
1.3%
2.4%
REFORMED CHURCH IN AMERICA
0.3%
0.1%
0.2%
0.2%
AMERICAN BAPTIST CHURCHES IN THE USA
0.2%
0.5%
1.7%
3.1%
Weather
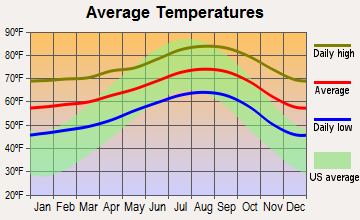
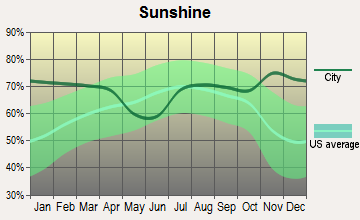
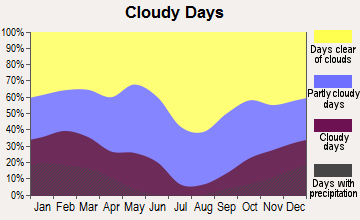
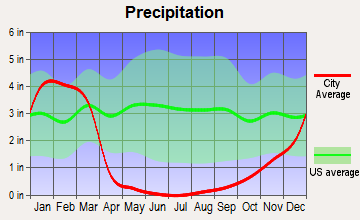
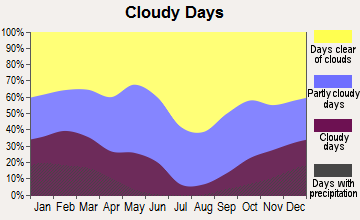
Both Santa Ana and Pomona experience the typical Southern California climate with mild, wet winters and hot, dry summers. Santa Ana tends to be a bit cooler due to its proximity to the ocean, making it ideal for people who enjoy the beach. Pomona, being further inland, gets hotter during summers.
Weather and climate
Type
Santa Ana
Pomona
Temperature - Average
65.4°F
63.5°F
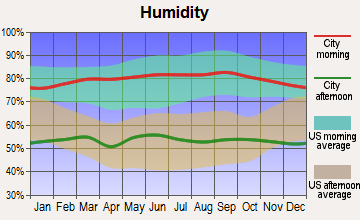
Humidity - Average morning or afternoon humidity
69.9%
65%
Humidity - Differences between morning and afternoon humidity
26.2%
19.9%
Humidity - Maximum monthly morning or afternoon humidity
78.3%
71.2%
Humidity - Minimum monthly morning or afternoon humidity
52%
51.2%
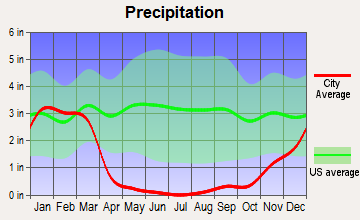
Precipitation - Yearly average
13.8 in
17 in
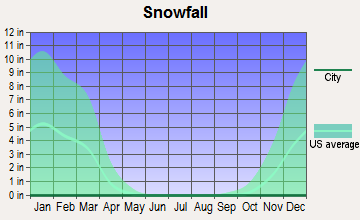
Snowfall - Yearly average
0 in
0 in
Clouds - Number of days clear of clouds
26.5%
27.8%
Sunshine amount - Average
78.4%
78.4%
Sunshine amount - Differences during a year
21.9%
21.9%
Sunshine amount - Maximum monthly
84.8%
84.9%
Sunshine amount - Minimum monthly
62.9%
63%
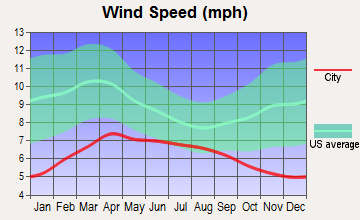
Wind speed - Average
5.9 mph
3.8 mph
Average climate in Santa Ana, California
Average climate in Pomona, California
Air pollution
Type
AQI
CO
NO2
OZONE
PB
PM10
PM25
SO2
Year
Santa Ana
Pomona
Santa Ana
Pomona
Santa Ana
Pomona
Santa Ana
Pomona
Santa Ana
Pomona
Santa Ana
Pomona
Santa Ana
Pomona
Santa Ana
Pomona
2018
124
142
0.34
0.43
14.2
19.4
27.0
24.2
N/A
0.007
27.5
32.7
12.3
14.2
0.7
0.4
2017
129
150
0.35
0.46
13.9
20.7
29.1
25.7
N/A
0.006
26.7
34.4
13.6
14.5
0.5
0.2
2016
107
137
0.35
0.31
12.6
20.3
29.2
24.4
N/A
0.007
24.1
30.2
12.7
14.4
0.2
0.3
2015
128
144
0.32
0.27
13.4
20.9
29.6
28.2
N/A
0.006
25.0
30.8
14.7
15.3
0.2
0.3
2014
127
145
0.29
0.30
13.2
22.1
28.6
28.3
N/A
0.007
26.7
33.8
15.9
14.8
0.4
0.3
2013
123
143
0.34
0.34
13.9
22.3
27.6
25.1
0.003
0.007
28.8
33.1
14.0
14.0
0.3
0.4
2012
115
147
0.31
0.38
12.9
21.4
26.7
23.5
0.004
0.006
27.5
32.8
14.5
16.8
0.1
0.5
2011
118
147
0.31
0.32
14.8
24.6
27.1
22.7
0.006
0.007
27.5
31.8
15.9
18.7
0.7
0.5
2010
107
141
0.34
0.51
14.4
26.0
26.5
23.5
0.011
0.008
23.5
28.3
14.6
16.7
0.6
1.1
2009
133
153
0.35
0.54
16.0
27.3
27.7
24.8
0.010
0.009
24.4
26.8
14.9
17.7
1.1
1.1
2008
138
159
0.38
0.59
17.1
30.1
28.2
25.0
0.010
0.009
30.1
29.4
21.6
16.0
1.1
1.3
2007
121
134
0.36
0.61
17.0
31.4
27.1
22.8
0.012
0.011
N/A
N/A
N/A
N/A
0.8
1.7
2006
120
125
0.40
0.70
17.7
30.7
26.6
21.7
0.007
0.007
N/A
N/A
N/A
N/A
1.3
1.7
2005
119
133
0.40
0.75
18.2
30.8
28.3
20.8
0.013
0.012
N/A
N/A
N/A
N/A
1.3
2.6
2004
128
141
0.50
0.85
19.4
31.3
31.2
20.3
0.014
0.013
N/A
N/A
N/A
N/A
1.6
1.8
2003
139
141
0.64
1.00
22.3
35.2
28.3
20.2
0.029
0.018
N/A
N/A
N/A
N/A
1.1
1.3
2002
122
137
0.66
1.04
22.3
36.5
25.1
18.5
0.019
0.018
N/A
N/A
N/A
N/A
1.7
0.8
2001
120
144
0.76
1.11
22.6
36.9
25.1
12.6
0.036
0.031
N/A
N/A
N/A
N/A
1.5
1.2
2000
127
152
0.80
1.18
25.7
43.9
23.7
14.6
0.028
0.034
N/A
N/A
N/A
N/A
1.9
1.7
Natural disasters
Type
Santa Ana
Pomona
Tornado activity compared to U.S. average
19.1%
18.4%
Earthquake activity compared to U.S. average
6,931.4%
7,323.7%
Natural disasters compared to U.S. average
32%
57%
Transportation
Both cities have public transit systems that include buses, trains, and shuttles. Santa Ana features the OC Bus, Metrolink, and the proposed OC Streetcar. Pomona is connected via the MetroLink train and Foothill Transit bus system. Both cities have highly congested areas during peak hours.
Transport
Type
Santa Ana
Pomona
Amtrak stations
1
1
Amtrak stations nearby
3
3
FAA registered aircraft
150
33
FAA registered aircraft manufacturers and dealers
15
0
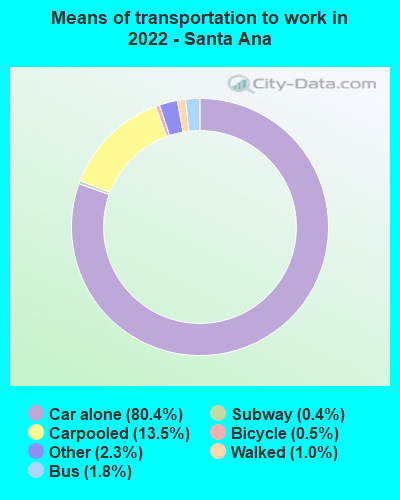
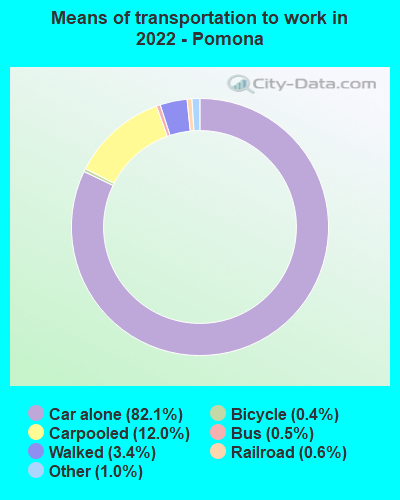
Means of transportation to work
Type
Santa Ana
Pomona
Bicycle
0.2%
0.2%
Bus
0.9%
1.5%
Carpooled
12%
11.5%
Car alone
83.6%
84.4%
Motorcycle
0.1%
0.1%
Railroad
0.1%
0.5%
Walked
1.4%
1.6%
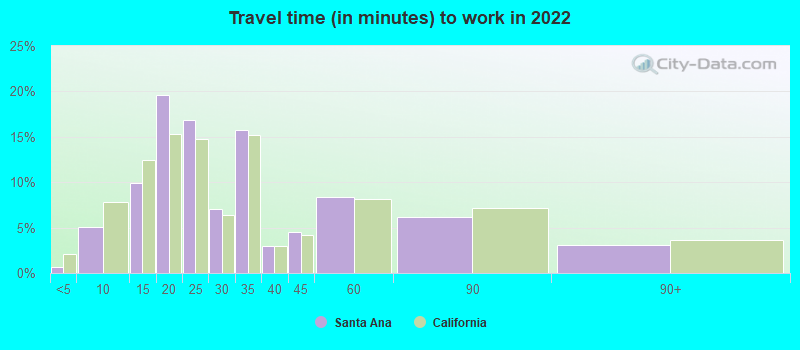
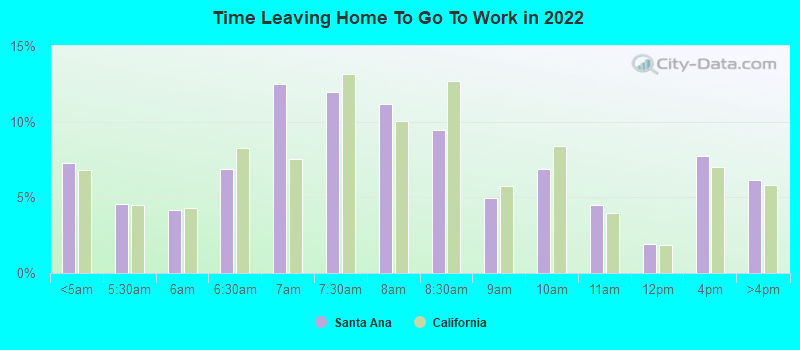
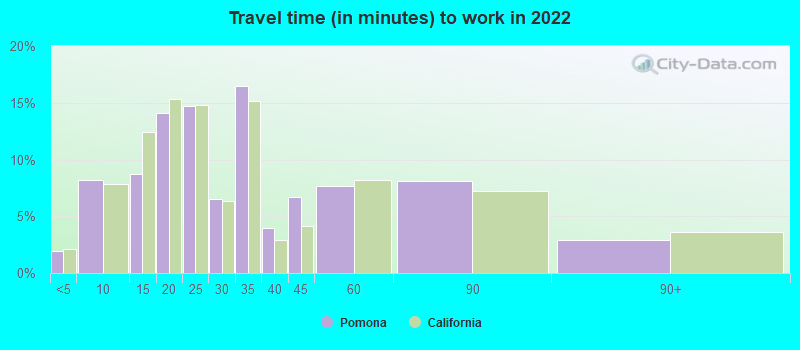
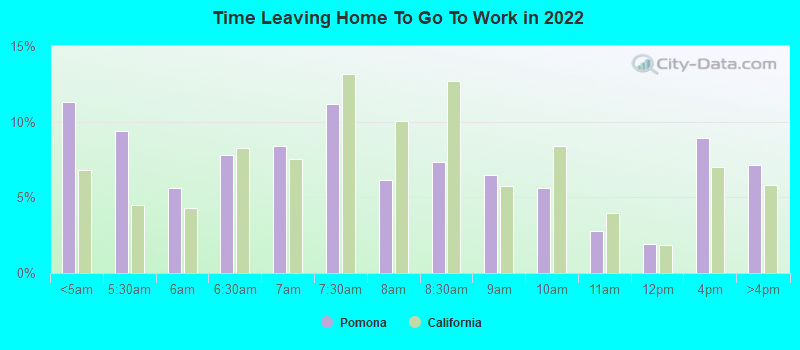
Average travel time to work
Type
Santa Ana
Pomona
Average
30.4 min
31.7 min
Other means
25.5 min
31 min
Public transportation
48.1 min
51.3 min
Private vehicle occupancy
Type
Santa Ana
Pomona
Average
1.2
1.2
Drove alone
84.6%
82.3%
In 2 person carpool
11.7%
13.4%
In 3 person carpool
2.7%
2.8%
In 4 person carpool
0.6%
0.9%
In 5-6 person carpool
0.4%
0.5%
How many people usually rode to work in the car, truck or van.
Real Estate
Real estate in Santa Ana tends to be more expensive than in Pomona, reflecting Orange County's generally high property values. However, both cities have diverse housing options, from single-family homes to apartments.
Neighborhoods
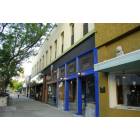
Santa Ana is known for its distinct neighborhoods, each with their unique characteristics like the historic homes in Floral Park, and the vibrant downtown area. Pomona neighborhoods also have their charm, such as the North Pomona with its feel of small-town charm and the South Pomona known for its diversity.
Houses and residents
Type
Santa Ana
Pomona
Houses
80,604
41,376
Average household size (people)
4.4
3.8
Median year apartment built
1974
1974
Median year house/condo built
1962
1960
Length of stay in the house since moving in
15.9 years
15.3 years
Houses occupied
78,674 (97.6%)
40,142 (97%)
Houses occupied by owners
35,317 (44.9%)
20,591 (51.3%)
Houses occupied by renters
43,357 (55.1%)
19,551 (48.7%)
Median rent asked for vacant for-rent units
$1,407
$1,439
Median monthly housing costs
$1,836
$1,634
Median price asked for vacant for-sale houses and condos
$976,981
$501,466
Estimated median house or condo value
$623,000
$525,300
Median numbers of rooms
4.5
4.9
Median number of rooms in apartments
3.9
4
Median number of rooms in houses and condos
5.6
5.6
Median house price - detached houses
$724,856
$508,381
Median house price - in 3-to-4-unit structures
$351,406
$415,289
Median house price - in 5 or more unit structures
$406,926
$425,598
Median house price - mobile homes
$125,004
$60,959
Median house price - Townhouses or other attached units
$492,339
$710,275
Median house price - All housing units
$648,392
$490,157
Median house age
53
52
Renting percentage
52.5%
44.9%
Housing density (houses/condos per square mile)
2,969.6
1,811.5
House value disparities
21.7%
21.4%
Household income disparities
40.4%
43.8%
Median household income for houses/condes with a mortgage
$120,617
$111,858
Median household income for apartments without a mortgage
$74,449
$79,406
Housing units without a mortgage
318 (1.2%)
287 (2%)
Housing units with both a second mortgage and home equity loan
1,175 (4.6%)
474 (3.3%)
Housing units with a mortgage
25,378 (98.8%)
14,284 (98%)
Housing units with a home equity loan
23 (0.1%)
0 (0%)
Housing units with a second mortgage
1,438 (5.6%)
701 (4.8%)
House/condo owner moved in on average (years ago)
14
14
House/condo renter moved in on average (years ago)
5
4
Housing units lacking complete kitchen facilities
3.3%
1.5%
Housing units in structures
Housing units in structures
Santa Ana
Pomona
One, detached
46.4%
60.3%
One, attached
5.8%
9.4%
Two
3.6%
1.4%
3 or 4
7.3%
4.3%
5 to 9
5.7%
5.3%
10 to 19
8.8%
4.5%
20 to 49
6.3%
4.3%
50 or more
11.0%
6.6%
Mobile homes
4.9%
3.7%
Median real estate property taxes paid for housing units
Self-employed workers in own not incorporated business
13,591
3,907
State government workers
3,716
2,100
Unpaid family workers
355
124
Industries and Occupations
Key industries in Santa Ana include technology, finance, and healthcare, with many residents employed in sales, office, and administrative support roles. Pomona has a diverse economy, with prominent sectors being education, health, arts, entertainment, and manufacturing.
Santa Ana is served by multiple hospitals and health centers, including the renowned Children's Hospital of Orange County and UC Irvine Medical Center. Pomona is home to Pomona Valley Hospital Medical Center which is well-respected regionally. Both cities have facilities for regular checkups and emergencies.
Health (county statistics)
Type
Santa Ana
Pomona
General health status score of residents in this county from 1 (poor) to 5 (excellent)
Santa Ana boasts well-developed infrastructure, with parks, community centers, and the Santa Ana Freeway. Pomona, noted for its Victorian-era downtown, also has essential infrastructure including freeways, parks, and public utilities. Both cities have room for improvement in terms of maintaining and upgrading their infrastructure.
Infrastructure
Type
Santa Ana
Pomona
Hospitals
9
11
TV stations
2
20
Bank branches located here
31
7
Bank institutions located here
13
5
Main business address for public companies
15
2
Drinking water stations with reported violations in the past
HMDA - Conventional home purchase loans - Applications denied
Year
Santa Ana
Pomona
1999
955
375
2000
834
306
2001
725
244
2002
933
335
2003
1,222
620
2004
1,657
832
2005
2,302
1,130
2006
2,615
1,317
2007
1,456
724
2008
694
276
2009
399
146
Culture and Food
Santa Ana provides a vibrant cultural scene with its many museums, art galleries, and theaters. Pomona is home to numerous music venues and the renowned Pomona Art Walk. Both cities offer diverse culinary scenes featuring cuisine from all over the world.
Sports Teams
Santa Ana is near Anaheim, home to teams like the Anaheim Ducks (NHL) and Los Angeles Angels (MLB). Pomona, while not hosting major league sports teams, has Fairplex which hosts NHRA drag racing events.


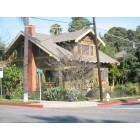

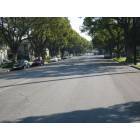
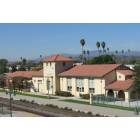

 Santa Ana, CA
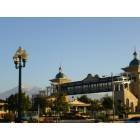
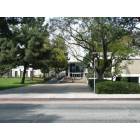
 Pomona, CA