San Jose and West Contra Costa, both in California, offer different living experiences. Perfect for tech-savvy individuals wanting a bustling urban life, San Jose radiates with job opportunities, cultural diversity, and a vibrant lifestyle. West Contra Costa, meanwhile, provides a suburban, family-friendly atmosphere. Both areas present their unique advantages but also come with their respective challenges. This comparison aims to help you identify which fits your lifestyle and preferences more.
San Jose, being a large city, experiences more crime compared to smaller areas like West Contra Costa. However, it is relatively safe compared to other large U.S. cities. The city has invested heavily in its police force to maintain security. West Contra Costa's smaller population means fewer crimes, with safety varying from neighborhood to neighborhood.
Cost of Living
San Jose is one of the priciest U.S. cities, reflecting in its housing, transportation, and general living costs. West Contra Costa has a significantly lower cost of living, offering a good alternative for those aiming for California lifestyle without the San Jose price tag.
Income Tax
Both areas are subject to California's state income tax rates, but San Jose’s city income tax is higher.
Property Tax
Property taxes for both regions are based on the state's guideline, which is roughly 1% of the home's market value. Due to San Jose's high real estate prices, property taxes can be significantly higher there.
Sales Tax
Both San Jose and West Contra Costa are subject to California's high sales tax, with San Jose's rate at 9.25% and West Contra Costa's ranging from 8.25% to 9.25%, depending on the city.
Income
Type
San Jose
West Contra Costa
Estimated median household income
$126,377
$87,268
Estimated per capita income
$57,357
$39,820
Cost of living index (U.S. average is 100)
127.4
131
If you make $50,000 in San Jose, you will have to make $51,413 in West Contra Costa to maintain the same standard of living.
Geographical Conditions
San Jose is in Silicon Valley with great outdoor spaces, while West Contra Costa boasts beautiful coastal areas and parks.
Geographical information
Type
San Jose
West Contra Costa
Land area
174.9 sq. miles
68.1 sq. miles
Population density
5,624.3 people per sq. mile
3,673.6 people per sq. mile
Relative area comparison
San Jose, CA West Contra Costa, CA
Education
San Jose is known for its excellent educational institutions, like San Jose State University and high-ranking public and private schools. West Contra Costa also offers a variety of public, private, and charter schools but lacks the high-ranking universities present in San Jose.
San Jose's economy is robust and diverse, with opportunities in various domains, particularly in tech. On the other hand, West Contra Costa's economy is smaller and primarily centered around local businesses and services.
Biggest Employers
Major employers in San Jose include software giant Adobe, online retail juggernaut eBay, and tech behemoth Cisco Systems. In West Contra Costa, several school districts and health care providers like Kaiser Permanente provide substantial employment.
In San Jose (Santa Clara County), 70.0% voted for Democrats and 27.1% for Republicans in 2012 Presidential Election. In West Contra Costa (Contra Costa County), 66.2% voted for Democrats and 31.1% for Republicans.
Elections
Type
Democrats
Republicans
Other
Year
San Jose
West Contra Costa
San Jose
West Contra Costa
San Jose
West Contra Costa
2020
72.7%
71.8%
25.2%
26.4%
2.1%
1.8%
2016
72.7%
67.5%
20.6%
24.5%
6.7%
8.0%
2012
70.0%
66.2%
27.1%
31.1%
2.9%
2.7%
2008
69.6%
68.0%
28.6%
30.2%
1.8%
1.8%
2004
64.3%
62.6%
34.8%
36.7%
0.9%
0.7%
2000
60.7%
59.0%
34.4%
37.2%
4.9%
3.8%
1996
56.9%
55.7%
32.2%
35.2%
11.0%
9.1%
Breakdown of population affiliated with a religious congregation
Type
Adherents
Congregations
Religion
San Jose
West Contra Costa
San Jose
West Contra Costa
CATHOLIC CHURCH
25.1%
21.8%
6.0%
5.2%
MUSLIM ESTIMATE
1.1%
1.0%
1.8%
1.4%
SOUTHERN BAPTIST CONVENTION
0.9%
1.3%
7.7%
10.0%
EPISCOPAL CHURCH
0.5%
0.5%
2.3%
2.3%
SEVENTH DAY ADVENTIST CHURCH
0.4%
0.3%
2.6%
1.5%
EVANGELICAL LUTHERAN CHURCH IN AMERICA
0.3%
0.5%
2.3%
2.0%
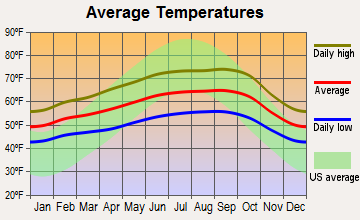
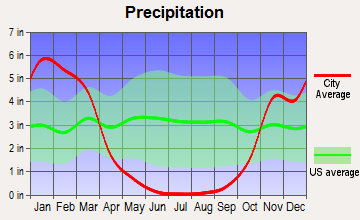
Weather
Both regions enjoy the characteristic California weather. San Jose experiences hot, dry summers, and mild winters with little rainfall, perfect for outdoor activities throughout the year. West Contrace Costa also experiences a Mediterranean climate, with cooler and wetter winters due to its proximity to the coast.
Weather and climate
Type
San Jose
West Contra Costa
Temperature - Average
60.9°F
58.3°F
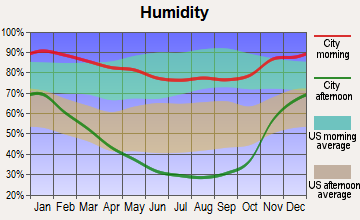
Humidity - Average morning or afternoon humidity
77.3%
84.1%
Humidity - Differences between morning and afternoon humidity
35.5%
29%
Humidity - Maximum monthly morning or afternoon humidity
87%
90.8%
Humidity - Minimum monthly morning or afternoon humidity
51.6%
61.7%
Precipitation - Yearly average
16.1 in
28.6 in
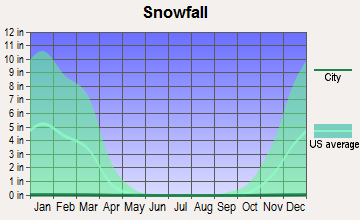
Snowfall - Yearly average
0 in
0 in
Clouds - Number of days clear of clouds
27.4%
27.1%
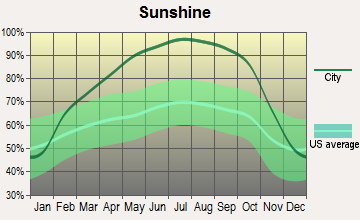
Sunshine amount - Average
73.8%
73%
Sunshine amount - Differences during a year
23%
22.1%
Sunshine amount - Maximum monthly
77.4%
77%
Sunshine amount - Minimum monthly
54.4%
55%
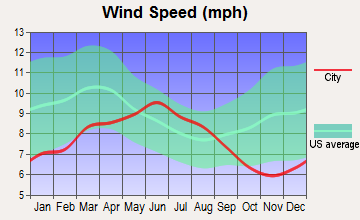
Wind speed - Average
10.3 mph
11.4 mph
Average climate in San Jose, California
Average climate in West Contra Costa, California
Air pollution
Type
AQI
CO
NO2
OZONE
PB
PM25
SO2
Year
San Jose
West Contra Costa
San Jose
West Contra Costa
San Jose
West Contra Costa
San Jose
West Contra Costa
San Jose
West Contra Costa
San Jose
West Contra Costa
San Jose
West Contra Costa
2018
94
105
0.49
0.42
14.5
8.7
22.2
24.4
0.006
0.012
12.5
12.9
0.2
0.5
2017
91
104
0.50
0.37
14.6
9.2
23.5
23.1
0.004
0.008
10.2
10.7
0.2
0.7
2016
69
76
0.47
0.36
13.7
8.6
22.4
22.8
0.003
0.005
8.8
8.1
0.2
0.8
2015
84
91
0.52
0.45
15.4
9.5
22.3
23.6
0.004
0.004
9.2
9.1
0.3
0.8
2014
83
86
0.40
0.42
13.9
9.4
21.5
22.3
0.004
0.005
8.2
10.4
0.2
0.9
2013
90
87
0.41
0.33
15.2
10.6
20.8
22.1
0.005
0.004
12.4
11.8
0.3
0.5
2012
74
90
0.35
0.33
13.3
9.6
21.8
24.1
0.003
0.003
10.1
8.2
0.3
1.9
2011
83
94
0.37
0.34
14.8
10.3
20.6
22.7
0.003
0.003
12.3
10.0
0.3
3.1
2010
88
90
0.35
0.33
14.4
11.2
20.4
21.9
0.004
0.015
9.0
9.1
0.4
1.3
2009
89
99
0.40
0.27
14.7
12.2
18.2
19.9
0.004
0.006
9.3
10.4
0.3
0.9
2008
100
110
0.45
0.23
16.7
12.0
20.6
22.7
N/A
0.006
12.6
12.7
N/A
1.1
2007
92
99
0.44
0.38
16.6
12.0
20.0
22.1
0.009
0.006
11.1
10.6
N/A
1.2
2006
100
104
0.46
0.43
18.0
12.7
21.8
21.4
N/A
N/A
11.1
11.0
N/A
1.6
2005
95
94
0.68
0.37
18.6
12.0
20.0
20.4
N/A
N/A
11.6
10.3
N/A
1.7
2004
98
105
0.63
0.59
18.5
13.1
20.4
20.7
N/A
0.004
9.9
12.0
N/A
1.6
2003
87
79
0.73
0.50
20.6
13.5
19.1
22.0
N/A
N/A
N/A
N/A
N/A
1.5
2002
78
81
0.65
0.47
19.5
13.8
18.0
22.6
0.006
0.008
N/A
N/A
N/A
1.2
2001
75
83
0.61
0.41
18.5
13.9
16.8
21.5
0.008
0.008
N/A
N/A
N/A
1.3
2000
65
76
0.66
0.48
18.9
14.0
15.6
19.9
0.009
0.013
N/A
N/A
N/A
2.0
Natural disasters
Type
San Jose
West Contra Costa
Tornado activity compared to U.S. average
9%
8.4%
Earthquake activity compared to U.S. average
7,785.3%
7,617.7%
Natural disasters compared to U.S. average
19%
18%
Transportation
San Jose has an excellent public transportation system, including buses, light rail, and bike lanes. Commuting in West Contra Costa is also convenient with several bus lines, two BART stations, and access to major freeways.
Transport
Type
San Jose
West Contra Costa
Amtrak stations
1
0
Amtrak stations nearby
3
3
FAA registered aircraft
553
0
FAA registered aircraft manufacturers and dealers
13
0
Means of transportation to work
Type
San Jose
West Contra Costa
Bicycle
1%
0.7%
Bus
1.1%
4.1%
Carpooled
11.4%
18.6%
Car alone
80.5%
63%
Motorcycle
0.2%
0.2%
Railroad
0.2%
0.4%
Streetcar
0%
0.1%
Subway
0.2%
7%
Taxicab
0%
0.2%
Walked
3.3%
1.5%
Average travel time to work
Type
San Jose
West Contra Costa
Average
29.2 min
35 min
Real Estate
San Jose's real estate market is among the nation’s most expensive, with homes costing millions. West Contra Costa provides a more affordable alternative, with home prices averaging lower.
Neighborhoods
San Jose is composed of diverse neighborhoods, each possessing its character. Meanwhile, West Contra Costa offers a more suburban feel, with quieter neighborhoods.
Houses and residents
Type
San Jose
West Contra Costa
Houses
340,561
86,004
Average household size (people)
3.1
2.8
Houses occupied
322,881 (94.8%)
83,291 (96.8%)
Houses occupied by owners
179,797 (55.7%)
50,448 (60.6%)
Houses occupied by renters
143,084 (44.3%)
32,843 (39.4%)
Median rent asked for vacant for-rent units
$3,214
$1,781
Median price asked for vacant for-sale houses and condos
$1,197,016
$1,269,474
Estimated median house or condo value
Over $1,000,000
$597,522
Median number of rooms in apartments
3.6
4.3
Median number of rooms in houses and condos
6
5.4
Renting percentage
41.5%
40.9%
Housing density (houses/condos per square mile)
1,947.6
1,262.7
Household income disparities
38.3%
46.4%
Housing units without a mortgage
2,632 (2.1%)
11,194 (24.8%)
Housing units with both a second mortgage and home equity loan
13,499 (10.6%)
155 (0.3%)
Housing units with a mortgage
124,224 (97.9%)
34,015 (75.2%)
Housing units with a home equity loan
346 (0.3%)
3,361 (7.4%)
Housing units with a second mortgage
16,249 (12.8%)
4,664 (10.3%)
Housing units lacking complete kitchen facilities
1.2%
0.8%
Housing units lacking complete plumbing facilities
Self-employed workers in own not incorporated business
28,517
8,123
State government workers
10,222
5,849
Unpaid family workers
472
314
Industries and Occupations
San Jose is heralded as the Capital of Silicon Valley and houses many opportunities in tech and related industries. West Contra Costa’s economy is more diverse with employment across several sectors like education, health care, and retail.
San Jose offers world-class healthcare with many top-rated hospitals. West Contra Costa also provides decent healthcare options but lacks the level of specialized care available in San Jose.
Health (county statistics)
Type
San Jose
West Contra Costa
General health status score of residents in this county from 1 (poor) to 5 (excellent)
San Jose boasts an impressive infrastructure with diverse restaurants, shopping centers, and entertainment venues. The city’s tech focus also makes it a hub for innovation. West Contra Costa has less infrastructure development but provides amenities needed for a comfortable suburban life.
Infrastructure
Type
San Jose
West Contra Costa
TV stations
9
22
Culture and Food
San Jose provides a wide range of cultural activities, museums, and diverse food scenes. West Contra Costa also offers cultural events and features diverse local eateries.
Sports Teams
San Jose is home to top-tier sports teams like the San Jose Sharks (NHL) and the Earthquakes (MLS). West Contra Costa does not have major league teams, but residents can support local school and community sports.
 San Jose, CA
 West Contra Costa, CA