San Jose, CA and North Las Vegas, NV are two incredibly diverse and vibrant cities with unique attributes appealing to both residents and tourists. Despite being less than an hour flight apart, the differences between the two demonstrate significant variances in terms of lifestyle, cost of living, local economy, and culture. This detailed comparison covers various aspects such as crime, education, health care, weather, and more, to provide a comprehensive overview for those considering relocating or just visiting these cities.
Distance between
San Jose, CA and
North Las Vegas, NV : 379.5 miles
San Jose's population is larger by 259%. Its population has grown by 88,546 people (9.9%) since 2000. The population of North Las Vegas has grown by 158,645 people (137.4%) during that time.
San Jose has lower crime rates compared to North Las Vegas, which ranks higher in both property and violent crimes. However, San Jose has certain neighborhoods with relatively higher crime rates, similar to North Las Vegas. North Las Vegas has implemented community safety programs, making strides in reducing crime rates. Safety in both cities can depend heavily on the neighborhood.
City-data.com crime index counts serious crimes and violent crime more heavily. It adjusts for the number of visitors and daily workers commuting into cities. (higher means more crime, U.S. average = 301.1)
City-data.com crime index counts serious crimes and violent crime more heavily. It adjusts for the number of visitors and daily workers commuting into cities. (higher means more crime, U.S. average = 301.1)
Sex Offenders
According to our data, there are 1,847 registered sex offenders living in San Jose and 737 registered sex offenders living in . The ratio of residents to sex offenders in San Jose is 555 to 1; the ratio in North Las Vegas is 324 to 1. The number of registered sex offenders compared to the number of residents is a smaller in San Jose than in North Las Vegas.
Cost of Living
The cost of living in San Jose is significantly higher than North Las Vegas, mainly due to housing costs. San Jose has some of the most expensive real estate in the country, while North Las Vegas offers more affordable housing options. Costs for groceries, healthcare, and transportation are also typically higher in San Jose.
Income Tax
California has some of the highest state income tax rates in the nation, impacting residents in San Jose. Residents in North Las Vegas enjoy Nevada's no state income tax policy.
Property Tax
Despite the high cost of properties in San Jose, California property tax rates are slightly lower than the national average. Meanwhile, Nevada has property tax rates that are slightly higher than national averages affecting North Las Vegas residents.
Sales Tax
The sales tax in San Jose is significantly higher compared to North Las Vegas due to California's substantial statewide sales tax. In contrast, Nevada has a lower state sales tax, resulting in a lower overall sales tax in North Las Vegas.
Income
Type
San Jose
North Las Vegas
Estimated median household income
$126,377
$67,035
Estimated per capita income
$57,357
$26,498
Cost of living index (U.S. average is 100)
127.4
98.3
If you make $50,000 in North Las Vegas, you will have to make $64,802 in San Jose to maintain the same standard of living.
Geographical Conditions
San Jose is located in the Santa Clara Valley, surrounded by rolling hills and close to the Pacific Coast. In contrast, North Las Vegas is located in a basin in the Mojave Desert framed by mountain ranges.
Both cities offer good education options, but San Jose is often favored for its highly-rated public schools and top-tier universities, including the renowned Stanford University. North Las Vegas also provides quality education with some excellent school districts and further education establishments, like Nevada State College.
San Jose severely outpaces North Las Vegas when it comes to the economy, with a strong job market driven by tech-based industries. Home to Silicon Valley, it's one of the nation's wealthiest cities. North Las Vegas also provides employment opportunities, especially in entertainment, tourism, and service industries.
Biggest Employers
Major employers in San Jose include Cisco Systems, eBay, and Adobe Systems, while the Las Vegas Valley Water District, Allegiant Air, and the Venetian Resort are among the largest employers in North Las Vegas.
There were 299 building permits issued in San Jose in 2012 (216 more than in 2011) compared to 2,835 building permits issued in North Las Vegas in 2012 (2325 more than in 2011).
In San Jose (Santa Clara County), 70.0% voted for Democrats and 27.1% for Republicans in 2012 Presidential Election. In North Las Vegas (Clark County), 56.4% voted for Democrats and 41.8% for Republicans.
Elections
Type
Democrats
Republicans
Other
Year
San Jose
North Las Vegas
San Jose
North Las Vegas
San Jose
North Las Vegas
2020
72.7%
53.7%
25.2%
44.3%
2.1%
2.0%
2016
72.7%
52.4%
20.6%
41.7%
6.7%
5.8%
2012
70.0%
56.4%
27.1%
41.8%
2.9%
1.8%
2008
69.6%
58.5%
28.6%
39.5%
1.8%
2.0%
2004
64.3%
51.8%
34.8%
46.9%
0.9%
1.3%
2000
60.7%
51.4%
34.4%
44.8%
4.9%
3.8%
1996
56.9%
75.5%
32.2%
18.8%
11.0%
5.7%
Breakdown of population affiliated with a religious congregation
Type
Adherents
Congregations
Religion
San Jose
North Las Vegas
San Jose
North Las Vegas
CATHOLIC CHURCH
25.1%
18.1%
6.0%
4.0%
MUSLIM ESTIMATE
1.1%
0.1%
1.8%
0.6%
SOUTHERN BAPTIST CONVENTION
0.9%
1.6%
7.7%
11.2%
EPISCOPAL CHURCH
0.5%
0.1%
2.3%
1.1%
SEVENTH DAY ADVENTIST CHURCH
0.4%
0.2%
2.6%
1.6%
EVANGELICAL LUTHERAN CHURCH IN AMERICA
0.3%
0.4%
2.3%
1.6%
Weather
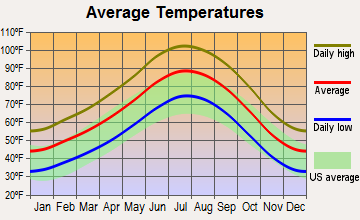
San Jose has a Mediterranean climate, with warm, dry summers and mild, wet winters. North Las Vegas has a desert climate, with extremely hot summers and short, mild winters. San Jose's weather is often considered more comfortable due to the ocean's moderating effect, but North Las Vegas offers more consistent sunshine throughout the year.
Weather and climate
Type
San Jose
North Las Vegas
Temperature - Average
60.9°F
65.8°F
Humidity - Average morning or afternoon humidity
77.3%
30.7%
Humidity - Differences between morning and afternoon humidity
35.5%
42%
Humidity - Maximum monthly morning or afternoon humidity
87%
52%
Humidity - Minimum monthly morning or afternoon humidity
51.6%
10%
Precipitation - Yearly average
16.1 in
5.4 in
Snowfall - Yearly average
0 in
1.6 in
Clouds - Number of days clear of clouds
27.4%
35.1%
Sunshine amount - Average
73.8%
91.8%
Sunshine amount - Differences during a year
23%
16%
Sunshine amount - Maximum monthly
77.4%
92%
Sunshine amount - Minimum monthly
54.4%
76%
Wind speed - Average
10.3 mph
9.2 mph
Average climate in San Jose, California
Average climate in North Las Vegas, Nevada
Air pollution
Type
AQI
CO
NO2
OZONE
PB
PM10
PM25
SO2
Year
San Jose
North Las Vegas
San Jose
North Las Vegas
San Jose
North Las Vegas
San Jose
North Las Vegas
San Jose
North Las Vegas
San Jose
North Las Vegas
San Jose
North Las Vegas
2018
94
100
0.49
0.42
14.5
14.2
22.2
35.4
0.006
N/A
27.7
N/A
12.5
7.2
0.2
0.7
2017
91
101
0.50
0.26
14.6
14.2
23.5
29.9
0.004
N/A
22.2
N/A
10.2
8.6
0.2
0.8
2016
69
93
0.47
0.37
13.7
11.9
22.4
28.4
0.003
N/A
22.8
N/A
8.8
10.2
0.2
0.8
2015
84
92
0.52
0.34
15.4
13.0
22.3
28.2
0.004
N/A
21.2
N/A
9.2
9.3
0.3
1.2
2014
83
91
0.40
0.37
13.9
11.3
21.5
27.8
0.004
N/A
23.8
N/A
8.2
10.1
0.2
1.4
2013
90
103
0.41
0.48
15.2
10.4
20.8
28.4
0.005
N/A
24.4
N/A
12.4
9.5
0.3
1.5
2012
74
96
0.35
0.52
13.3
6.0
21.8
29.5
0.003
N/A
24.8
N/A
10.1
8.8
0.3
1.4
2011
83
85
0.37
0.36
14.8
5.3
20.6
29.2
0.003
N/A
20.4
N/A
12.3
8.0
0.3
1.2
2010
88
81
0.35
0.51
14.4
5.7
20.4
28.6
0.004
N/A
18.2
N/A
9.0
7.2
0.4
N/A
2009
89
87
0.40
0.55
14.7
6.0
18.2
27.6
0.004
N/A
24.3
N/A
9.3
8.3
0.3
N/A
2008
100
82
0.45
0.66
16.7
8.2
20.6
26.3
N/A
N/A
N/A
N/A
12.6
9.5
N/A
N/A
2007
92
97
0.44
0.48
16.6
12.5
20.0
26.3
0.009
N/A
N/A
N/A
11.1
9.3
N/A
0.1
2006
100
102
0.46
0.67
18.0
14.6
21.8
26.3
N/A
N/A
N/A
N/A
11.1
9.7
N/A
0.8
2005
95
100
0.68
0.71
18.6
16.3
20.0
25.1
N/A
N/A
N/A
N/A
11.6
9.7
N/A
5.3
2004
98
86
0.63
0.63
18.5
17.4
20.4
25.5
N/A
N/A
N/A
N/A
9.9
N/A
N/A
1.6
2003
87
99
0.73
0.62
20.6
18.0
19.1
25.1
N/A
N/A
N/A
N/A
N/A
N/A
N/A
0.9
2002
78
94
0.65
0.35
19.5
17.7
18.0
24.1
0.006
N/A
N/A
N/A
N/A
N/A
N/A
0.6
2001
75
95
0.61
0.32
18.5
16.7
16.8
24.1
0.008
N/A
N/A
N/A
N/A
N/A
N/A
0.9
2000
65
95
0.66
0.34
18.9
16.2
15.6
24.0
0.009
N/A
N/A
N/A
N/A
N/A
N/A
0.4
Natural disasters
Type
San Jose
North Las Vegas
Tornado activity compared to U.S. average
9%
2.1%
Earthquake activity compared to U.S. average
7,785.3%
6,003.8%
Natural disasters compared to U.S. average
19%
12%
Transportation
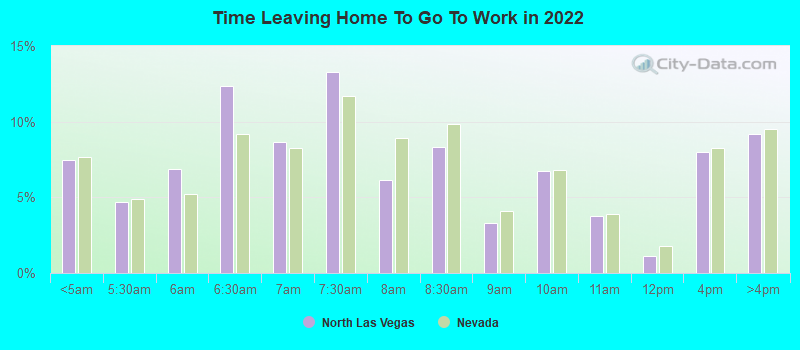
San Jose offers a variety of commuting options, including buses, light rail, and an international airport. The traffic can be intense though. Conversely, North Las Vegas has less public transit but less traffic congestion making commuting a bit easier.
Transport
Type
San Jose
North Las Vegas
Amtrak stations
1
0
Amtrak stations nearby
3
1
FAA registered aircraft
553
123
FAA registered aircraft manufacturers and dealers
13
16
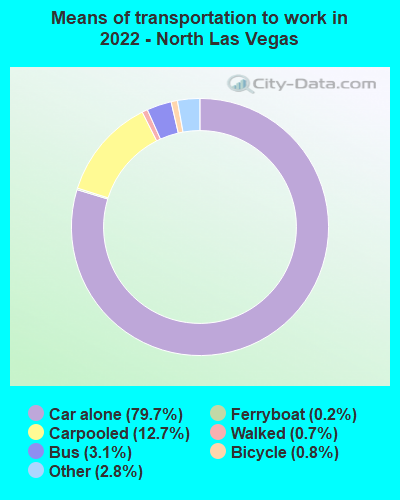
Means of transportation to work
Type
San Jose
North Las Vegas
Bicycle
1%
0.4%
Bus
1.1%
1.6%
Carpooled
11.4%
13.4%
Car alone
80.5%
80.7%
Motorcycle
0.2%
0.4%
Railroad
0.2%
0%
Subway
0.2%
0%
Walked
3.3%
0.7%
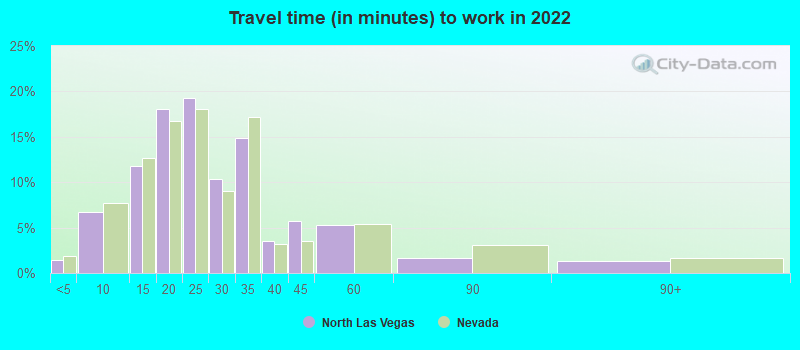
Average travel time to work
Type
San Jose
North Las Vegas
Average
29.2 min
25.8 min
Other means
27.9 min
25.9 min
Public transportation
48.5 min
55.9 min
Private vehicle occupancy
Type
San Jose
North Las Vegas
Average
1.2
1.2
Drove alone
87.3%
86.9%
In 2 person carpool
8.9%
9.2%
In 3 person carpool
1.9%
2.9%
In 4 person carpool
1.1%
0.7%
In 5-6 person carpool
0.6%
0.1%
In 7+ person carpool
0.2%
0.1%
How many people usually rode to work in the car, truck or van.
Real Estate
Real estate is significantly more expensive in San Jose than North Las Vegas. High demand and limited supply contribute to San Jose's high property values. In contrast, North Las Vegas offers substantial options for more affordable housing.
Neighborhoods
San Jose boasts diverse neighborhoods such as the vibrant downtown area and luxurious Rose Garden. North Las Vegas also offers a variety of neighborhoods, with Aliante being one of the most popular due to its amenities, parks, and proximity to the city center.
Houses and residents
Type
San Jose
North Las Vegas
Houses
340,561
91,034
Average household size (people)
3.1
3.2
Median year apartment built
1979
2002
Median year house/condo built
1973
2003
Length of stay in the house since moving in
15.6 years
9.6 years
Houses occupied
322,881 (94.8%)
85,966 (94.4%)
Houses occupied by owners
179,797 (55.7%)
51,443 (59.8%)
Houses occupied by renters
143,084 (44.3%)
34,523 (40.2%)
Median rent asked for vacant for-rent units
$3,214
$1,592
Median monthly housing costs
$2,463
$1,378
Median price asked for vacant for-sale houses and condos
$1,197,016
$288,164
Estimated median house or condo value
Over $1,000,000
$335,200
Median numbers of rooms
4.9
5.6
Median number of rooms in apartments
3.6
4.6
Median number of rooms in houses and condos
6
6.3
Median house price - detached houses
Over $1,000,000
$347,582
Median house price - in 3-to-4-unit structures
$680,453
$321,737
Median house price - in 5 or more unit structures
$688,625
$193,128
Median house price - mobile homes
$240,963
$352,751
Median house price - Townhouses or other attached units
$892,629
$462,203
Median house price - All housing units
Over $1,000,000
$349,615
Median house age
45
18
Renting percentage
41.5%
37.6%
Housing density (houses/condos per square mile)
1,947.6
1,159.5
House value disparities
21.2%
19.6%
Household income disparities
38.3%
40.2%
Median household income for houses/condes with a mortgage
$197,583
$87,018
Median household income for apartments without a mortgage
$103,711
$67,367
Housing units without a mortgage
2,632 (2.1%)
317 (0.8%)
Housing units with both a second mortgage and home equity loan
13,499 (10.6%)
1,013 (2.6%)
Housing units with a mortgage
124,224 (97.9%)
39,101 (99.2%)
Housing units with a home equity loan
346 (0.3%)
0 (0%)
Housing units with a second mortgage
16,249 (12.8%)
1,247 (3.2%)
House/condo owner moved in on average (years ago)
14
6
House/condo renter moved in on average (years ago)
3
1
Housing units lacking complete kitchen facilities
1.2%
0.9%
Housing units lacking complete plumbing facilities
0.6%
1.4%
Housing units in structures
Housing units in structures
San Jose
North Las Vegas
One, detached
50.9%
75.9%
One, attached
11.5%
3.1%
Two
1.1%
1.1%
3 or 4
5.0%
4.8%
5 to 9
5.1%
4.7%
10 to 19
4.5%
3.0%
20 to 49
4.5%
2.3%
50 or more
14.2%
3.6%
Mobile homes
3.1%
1.4%
Boats, RVs, vans, etc.
0.1%
0.0%
Median real estate property taxes paid for housing units
Self-employed workers in own not incorporated business
28,517
4,201
State government workers
10,222
2,853
Unpaid family workers
472
530
Industries and Occupations
San Jose is globally recognized as a hub for high-tech innovation, with numerous tech companies, including giants like Apple, Google, and Adobe. North Las Vegas's economy revolves around entertainment, hospitality, and manufacturing industries.
Both cities provide ample healthcare options. San Jose's healthcare sector is bolstered by premier facilities such as Stanford Health Care. North Las Vegas has several quality hospitals, including the North Vista Hospital.
Health (county statistics)
Type
San Jose
North Las Vegas
General health status score of residents in this county from 1 (poor) to 5 (excellent)
North Las Vegas has seen significant recent improvements in its infrastructure with new developments and renovations. It lacks San Jose's traffic problems and has more affordable housing. On the other hand, San Jose benefits from established infrastructure, with public transit and bike-friendly options.
Infrastructure
Type
San Jose
North Las Vegas
Hospitals
20
1
TV stations
9
14
Bank branches located here
145
27
Bank institutions located here
25
12
Main business address for public companies
74
1
Drinking water stations with no reported violations in the past
21
2
Drinking water stations with reported violations in the past
HMDA - Conventional home purchase loans - Applications denied
Year
San Jose
North Las Vegas
1999
3,839
426
2000
2,577
190
2001
1,953
110
2002
1,908
152
2003
3,578
1,025
2004
5,489
2,286
2005
6,994
3,742
2006
6,324
3,581
2007
4,298
1,737
2008
2,419
574
2009
1,631
330
Culture and Food
San Jose offers countless cultural and culinary experiences, from Mexican to Vietnamese cuisine and the San Jose Museum of Art. North Las Vegas also offers a robust dining scene and several cultural festivals.
Sports Teams
San Jose is home to NHL's San Jose Sharks and MLS's San Jose Earthquakes while North Las Vegas residents support the Las Vegas Raiders and Golden Knights, among others.


 San Jose, CA
 North Las Vegas, NV