San Jose, located in the heart of the Silicon Valley, California, and Henderson, situated in the Mojave Desert of Nevada, offer very different living experiences. The thriving tech industry in San Jose provides ample job opportunities but the high cost of living might be a trade-off. Conversely, Henderson offers lower living costs, but fewer job opportunities in high tech industries. Though both cities provide a mix of leisure activities, historical sites, culture, and cuisine, the choice could come down to preference for climate, employment opportunities, and living costs.
Distance between
San Jose, CA and
Henderson, NV : 389.5 miles
San Jose's population is larger by 205%. Its population has grown by 88,546 people (9.9%) since 2000. The population of Henderson has grown by 146,797 people (83.7%) during that time.
According to NeighborhoodScout, San Jose's crime rate is somewhat moderate; tourists and locals should exercise regular precautions. The violent crime rate is less than the national average, making it relatively safe. Henderson, on the other hand, has consistently been recognized as one of the safest cities in the United States. Both residential areas and tourist spots in Henderson have low crime rates, fostering a safer environment overall.
City-data.com crime index counts serious crimes and violent crime more heavily. It adjusts for the number of visitors and daily workers commuting into cities. (higher means more crime, U.S. average = 301.1)
City-data.com crime index counts serious crimes and violent crime more heavily. It adjusts for the number of visitors and daily workers commuting into cities. (higher means more crime, U.S. average = 301.1)
Sex Offenders
According to our data, there are 1,847 registered sex offenders living in San Jose and 523 registered sex offenders living in . The ratio of residents to sex offenders in San Jose is 555 to 1; the ratio in Henderson is 560 to 1. The number of registered sex offenders compared to the number of residents in San Jose is near to than in Henderson.
Cost of Living
The cost of living in San Jose is higher than the national average mainly because of high housing costs. The healthcare and transportation costs are also above the national average. Conversely, Henderson's cost of living is just above the national average, and housing, in particular, is significantly more affordable than in San Jose.
Income Tax
California’s high state income tax, ranging up to 13.3%, significantly affects San Jose residents. Henderson residents, by contrast, enjoy Nevada's zero state income tax policy.
Property Tax
San Jose has a property tax rate of approximately 0.793%, while Henderson's property tax rate is notably lower, at about 0.639%.
Sales Tax
Sales tax in San Jose is higher, at 9.25% compared to Henderson's 8.375%. However, Nevada's sales tax can vary depending on the locality.
Income
Type
San Jose
Henderson
Estimated median household income
$126,377
$77,924
Estimated per capita income
$57,357
$41,771
Cost of living index (U.S. average is 100)
127.4
99.2
If you make $50,000 in Henderson, you will have to make $64,214 in San Jose to maintain the same standard of living.
Geographical Conditions
San Jose is located on the San Francisco Bay, leading to varied geographical landscapes, like rolling hills and massive bay views. Henderson is in the Mojave Desert, offering pristine desert landscapes and the beautiful backdrop of the Black Mountain Range.
San Jose offers a more diverse range of educational opportunities, being home to several higher education institutions including San Jose State University and a wide range of reputable public and private K-12 schools. Henderson’s public school district, Clark County, is one of the biggest in the U.S, but the student-teacher ratio is higher. Both cities, however, offer a variety of private school options for K-12 education.
San Jose, located in Silicon Valley, is an employment hub for technology and innovation industries. Major companies like Cisco Systems, Adobe, and eBay provide ample job opportunities. Conversely, Henderson has a more diversified economy with employment opportunities spread across leisure and hospitality, trade, transportation, education, and health services. The unemployment rate in San Jose is lower than in Henderson.
Biggest Employers
San Jose's biggest employers include tech giants like Cisco Systems, eBay, and Adobe, while in Henderson, the biggest employers are the City of Henderson, casinos like The Green Valley Ranch Resort & Spa, and the Clark County School District.
There were 299 building permits issued in San Jose in 2012 (216 more than in 2011) compared to 3,356 building permits issued in Henderson in 2012 (2604 more than in 2011).
In San Jose (Santa Clara County), 70.0% voted for Democrats and 27.1% for Republicans in 2012 Presidential Election. In Henderson (Clark County), 56.4% voted for Democrats and 41.8% for Republicans.
Elections
Type
Democrats
Republicans
Other
Year
San Jose
Henderson
San Jose
Henderson
San Jose
Henderson
2020
72.7%
53.7%
25.2%
44.3%
2.1%
2.0%
2016
72.7%
52.4%
20.6%
41.7%
6.7%
5.8%
2012
70.0%
56.4%
27.1%
41.8%
2.9%
1.8%
2008
69.6%
58.5%
28.6%
39.5%
1.8%
2.0%
2004
64.3%
51.8%
34.8%
46.9%
0.9%
1.3%
2000
60.7%
51.4%
34.4%
44.8%
4.9%
3.8%
1996
56.9%
75.5%
32.2%
18.8%
11.0%
5.7%
Breakdown of population affiliated with a religious congregation
Type
Adherents
Congregations
Religion
San Jose
Henderson
San Jose
Henderson
CATHOLIC CHURCH
25.1%
18.1%
6.0%
4.0%
MUSLIM ESTIMATE
1.1%
0.1%
1.8%
0.6%
SOUTHERN BAPTIST CONVENTION
0.9%
1.6%
7.7%
11.2%
EPISCOPAL CHURCH
0.5%
0.1%
2.3%
1.1%
SEVENTH DAY ADVENTIST CHURCH
0.4%
0.2%
2.6%
1.6%
EVANGELICAL LUTHERAN CHURCH IN AMERICA
0.3%
0.4%
2.3%
1.6%
Weather
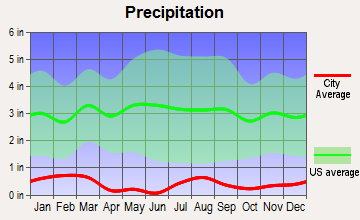
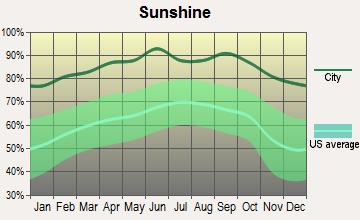
San Jose enjoys a Mediterranean climate with mild, wet winters and warm, dry summers. Average temperatures range from 42°F in winter to 82°F in summer, with around 257 sunny days per year. However, Henderson experiences a desert climate, with hot summers and mild winters. Average temperatures can soar to 104°F in the summer and dip to 36°F in winter, offering a much hotter climate overall.
Weather and climate
Type
San Jose
Henderson
Temperature - Average
60.9°F
67.8°F
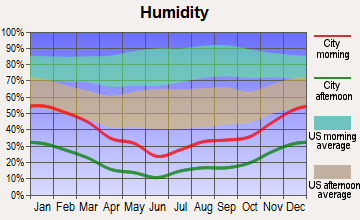
Humidity - Average morning or afternoon humidity
77.3%
30.7%
Humidity - Differences between morning and afternoon humidity
35.5%
42%
Humidity - Maximum monthly morning or afternoon humidity
87%
52%
Humidity - Minimum monthly morning or afternoon humidity
51.6%
10%
Precipitation - Yearly average
16.1 in
5.1 in
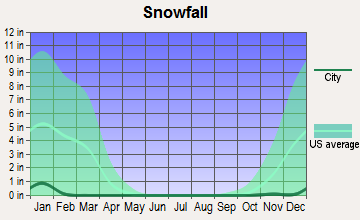
Snowfall - Yearly average
0 in
1.6 in
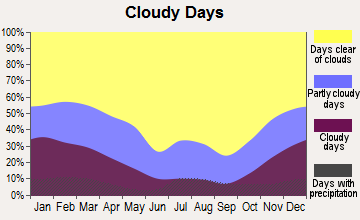
Clouds - Number of days clear of clouds
27.4%
35.1%
Sunshine amount - Average
73.8%
91.8%
Sunshine amount - Differences during a year
23%
16%
Sunshine amount - Maximum monthly
77.4%
92%
Sunshine amount - Minimum monthly
54.4%
76%
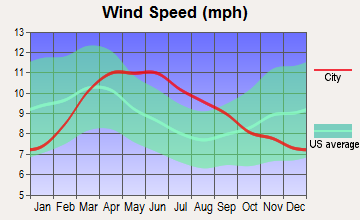
Wind speed - Average
10.3 mph
9.2 mph
Average climate in San Jose, California
Average climate in Henderson, Nevada
Air pollution
Type
AQI
CO
NO2
OZONE
PB
PM10
PM25
SO2
Year
San Jose
Henderson
San Jose
Henderson
San Jose
Henderson
San Jose
Henderson
San Jose
Henderson
San Jose
Henderson
San Jose
Henderson
2018
94
99
0.49
0.42
14.5
15.3
22.2
35.1
0.006
N/A
27.9
N/A
12.5
6.1
0.2
0.7
2017
91
89
0.50
0.34
14.6
15.5
23.5
33.9
0.004
N/A
22.1
N/A
10.2
6.7
0.2
0.8
2016
69
91
0.47
0.39
13.7
13.4
22.4
32.3
0.003
N/A
22.5
N/A
8.8
7.5
0.2
0.8
2015
84
87
0.52
0.39
15.4
14.2
22.3
32.5
0.004
N/A
20.4
N/A
9.2
7.8
0.3
1.2
2014
83
88
0.40
0.43
13.9
12.4
21.5
31.3
0.004
N/A
23.1
N/A
8.2
8.2
0.2
1.4
2013
90
95
0.41
0.43
15.2
12.1
20.8
32.0
0.005
N/A
22.8
N/A
12.4
6.7
0.3
1.5
2012
74
96
0.35
0.47
13.3
6.4
21.8
36.0
0.003
N/A
23.8
N/A
10.1
7.0
0.3
1.4
2011
83
84
0.37
0.45
14.8
5.3
20.6
34.8
0.003
N/A
17.8
N/A
12.3
6.2
0.3
1.2
2010
88
81
0.35
0.50
14.4
5.7
20.4
32.9
0.004
N/A
16.2
N/A
9.0
5.6
0.4
N/A
2009
89
83
0.40
0.58
14.7
6.0
18.2
31.5
0.004
N/A
21.2
N/A
9.3
6.6
0.3
N/A
2008
100
81
0.45
0.64
16.7
8.2
20.6
31.6
N/A
N/A
N/A
N/A
12.6
6.4
N/A
N/A
2007
92
96
0.44
0.54
16.6
15.2
20.0
32.7
0.009
N/A
N/A
N/A
11.1
5.6
N/A
0.1
2006
100
102
0.46
0.71
18.0
17.0
21.8
31.8
N/A
N/A
N/A
N/A
11.1
6.2
N/A
0.8
2005
95
99
0.68
0.69
18.6
18.2
20.0
30.0
N/A
N/A
N/A
N/A
11.6
6.3
N/A
5.3
2004
98
86
0.63
0.67
18.5
18.1
20.4
31.9
N/A
N/A
N/A
N/A
9.9
N/A
N/A
1.6
2003
87
98
0.73
0.51
20.6
17.3
19.1
30.2
N/A
N/A
N/A
N/A
N/A
N/A
N/A
0.9
2002
78
92
0.65
0.16
19.5
14.5
18.0
31.0
0.006
N/A
N/A
N/A
N/A
N/A
N/A
0.5
2001
75
94
0.61
0.22
18.5
15.0
16.8
30.5
0.008
N/A
N/A
N/A
N/A
N/A
N/A
0.9
2000
65
94
0.66
0.22
18.9
15.1
15.6
29.9
0.009
N/A
N/A
N/A
N/A
N/A
N/A
0.4
Natural disasters
Type
San Jose
Henderson
Tornado activity compared to U.S. average
9%
2.4%
Earthquake activity compared to U.S. average
7,785.3%
5,903.3%
Natural disasters compared to U.S. average
19%
12%
Transportation
In San Jose, the Santa Clara Valley Transportation Authority manages an extensive public transit system including buses and light rail service. However, traffic congestion is a significant issue. On the other hand, Henderson relies heavily on automobile transportation, with public transport services being less extensive. Traffic congestion is lesser compared with San Jose.
Transport
Type
San Jose
Henderson
Amtrak stations
1
0
Amtrak stations nearby
3
1
FAA registered aircraft
553
469
FAA registered aircraft manufacturers and dealers
13
31
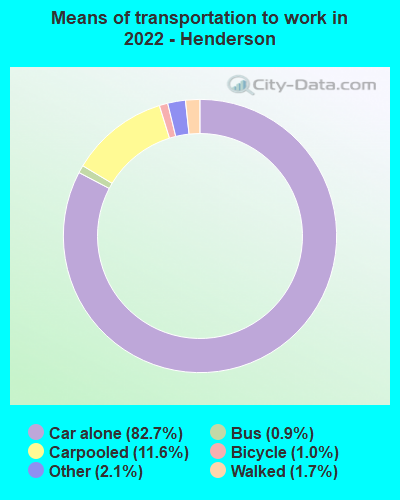
Means of transportation to work
Type
San Jose
Henderson
Bicycle
1%
0.1%
Bus
1.1%
1%
Carpooled
11.4%
12.1%
Car alone
80.5%
82.2%
Motorcycle
0.2%
0.3%
Railroad
0.2%
0%
Subway
0.2%
0%
Walked
3.3%
1.3%
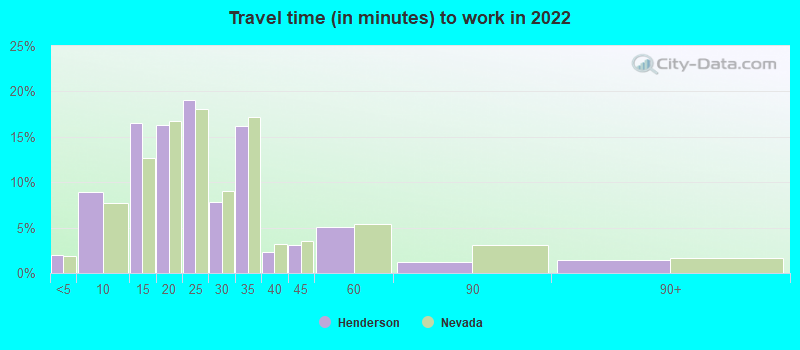
Average travel time to work
Type
San Jose
Henderson
Average
29.2 min
24.1 min
Other means
27.9 min
22.6 min
Public transportation
48.5 min
55 min
Private vehicle occupancy
Type
San Jose
Henderson
Average
1.2
1.1
Drove alone
87.3%
91.8%
In 2 person carpool
8.9%
6.4%
In 3 person carpool
1.9%
0.7%
In 4 person carpool
1.1%
0.6%
In 5-6 person carpool
0.6%
0.4%
In 7+ person carpool
0.2%
0.1%
How many people usually rode to work in the car, truck or van.
Real Estate
San Jose’s real estate market is very competitive, with high home values and rents, providing high appreciation rates for homeowners. The housing market in Henderson is considerably more affordable, but there are fewer high-value properties.
Neighborhoods
San Jose has diverse neighborhoods, each with their unique character. For example, the Rose Garden area is known for its historic homes, while Willow Glen has a suburban charm. Henderson is made of planned communities, like Green Valley and Anthem, which have well-maintained landscapes and excellent recreational facilities.
Houses and residents
Type
San Jose
Henderson
Houses
340,561
132,088
Average household size (people)
3.1
2.5
Median year apartment built
1979
2000
Median year house/condo built
1973
2001
Length of stay in the house since moving in
15.6 years
9.1 years
Houses occupied
322,881 (94.8%)
124,470 (94.2%)
Houses occupied by owners
179,797 (55.7%)
80,562 (64.7%)
Houses occupied by renters
143,084 (44.3%)
43,908 (35.3%)
Median rent asked for vacant for-rent units
$3,214
$1,561
Median monthly housing costs
$2,463
$1,453
Median price asked for vacant for-sale houses and condos
$1,197,016
$213,031
Estimated median house or condo value
Over $1,000,000
$421,300
Median numbers of rooms
4.9
5.5
Median number of rooms in apartments
3.6
4.3
Median number of rooms in houses and condos
6
6.2
Median house price - detached houses
Over $1,000,000
$515,301
Median house price - in 2-unit structures
$753,788
$196,654
Median house price - in 3-to-4-unit structures
$680,453
$349,610
Median house price - in 5 or more unit structures
$688,625
$274,594
Median house price - mobile homes
$240,963
$108,860
Median house price - occupied boats, rvs, vans etc.
$55,872
$12,243
Median house price - Townhouses or other attached units
$892,629
$352,030
Median house price - All housing units
Over $1,000,000
$493,824
Median house age
45
20
Renting percentage
41.5%
34.2%
Housing density (houses/condos per square mile)
1,947.6
1,657.6
House value disparities
21.2%
23.8%
Household income disparities
38.3%
42.4%
Median household income for houses/condes with a mortgage
$197,583
$104,873
Median household income for apartments without a mortgage
$103,711
$77,944
Housing units without a mortgage
2,632 (2.1%)
682 (1.2%)
Housing units with both a second mortgage and home equity loan
13,499 (10.6%)
2,162 (3.8%)
Housing units with a mortgage
124,224 (97.9%)
55,593 (98.8%)
Housing units with a home equity loan
346 (0.3%)
74 (0.1%)
Housing units with a second mortgage
16,249 (12.8%)
3,197 (5.7%)
House/condo owner moved in on average (years ago)
14
6
House/condo renter moved in on average (years ago)
3
1
Housing units lacking complete kitchen facilities
1.2%
1.6%
Housing units lacking complete plumbing facilities
0.6%
0.4%
Housing units in structures
Housing units in structures
San Jose
Henderson
One, detached
50.9%
68.4%
One, attached
11.5%
6.5%
Two
1.1%
0.6%
3 or 4
5.0%
4.2%
5 to 9
5.1%
6.7%
10 to 19
4.5%
5.1%
20 to 49
4.5%
1.9%
50 or more
14.2%
5.0%
Mobile homes
3.1%
1.6%
Boats, RVs, vans, etc.
0.1%
0.1%
Median real estate property taxes paid for housing units
Self-employed workers in own not incorporated business
28,517
9,395
State government workers
10,222
3,866
Unpaid family workers
472
217
Industries and Occupations
In San Jose, most occupations revolve around the tech industry with positions within software development, IT management and electrical engineering. In contrast, Henderson’s largest sector is leisure and hospitality, with jobs concentrated around accommodation, food service and retail trade.
San Jose has several highly rated hospitals, including the Stanford Health Care and Kaiser Permanente San Jose Medical Center. Henderson also offers high-quality health care services with institutions like the Henderson Hospital and the St. Rose Dominican Hospital.
Health (county statistics)
Type
San Jose
Henderson
General health status score of residents in this county from 1 (poor) to 5 (excellent)
San Jose boasts modern infrastructure with tech-enhanced public facilities and efficient transportation systems. However, it also suffers from traffic congestion. Conversely, Henderson boasts well-planned communities, modern public facilities, and less traffic. However, it does not have the advanced tech infrastructure seen in San Jose.
Infrastructure
Type
San Jose
Henderson
Hospitals
20
5
TV stations
9
20
Bank branches located here
145
62
Bank institutions located here
25
12
Main business address for public companies
74
1
Drinking water stations with no reported violations in the past
21
2
Drinking water stations with reported violations in the past
HMDA - Conventional home purchase loans - Applications denied
Year
San Jose
Henderson
1999
3,839
1,031
2000
2,577
15
2001
1,953
14
2002
1,908
26
2003
3,578
1,186
2004
5,489
2,198
2005
6,994
2,995
2006
6,324
2,465
2007
4,298
1,632
2008
2,419
581
2009
1,631
317
Culture and Food
San Jose offers a diverse foodie scene, from farm-to-table dinners to street food. It's also known for its cultural landmarks including museums, art galleries, and a lively music scene. Henderson also boasts a rich food and culture scene, with its luxury resorts, casinos, and restaurants offering fine dining experiences, and events like the Art Festival of Henderson showcasing local culture.
Sports Teams
San Jose is home to the NHL's San Jose Sharks and MLS's San Jose Earthquakes. Henderson doesn't have its own major league teams, however nearby Las Vegas hosts the NHL's Golden Knights and NFL's Las Vegas Raiders.


 San Jose, CA
 Henderson, NV