San Jose, located in Northern California's Silicon Valley, and Fontana, a city in Southern California's San Bernardino County, offer unique living and visiting experiences. Both cities feature unique draws in terms of weather, cost of living, education, economy, and culture. However, they differ greatly in areas such as crime rates, average incomes, property taxes, and sports attractions.
Distance between
San Jose, CA and
Fontana, CA : 332.2 miles
San Jose's population is larger by 367%. Its population has grown by 88,546 people (9.9%) since 2000. The population of Fontana has grown by 81,832 people (63.5%) during that time.
San Jose typically ranks as one of the safer major cities in California, with crime rates significantly below the state's average. However, like any large city, certain areas can be riskier, especially at night. Fontana has a higher crime rate than San Jose but is still lower than the national average. Both cities have responsive police departments and offer neighborhood watch programs.
City-data.com crime index counts serious crimes and violent crime more heavily. It adjusts for the number of visitors and daily workers commuting into cities. (higher means more crime, U.S. average = 301.1)
City-data.com crime index counts serious crimes and violent crime more heavily. It adjusts for the number of visitors and daily workers commuting into cities. (higher means more crime, U.S. average = 301.1)
Sex Offenders
According to our data, there are 1,847 registered sex offenders living in San Jose and 273 registered sex offenders living in . The ratio of residents to sex offenders in San Jose is 555 to 1; the ratio in Fontana is 768 to 1. The number of registered sex offenders compared to the number of residents is larger in San Jose than in Fontana.
Cost of Living
Living in San Jose is significantly more expensive than Fontana. Housing is the main factor for this difference. Everything from groceries to transportation tends to be more costly in San Jose. Fontana, while still pricier than the national average, offers a more affordable option within California.
Income Tax
As they are both in California, there is no difference in the state income tax.
Property Tax
Property tax in both cities are similar, but due to the higher cost of homes, homeowners in San Jose typically pay more in property taxes.
Sales Tax
Both cities have the same state sales tax rate, but San Jose has a higher city sales tax.
Income
Type
San Jose
Fontana
Estimated median household income
$126,377
$93,851
Estimated per capita income
$57,357
$28,677
Cost of living index (U.S. average is 100)
127.4
82.5
If you make $50,000 in Fontana, you will have to make $77,212 in San Jose to maintain the same standard of living.
Geographical Conditions
San Jose is surrounded by rolling hills and is close to the Pacific Coast, offering a balance of city living and nature. Fontana lies inland and is surrounded by the San Bernardino Mountains, providing opportunities for outdoor activities.
San Jose houses several well-rated public and private schools and universities such as San Jose State University. The city's focus on technology makes it a strong base for education on these subjects. Fontana, while having good public schools, doesn't have the same level of educational scope, particularly in higher education.
San Jose's economy is primarily driven by technology and digital industries, with many major tech firms headquartered here. Fontana's economy, on the other hand, is chiefly supported by the trucking industry, manufacturing, and retail. San Jose tends to offer higher paying jobs and has a larger job market compared to Fontana.
Biggest Employers
Major employers in San Jose include Cisco Systems, eBay, and Adobe Systems. Fontana's largest employers are Kaiser Permanente, Fontana Unified School District, and the City of Fontana.
There were 299 building permits issued in San Jose in 2012 (216 more than in 2011) compared to 652 building permits issued in Fontana in 2012 (516 more than in 2011).
In San Jose (Santa Clara County), 70.0% voted for Democrats and 27.1% for Republicans in 2012 Presidential Election. In Fontana (San Bernardino County), 52.3% voted for Democrats and 45.0% for Republicans.
Elections
Type
Democrats
Republicans
Other
Year
San Jose
Fontana
San Jose
Fontana
San Jose
Fontana
2020
72.7%
54.2%
25.2%
43.6%
2.1%
2.2%
2016
72.7%
52.1%
20.6%
41.5%
6.7%
6.4%
2012
70.0%
52.3%
27.1%
45.0%
2.9%
2.6%
2008
69.6%
52.2%
28.6%
45.8%
1.8%
2.0%
2004
64.3%
43.8%
34.8%
55.6%
0.9%
0.6%
2000
60.7%
47.3%
34.4%
48.8%
4.9%
3.9%
1996
56.9%
44.4%
32.2%
43.6%
11.0%
12.1%
Breakdown of population affiliated with a religious congregation
Type
Adherents
Congregations
Religion
San Jose
Fontana
San Jose
Fontana
CATHOLIC CHURCH
25.1%
21.9%
6.0%
4.3%
MUSLIM ESTIMATE
1.1%
0.6%
1.8%
1.1%
SOUTHERN BAPTIST CONVENTION
0.9%
2.2%
7.7%
9.6%
EPISCOPAL CHURCH
0.5%
0.1%
2.3%
1.3%
SEVENTH DAY ADVENTIST CHURCH
0.4%
1.6%
2.6%
4.6%
EVANGELICAL LUTHERAN CHURCH IN AMERICA
0.3%
0.2%
2.3%
1.5%
Weather
San Jose's weather can be described as Mediterranean, with mild, wet winters and warm, dry summers. It enjoys more than 250 sunny days a year. Fontana has a hot-summer Mediterranean climate, with very hot summers and mild winters. It also has a significant amount of sunny days but can be hotter than San Jose, especially during summer.
Weather and climate
Type
San Jose
Fontana
Temperature - Average
60.9°F
65.6°F
Humidity - Average morning or afternoon humidity
77.3%
65.7%
Humidity - Differences between morning and afternoon humidity
35.5%
20.4%
Humidity - Maximum monthly morning or afternoon humidity
87%
72%
Humidity - Minimum monthly morning or afternoon humidity
51.6%
51.6%
Precipitation - Yearly average
16.1 in
22.6 in
Snowfall - Yearly average
0 in
0 in
Clouds - Number of days clear of clouds
27.4%
27.5%
Sunshine amount - Average
73.8%
78.3%
Sunshine amount - Differences during a year
23%
21.7%
Sunshine amount - Maximum monthly
77.4%
84.5%
Sunshine amount - Minimum monthly
54.4%
62.8%
Wind speed - Average
10.3 mph
4.1 mph
Average climate in San Jose, California
Average climate in Fontana, California
Air pollution
Type
AQI
CO
NO2
OZONE
PB
PM10
PM25
SO2
Year
San Jose
Fontana
San Jose
Fontana
San Jose
Fontana
San Jose
Fontana
San Jose
Fontana
Fontana
San Jose
Fontana
San Jose
Fontana
2018
94
153
0.49
0.32
14.5
18.3
22.2
30.5
0.006
0.006
40.7
N/A
12.5
14.0
0.2
0.4
2017
91
152
0.50
0.33
14.6
18.3
23.5
32.4
0.004
0.004
43.5
N/A
10.2
15.1
0.2
0.2
2016
69
140
0.47
0.20
13.7
18.2
22.4
31.8
0.003
0.006
39.6
N/A
8.8
14.8
0.2
0.4
2015
84
148
0.52
0.17
15.4
18.7
22.3
31.5
0.004
0.004
39.2
N/A
9.2
15.7
0.3
0.3
2014
83
149
0.40
0.16
13.9
19.9
21.5
31.1
0.004
0.006
41.8
N/A
8.2
16.7
0.2
0.3
2013
90
148
0.41
0.26
15.2
20.6
20.8
29.5
0.005
0.006
41.0
N/A
12.4
15.7
0.3
0.5
2012
74
148
0.35
0.26
13.3
22.1
21.8
30.6
0.003
0.007
40.4
N/A
10.1
17.3
0.3
0.6
2011
83
150
0.37
0.32
14.8
21.1
20.6
30.9
0.003
0.006
37.7
N/A
12.3
19.3
0.3
0.6
2010
88
147
0.35
0.32
14.4
23.2
20.4
30.4
0.004
0.008
33.3
N/A
9.0
18.1
0.4
1.0
2009
89
153
0.40
0.37
14.7
23.7
18.2
29.2
0.004
0.009
34.9
N/A
9.3
19.2
0.3
0.9
2008
100
163
0.45
0.44
16.7
20.4
20.6
29.7
N/A
0.010
39.3
N/A
12.6
19.0
N/A
1.6
2007
92
136
0.44
0.60
16.6
23.4
20.0
28.2
0.009
0.012
N/A
N/A
11.1
N/A
N/A
1.8
2006
100
126
0.46
0.59
18.0
27.0
21.8
27.7
N/A
0.007
N/A
N/A
11.1
N/A
N/A
1.9
2005
95
134
0.68
0.59
18.6
30.7
20.0
26.5
N/A
0.012
N/A
N/A
11.6
N/A
N/A
2.1
2004
98
143
0.63
0.71
18.5
27.0
20.4
28.1
N/A
0.013
N/A
N/A
9.9
N/A
N/A
1.0
2003
87
143
0.73
0.73
20.6
30.1
19.1
27.5
N/A
0.018
N/A
N/A
N/A
N/A
N/A
0.8
2002
78
140
0.65
0.73
19.5
33.3
18.0
27.2
0.006
0.016
N/A
N/A
N/A
N/A
N/A
1.3
2001
75
143
0.61
0.82
18.5
35.5
16.8
25.8
0.008
0.029
N/A
N/A
N/A
N/A
N/A
1.4
2000
65
155
0.66
0.86
18.9
35.7
15.6
24.5
0.009
0.034
N/A
N/A
N/A
N/A
N/A
2.0
Natural disasters
Type
San Jose
Fontana
Tornado activity compared to U.S. average
9%
17.1%
Earthquake activity compared to U.S. average
7,785.3%
7,438.3%
Natural disasters compared to U.S. average
19%
46%
Transportation
San Jose has excellent public transportation with systems such as VTA, Caltrain, and BART. It also has several highways and expressways. Fontana, by comparison, relies more heavily on car commuting, though it does offer a Metrolink station and buses.
Transport
Type
San Jose
Fontana
Amtrak stations
1
0
Amtrak stations nearby
3
3
FAA registered aircraft
553
36
FAA registered aircraft manufacturers and dealers
13
4
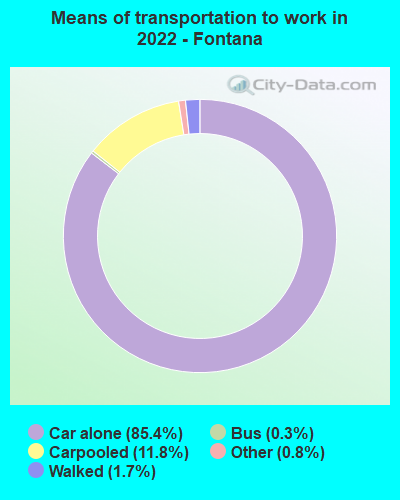
Means of transportation to work
Type
San Jose
Fontana
Bicycle
1%
0.2%
Bus
1.1%
0.4%
Carpooled
11.4%
11.7%
Car alone
80.5%
84.7%
Motorcycle
0.2%
0.1%
Railroad
0.2%
0%
Subway
0.2%
0%
Taxicab
0%
0.1%
Walked
3.3%
1.6%
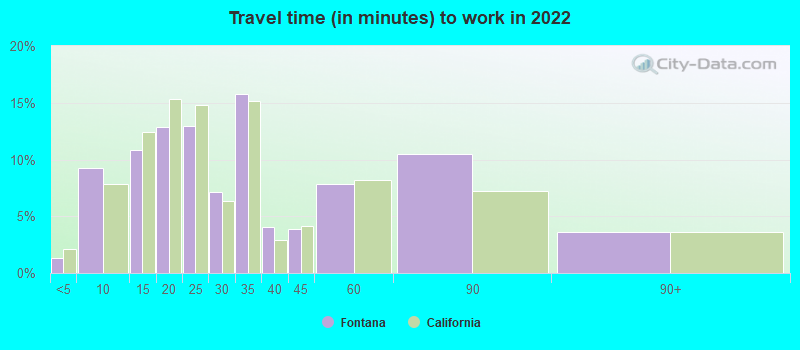
Average travel time to work
Type
San Jose
Fontana
Average
29.2 min
30.3 min
Other means
27.9 min
33.5 min
Public transportation
48.5 min
55.8 min
Private vehicle occupancy
Type
San Jose
Fontana
Average
1.2
1.2
Drove alone
87.3%
86%
In 2 person carpool
8.9%
11.5%
In 3 person carpool
1.9%
1.5%
In 4 person carpool
1.1%
0.6%
In 5-6 person carpool
0.6%
0.3%
In 7+ person carpool
0.2%
0%
How many people usually rode to work in the car, truck or van.
Real Estate
Real estate in San Jose is notably more expensive, with median home prices significantly above the national average. In contrast, real estate in Fontana is more affordable, although still higher than the national average.
Neighborhoods
San Jose offers a diverse range of neighborhoods, from the upscale Willow Glen and Silver Creek to the more affordable East San Jose. Fontana has a mix of well-established and newer neighborhoods like Summit Heights and Sierra Lakes.
Houses and residents
Type
San Jose
Fontana
Houses
340,561
58,533
Average household size (people)
3.1
4
Median year apartment built
1979
1983
Median year house/condo built
1973
1994
Length of stay in the house since moving in
15.6 years
12.1 years
Houses occupied
322,881 (94.8%)
57,836 (98.8%)
Houses occupied by owners
179,797 (55.7%)
39,490 (68.3%)
Houses occupied by renters
143,084 (44.3%)
18,346 (31.7%)
Median rent asked for vacant for-rent units
$3,214
$628.91
Median monthly housing costs
$2,463
$1,832
Median price asked for vacant for-sale houses and condos
$1,197,016
$322,101
Estimated median house or condo value
Over $1,000,000
$511,000
Median numbers of rooms
4.9
5.5
Median number of rooms in apartments
3.6
4.3
Median number of rooms in houses and condos
6
6
Median house price - detached houses
Over $1,000,000
$438,510
Median house price - in 2-unit structures
$753,788
$579,874
Median house price - in 3-to-4-unit structures
$680,453
$426,113
Median house price - in 5 or more unit structures
$688,625
$309,290
Median house price - mobile homes
$240,963
$50,280
Median house price - Townhouses or other attached units
$892,629
$499,707
Median house price - All housing units
Over $1,000,000
$431,552
Median house age
45
32
Renting percentage
41.5%
31.1%
Housing density (houses/condos per square mile)
1,947.6
1,620.6
House value disparities
21.2%
19.3%
Household income disparities
38.3%
36.9%
Median household income for houses/condes with a mortgage
$197,583
$105,783
Median household income for apartments without a mortgage
$103,711
$88,893
Housing units without a mortgage
2,632 (2.1%)
356 (1.1%)
Housing units with both a second mortgage and home equity loan
13,499 (10.6%)
846 (2.6%)
Housing units with a mortgage
124,224 (97.9%)
32,565 (98.9%)
Housing units with a home equity loan
346 (0.3%)
0 (0%)
Housing units with a second mortgage
16,249 (12.8%)
1,037 (3.1%)
House/condo owner moved in on average (years ago)
14
9
House/condo renter moved in on average (years ago)
3
5
Housing units lacking complete kitchen facilities
1.2%
1.1%
Housing units lacking complete plumbing facilities
0.6%
0.6%
Housing units in structures
Housing units in structures
San Jose
Fontana
One, detached
50.9%
78.8%
One, attached
11.5%
3.7%
Two
1.1%
0.1%
3 or 4
5.0%
3.8%
5 to 9
5.1%
1.2%
10 to 19
4.5%
1.4%
20 to 49
4.5%
1.2%
50 or more
14.2%
8.2%
Mobile homes
3.1%
1.7%
Boats, RVs, vans, etc.
0.1%
0.0%
Median real estate property taxes paid for housing units
Self-employed workers in own not incorporated business
28,517
4,423
State government workers
10,222
5,298
Unpaid family workers
472
0
Industries and Occupations
The major industries in San Jose are technology, digital media, and software services. In contrast, Fontana's economy relies on transportation, government, education and health services sectors.
San Jose is home to several top-ranking hospitals, including the Stanford Hospital. Fontana also hosts renowned healthcare facilities like the Kaiser Permanente Fontana Medical Center.
Health (county statistics)
Type
San Jose
Fontana
General health status score of residents in this county from 1 (poor) to 5 (excellent)
The infrastructure in San Jose is highly developed, boasting a large international airport and advanced technology connectivity. Fontana also has good infrastructure, with a strong emphasis on beautification projects and several transportation hubs.
HMDA - Conventional home purchase loans - Applications denied
Year
San Jose
Fontana
1999
3,839
374
2000
2,577
127
2001
1,953
121
2002
1,908
165
2003
3,578
1,211
2004
5,489
1,684
2005
6,994
2,338
2006
6,324
2,779
2007
4,298
1,535
2008
2,419
555
2009
1,631
222
Culture and Food
Culturally, San Jose is known for its diversity, hosting a variety of festivals and events each year. It has a vast culinary scene, notably influenced by its large Vietnamese and Mexican communities. Fontana also has a diverse culture with a strong Latino influence, reflected in its food and festivities.
Sports Teams
San Jose is home to professional sports teams such as the San Jose Sharks (NHL) and the San Jose Earthquakes (MLS). Fontana doesn't host any big league teams, but it is home to the Auto Club Speedway, a major site for NASCAR.


 San Jose, CA
 Fontana, CA