San Jose, California, and Birmingham, Alabama, are two quite different American cities each holding unique charms and potential challenges for residents and tourists alike. From climate variations, economic opportunities, cultural offerings, and cost of living, making a meaningful comparison between such diverse locations entails a deep focus on multiple areas. This comprehensive review may help both potential visitors and would-be relocatees better understand the notable features of each city.
Distance between
San Jose, CA and
Birmingham, AL : 1,979.9 miles
San Jose's population is larger by 398%. Its population has grown by 88,546 people (9.9%) since 2000. The population of Birmingham has decreased by 45,245 people (18.6%) during that time.
The crime rates in Birmingham are relatively high compared to the national average. However, certain neighborhoods in Birmingham show lower crime rates than others, so the feeling of safety can greatly depend on the location within the city. San Jose, while having crime rates above the national average as well, generally reports lower crime than Birmingham.
City-data.com crime index counts serious crimes and violent crime more heavily. It adjusts for the number of visitors and daily workers commuting into cities. (higher means more crime, U.S. average = 301.1)
City-data.com crime index counts serious crimes and violent crime more heavily. It adjusts for the number of visitors and daily workers commuting into cities. (higher means more crime, U.S. average = 301.1)
Sex Offenders
According to our data, there are 1,847 registered sex offenders living in San Jose and 692 registered sex offenders living in . The ratio of residents to sex offenders in San Jose is 555 to 1; the ratio in Birmingham is 307 to 1. The number of registered sex offenders compared to the number of residents is a smaller in San Jose than in Birmingham.
Cost of Living
In terms of cost of living, Birmingham has an advantage. Housing, groceries, and healthcare costs tend to be lower than the national average. San Jose, being part of the Silicon Valley area, exhibits a much higher cost of living, particularly in housing.
Income Tax
California has a progressive income tax that can reach as high as 13.3%, making it one of the highest in the country. Alabama's income tax ranges from 2% to 5%, which is considerably lower than in California.
Property Tax
Property tax rates in California are relatively low in percentage terms, but the high property values in San Jose mean that payments are often high in dollar terms. In contrast, Birmingham has higher tax rates, but lower property values often result in lower payments.
Sales Tax
Sales tax in San Jose is high, at 9.25%, largely due to the high cost of living. In contrast, Birmingham's sales tax is 10%, one of the highest rates in the United States, which can be a surprise to some relocating from elsewhere.
Income
Type
San Jose
Birmingham
Estimated median household income
$126,377
$36,614
Estimated per capita income
$57,357
$27,211
Cost of living index (U.S. average is 100)
127.4
87.1
If you make $50,000 in Birmingham, you will have to make $73,134 in San Jose to maintain the same standard of living.
Geographical Conditions
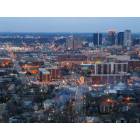
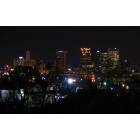
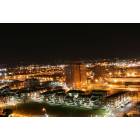
San Jose is bordered by hills and is close to several state parks, offering outdoor enthusiasts plentiful activities. Birmingham, known as "The Magic City," is located in the foothills of the Appalachian Mountains, providing opportunities for hiking, and other outdoor activities.
San Jose is home to many well-regarded universities and colleges, such as San Jose State University and Santa Clara University. In contrast, Birmingham also offers quality education with institutions like the University of Alabama at Birmingham. Both cities have various public and private school options for families with children.
San Jose’s economy benefits from its proximity to Silicon Valley, offering numerous opportunities in the tech industry. On the other hand, Birmingham's economy is more diversified with robust healthcare, finance, and manufacturing sectors.
Biggest Employers
In San Jose, significant employers include major tech companies like Adobe, Cisco Systems, and eBay. Birmingham's largest employers include University of Alabama at Birmingham, Regions Financial Corporation, and Mercedes-Benz U.S. International.
There were 299 building permits issued in San Jose in 2012 (216 more than in 2011) compared to 90 building permits issued in Birmingham in 2012 (31 less than in 2011).
In San Jose (Santa Clara County), 70.0% voted for Democrats and 27.1% for Republicans in 2012 Presidential Election. In Birmingham (Jefferson County), 52.7% voted for Democrats and 46.7% for Republicans.
Elections
Type
Democrats
Republicans
Other
Year
San Jose
Birmingham
San Jose
Birmingham
San Jose
Birmingham
2020
72.7%
55.8%
25.2%
42.6%
2.1%
1.6%
2016
72.7%
51.6%
20.6%
44.3%
6.7%
4.1%
2012
70.0%
52.7%
27.1%
46.7%
2.9%
0.5%
2008
69.6%
52.6%
28.6%
47.4%
1.8%
0.0%
2004
64.3%
45.3%
34.8%
54.3%
0.9%
0.3%
2000
60.7%
47.6%
34.4%
50.8%
4.9%
1.6%
1996
56.9%
46.1%
32.2%
50.2%
11.0%
3.7%
Breakdown of population affiliated with a religious congregation
Type
Adherents
Congregations
Religion
San Jose
Birmingham
San Jose
Birmingham
CATHOLIC CHURCH
25.1%
8.4%
6.0%
2.7%
MUSLIM ESTIMATE
1.1%
0.5%
1.8%
0.6%
SOUTHERN BAPTIST CONVENTION
0.9%
28.2%
7.7%
22.7%
EPISCOPAL CHURCH
0.5%
2.1%
2.3%
1.4%
SEVENTH DAY ADVENTIST CHURCH
0.4%
0.6%
2.6%
1.2%
EVANGELICAL LUTHERAN CHURCH IN AMERICA
0.3%
0.1%
2.3%
0.3%
PRESBYTERIAN CHURCH IN AMERICA
0.0%
1.4%
0.8%
1.1%
Weather
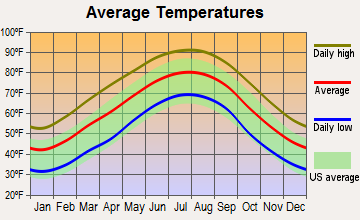
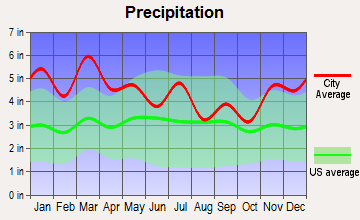
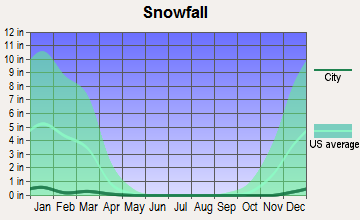
Birmingham offers a temperate climate with hot summers and mild winters. It also experiences more rainfall than the national average, which can be appealing for those that enjoy a lush, green environment. San Jose benefits from the Mediterranean climate typical to California, with mild, wet winters and hot, dry summers, and has more sunshine hours a year compared to Birmingham.
Weather and climate
Type
San Jose
Birmingham
Temperature - Average
60.9°F
62.1°F
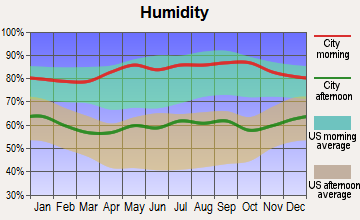
Humidity - Average morning or afternoon humidity
77.3%
75.5%
Humidity - Differences between morning and afternoon humidity
35.5%
38%
Humidity - Maximum monthly morning or afternoon humidity
87%
88%
Humidity - Minimum monthly morning or afternoon humidity
51.6%
50%
Precipitation - Yearly average
16.1 in
53.2 in
Snowfall - Yearly average
0 in
3.4 in
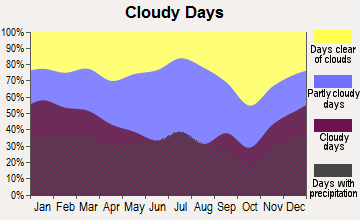
Clouds - Number of days clear of clouds
27.4%
16.4%
Sunshine amount - Average
73.8%
63.4%
Sunshine amount - Differences during a year
23%
21%
Sunshine amount - Maximum monthly
77.4%
67%
Sunshine amount - Minimum monthly
54.4%
46%
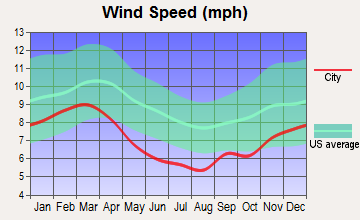
Wind speed - Average
10.3 mph
6.7 mph
Average climate in San Jose, California
Average climate in Birmingham, Alabama
Air pollution
Type
AQI
CO
NO2
OZONE
PB
PM10
PM25
SO2
Year
San Jose
Birmingham
San Jose
Birmingham
San Jose
Birmingham
San Jose
Birmingham
San Jose
Birmingham
San Jose
Birmingham
San Jose
Birmingham
2018
94
83
0.49
0.29
14.5
9.6
22.2
26.2
0.006
N/A
18.9
N/A
12.5
10.5
0.2
2.3
2017
91
91
0.50
0.35
14.6
10.0
23.5
24.2
0.004
N/A
18.9
N/A
10.2
11.0
0.2
2.7
2016
69
87
0.47
0.34
13.7
12.1
22.4
27.6
0.003
N/A
19.7
N/A
8.8
10.4
0.2
1.1
2015
84
84
0.52
0.33
15.4
10.9
22.3
24.5
0.004
N/A
19.3
N/A
9.2
10.6
0.3
1.1
2014
83
84
0.40
0.29
13.9
11.7
21.5
24.1
0.004
N/A
21.3
N/A
8.2
11.4
0.2
1.1
2013
90
82
0.41
0.22
15.2
N/A
20.8
21.4
0.005
N/A
19.2
N/A
12.4
10.9
0.3
1.2
2012
74
92
0.35
0.28
13.3
N/A
21.8
24.4
0.003
N/A
21.8
N/A
10.1
11.5
0.3
1.6
2011
83
104
0.37
0.33
14.8
N/A
20.6
24.9
0.003
N/A
24.3
N/A
12.3
13.0
0.3
1.9
2010
88
101
0.35
0.24
14.4
N/A
20.4
24.1
0.004
N/A
25.6
N/A
9.0
12.9
0.4
N/A
2009
89
94
0.40
0.51
14.7
N/A
18.2
21.5
0.004
N/A
25.1
N/A
9.3
12.5
0.3
N/A
2008
100
105
0.45
0.72
16.7
N/A
20.6
23.9
N/A
N/A
32.2
N/A
12.6
15.2
N/A
N/A
2007
92
124
0.44
0.82
16.6
N/A
20.0
24.6
0.009
N/A
41.6
N/A
11.1
17.5
N/A
N/A
2006
100
131
0.46
1.16
18.0
N/A
21.8
24.0
N/A
N/A
33.2
N/A
11.1
18.0
N/A
N/A
2005
95
131
0.68
0.95
18.6
N/A
20.0
21.8
N/A
N/A
38.0
N/A
11.6
18.4
N/A
N/A
2004
98
116
0.63
0.68
18.5
N/A
20.4
19.1
N/A
N/A
39.7
N/A
9.9
17.1
N/A
N/A
2003
87
123
0.73
0.53
20.6
N/A
19.1
18.2
N/A
N/A
42.1
N/A
N/A
16.1
N/A
N/A
2002
78
133
0.65
0.70
19.5
N/A
18.0
21.2
0.006
N/A
37.1
N/A
N/A
17.2
N/A
N/A
2001
75
175
0.61
1.69
18.5
N/A
16.8
19.6
0.008
N/A
32.3
N/A
N/A
N/A
N/A
N/A
2000
65
136
0.66
1.35
18.9
N/A
15.6
23.3
0.009
N/A
38.3
N/A
N/A
N/A
N/A
N/A
Natural disasters
Type
San Jose
Birmingham
Tornado activity compared to U.S. average
9%
252.3%
Earthquake activity compared to U.S. average
7,785.3%
229.7%
Natural disasters compared to U.S. average
19%
32%
Transportation
San Jose boasts an effective public transit system making use of buses, light rail, and bike paths, while also having access to Bay Area Rapid Transit (BART) and Caltrain for commuting to nearby cities. Birmingham has limited public transit options, with commuting typically necessitating a personal vehicle.
Transport
Type
San Jose
Birmingham
Amtrak stations
1
1
Amtrak stations nearby
3
1
FAA registered aircraft
553
358
FAA registered aircraft manufacturers and dealers
13
4
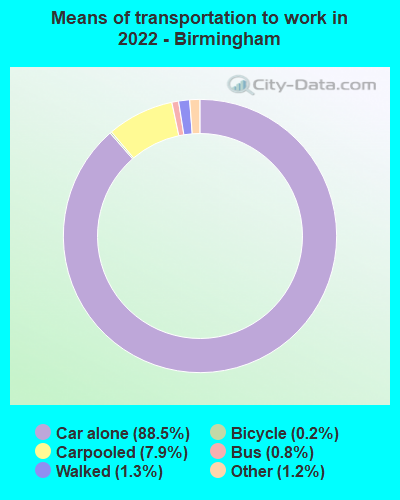
Means of transportation to work
Type
San Jose
Birmingham
Bicycle
1%
0.2%
Bus
1.1%
0.4%
Carpooled
11.4%
7.4%
Car alone
80.5%
89.4%
Motorcycle
0.2%
0.1%
Railroad
0.2%
0%
Subway
0.2%
0%
Taxicab
0%
0.2%
Walked
3.3%
1.1%
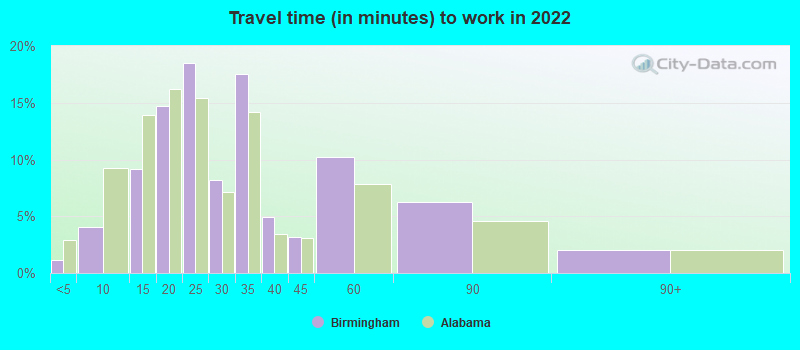
Average travel time to work
Type
San Jose
Birmingham
Average
29.2 min
29.2 min
Other means
27.9 min
22.9 min
Public transportation
48.5 min
47 min
Private vehicle occupancy
Type
San Jose
Birmingham
Average
1.2
1.2
Drove alone
87.3%
90.6%
In 2 person carpool
8.9%
7.4%
In 3 person carpool
1.9%
0.5%
In 4 person carpool
1.1%
0.6%
In 5-6 person carpool
0.6%
0.3%
In 7+ person carpool
0.2%
0.6%
How many people usually rode to work in the car, truck or van.
Real Estate
Real estate prices in San Jose are significantly higher compared to Birmingham due to demand and limited availability. In Birmingham, real estate prices are relatively affordable, offering potential homebuyers a good market to invest in.
Neighborhoods
San Jose offers diverse neighborhoods from the bustling Downtown to the picturesque Willow Glen. Birmingham, too, offers a variety of neighborhoods, including the suburb-style living in Hoover or the historic beauty of Highland Park.
Houses and residents
Type
San Jose
Birmingham
Houses
340,561
108,533
Average household size (people)
3.1
2.3
Median year apartment built
1979
1973
Median year house/condo built
1973
1959
Length of stay in the house since moving in
15.6 years
17.5 years
Houses occupied
322,881 (94.8%)
87,570 (80.7%)
Houses occupied by owners
179,797 (55.7%)
40,665 (46.4%)
Houses occupied by renters
143,084 (44.3%)
46,905 (53.6%)
Median rent asked for vacant for-rent units
$3,214
$620.56
Median monthly housing costs
$2,463
$820
Median price asked for vacant for-sale houses and condos
$1,197,016
$51,535
Estimated median house or condo value
Over $1,000,000
$117,600
Median numbers of rooms
4.9
5.2
Median number of rooms in apartments
3.6
4.5
Median number of rooms in houses and condos
6
6.2
Median house price - detached houses
Over $1,000,000
$178,184
Median house price - in 2-unit structures
$753,788
$97,076
Median house price - in 3-to-4-unit structures
$680,453
$231,741
Median house price - in 5 or more unit structures
$688,625
$220,662
Median house price - mobile homes
$240,963
$47,467
Median house price - Townhouses or other attached units
$892,629
$189,730
Median house price - All housing units
Over $1,000,000
$184,367
Median house age
45
57
Renting percentage
41.5%
50.7%
Housing density (houses/condos per square mile)
1,947.6
724
House value disparities
21.2%
42.2%
Household income disparities
38.3%
50.2%
Median household income for houses/condes with a mortgage
$197,583
$63,812
Median household income for apartments without a mortgage
$103,711
$42,701
Housing units without a mortgage
2,632 (2.1%)
652 (3.2%)
Housing units with both a second mortgage and home equity loan
13,499 (10.6%)
837 (4%)
Housing units with a mortgage
124,224 (97.9%)
20,029 (96.8%)
Housing units with a home equity loan
346 (0.3%)
0 (0%)
Housing units with a second mortgage
16,249 (12.8%)
1,439 (7%)
House/condo owner moved in on average (years ago)
14
18
House/condo renter moved in on average (years ago)
3
1
Housing units lacking complete kitchen facilities
1.2%
5.3%
Housing units lacking complete plumbing facilities
0.6%
4.4%
Housing units in structures
Housing units in structures
San Jose
Birmingham
One, detached
50.9%
59.4%
One, attached
11.5%
2.1%
Two
1.1%
1.8%
3 or 4
5.0%
6.3%
5 to 9
5.1%
9.3%
10 to 19
4.5%
8.0%
20 to 49
4.5%
6.3%
50 or more
14.2%
6.1%
Mobile homes
3.1%
0.7%
Boats, RVs, vans, etc.
0.1%
0.0%
Median real estate property taxes paid for housing units
Self-employed workers in own not incorporated business
28,517
4,375
State government workers
10,222
5,819
Unpaid family workers
472
158
Industries and Occupations
San Jose is a hub for technology and software services, making it ideal for professionals in these fields. Birmingham, meanwhile, is known for its healthcare, banking, and automotive manufacturing sectors, making it an excellent choice for professionals in these industries.
San Jose residents have access to several high-quality health centers including Stanford Hospital and Kaiser Permanente. Birmingham is home to the highly regarded University of Alabama at Birmingham Hospital, a leading research and teaching health center.
Health (county statistics)
Type
San Jose
Birmingham
General health status score of residents in this county from 1 (poor) to 5 (excellent)
The infrastructure in San Jose is modern and continually developing, partly due to the city's tech-hub status. Birmingham's infrastructure is older but the city has experienced significant improvements in recent years, including renovations and advancements in the metropolitan area.
Infrastructure
Type
San Jose
Birmingham
Hospitals
20
34
TV stations
9
17
Arenas or stadiums
2
5
Bank branches located here
145
124
Bank institutions located here
25
24
Main business address for public companies
74
31
Drinking water stations with no reported violations in the past
21
0
Drinking water stations with reported violations in the past
HMDA - Conventional home purchase loans - Applications denied
Year
San Jose
Birmingham
1999
3,839
834
2000
2,577
835
2001
1,953
699
2002
1,908
548
2003
3,578
670
2004
5,489
928
2005
6,994
1,149
2006
6,324
1,235
2007
4,298
914
2008
2,419
426
2009
1,631
141
Culture and Food
San Jose offers a vibrant and diverse food and cultural scene, with a focus on Mexican, Vietnamese, and other multicultural cuisines. Birmingham boasts a strong Southern food tradition and a cultural scene enriched by Jazz music and Civil Rights history.
Sports Teams
San Jose residents have access to a wide range of professional sports including the San Jose Sharks (NHL) and the San Francisco 49ers (NFL) located nearby. Birmingham doesn't have any major league sports teams, but college football is very popular, primarily the University of Alabama and Auburn games.


 San Jose, CA
 Birmingham, AL