San Francisco, CA and Virginia Beach, VA are two diverse cities with their unique set of characteristics. San Francisco's tech-centric hub contrasts with the defense and tourism-oriented economy of Virginia Beach. The former, with its dynamic, urban lifestyle and higher cost of living, stands in contrast to the more relaxed, suburban atmospheres of the latter. Both cities offer rich culture and outdoor activities, with San Francisco known for its Victorian houses, scenic views, and heritage; Virginia Beach is famous for its beautiful shorelines and naval bases.
Distance between
San Francisco, CA and
Virginia Beach, VA : 2,521.7 miles
San Francisco's population is larger by 78%. Its population has grown by 38,468 people (5.0%) since 2000. The population of Virginia Beach has grown by 32,415 people (7.6%) during that time.
According to the FBI's crime report, San Francisco experiences higher crime rates than Virginia Beach. For residents or tourists who prioritize safety, Virginia Beach, with its lower crime rate, is a much safer city to visit or live in. However, like any urban area, both cities have neighborhoods with different safety levels. Proper research and local information can greatly enhance one's safety.
City-data.com crime index counts serious crimes and violent crime more heavily. It adjusts for the number of visitors and daily workers commuting into cities. (higher means more crime, U.S. average = 301.1)
City-data.com crime index counts serious crimes and violent crime more heavily. It adjusts for the number of visitors and daily workers commuting into cities. (higher means more crime, U.S. average = 301.1)
Sex Offenders
According to our data, there are 830 registered sex offenders living in San Francisco and 685 registered sex offenders living in . The ratio of residents to sex offenders in San Francisco is 1,049 to 1; the ratio in Virginia Beach is 661 to 1. The number of registered sex offenders compared to the number of residents is a smaller in San Francisco than in Virginia Beach.
Cost of Living
The cost of living in San Francisco is significantly higher than in Virginia Beach. Housing is notably expensive in San Francisco due to its booming tech industry and limited space. The cost of groceries, health care, and transportation are also higher compared to Virginia Beach.
Income Tax
Again, California has higher income tax rates, with a progressive tax system including 9 income brackets ranging from 1% to 13.3%. Virginia's income tax rates are lower, with a top rate of 5.75%.
Property Tax
Property taxes are lower in Virginia Beach than in San Francisco. This difference is due to lower property values and the tax rates set by the respective counties.
Sales Tax
California has a higher sales tax than Virginia. While the state tax in California is 7.25%, San Francisco levies an additional 1.25%, making the total sales tax 8.5%. Virginia’s sales tax is only 5.3%, plus the 1% local tax, making it lower at 6.3%.
Income
Type
San Francisco
Virginia Beach
Estimated median household income
$121,826
$81,634
Estimated per capita income
$80,383
$42,498
Cost of living index (U.S. average is 100)
141.1
97
If you make $50,000 in Virginia Beach, you will have to make $72,732 in San Francisco to maintain the same standard of living.
Geographical Conditions
San Francisco is known for its hills, bay, and seismic activity. Virginia Beach, with its beach and river inlets, is flatter and less prone to natural disasters.
Both cities have good schools and universities. San Francisco is home to several prestigious universities such as the University of San Francisco and San Francisco State University. Virginia Beach, meanwhile, benefits from the strong education system in Virginia, one of the best in the country. It is home to one of the top-ranked public high schools in the state.
San Francisco's economy is driven by technology, tourism, and finance, making it a place of opportunity for tech professionals and entrepreneurs. On the other hand, Virginia Beach's economy is centered around military, public sector jobs, tourism, and agribusiness. Both offer diverse job opportunities, depending on your field of interest.
Biggest Employers
Some of the biggest employers in San Francisco include Salesforce, Uber, and Wells Fargo. In Virginia Beach, the Department of Defense and Virginia Beach City Public Schools top the list of biggest employers.
There were 33 building permits issued in San Francisco in 2012 (2 more than in 2011) compared to 335 building permits issued in Virginia Beach in 2012 (200 less than in 2011).
In San Francisco (San Francisco County), 83.5% voted for Democrats and 13.0% for Republicans in 2012 Presidential Election. In Virginia Beach (Virginia Beach city), 48.1% voted for Democrats and 50.7% for Republicans.
Elections
Type
Democrats
Republicans
Other
Year
San Francisco
Virginia Beach
San Francisco
Virginia Beach
San Francisco
Virginia Beach
2020
85.3%
51.6%
12.7%
46.2%
2.0%
2.2%
2016
84.6%
44.8%
9.2%
48.4%
6.2%
6.8%
2012
83.5%
48.1%
13.0%
50.7%
3.4%
1.2%
2008
84.4%
49.3%
13.7%
50.1%
2.0%
0.6%
2004
83.0%
40.4%
15.2%
59.3%
1.8%
0.4%
2000
75.7%
41.8%
16.1%
56.1%
8.1%
2.1%
1996
72.2%
41.4%
15.7%
50.6%
12.1%
8.0%
Breakdown of population affiliated with a religious congregation
Type
Adherents
Congregations
Religion
San Francisco
Virginia Beach
San Francisco
Virginia Beach
CATHOLIC CHURCH
15.0%
10.7%
9.6%
4.2%
EPISCOPAL CHURCH
0.8%
1.4%
3.5%
4.2%
MUSLIM ESTIMATE
0.8%
0.8%
1.2%
0.4%
SOUTHERN BAPTIST CONVENTION
0.7%
4.9%
8.4%
13.6%
AMERICAN BAPTIST CHURCHES IN THE USA
0.6%
0.4%
2.5%
0.4%
EVANGELICAL LUTHERAN CHURCH IN AMERICA
0.2%
0.4%
1.7%
1.5%
Weather
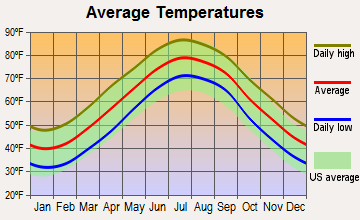
San Francisco is known for its cool summers and mild winters, thanks to its maritime Mediterranean climate. The weather can be unpredictable with frequent fog. Virginia Beach, on the other hand, has a humid subtropical climate, with hot humid summers and mild to cool winters. Beachgoers might prefer the more consistently warm summers of Virginia Beach.
Weather and climate
Type
San Francisco
Virginia Beach
Temperature - Average
58.3°F
59.7°F
Humidity - Average morning or afternoon humidity
84.3%
73%
Humidity - Differences between morning and afternoon humidity
29%
32%
Humidity - Maximum monthly morning or afternoon humidity
91%
83%
Humidity - Minimum monthly morning or afternoon humidity
62%
51%
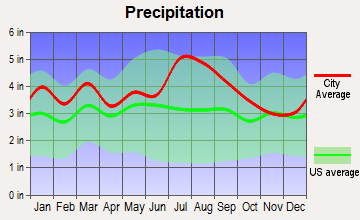
Precipitation - Yearly average
22.2 in
45.9 in
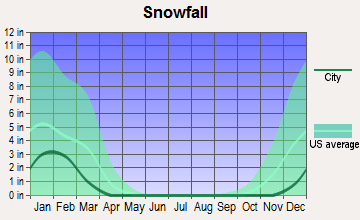
Snowfall - Yearly average
0 in
15.4 in
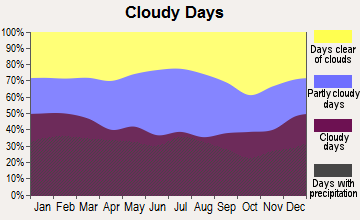
Clouds - Number of days clear of clouds
26.8%
17.6%
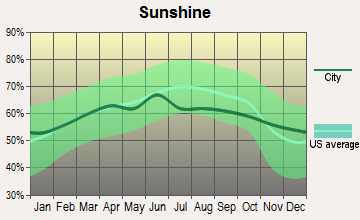
Sunshine amount - Average
73%
66.8%
Sunshine amount - Differences during a year
22%
14%
Sunshine amount - Maximum monthly
77%
67%
Sunshine amount - Minimum monthly
55%
53%
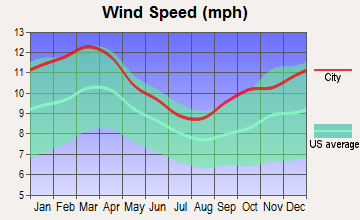
Wind speed - Average
11.4 mph
10.4 mph
Average climate in San Francisco, California
Average climate in Virginia Beach, Virginia
Air pollution
Type
AQI
CO
NO2
OZONE
PB
PM25
SO2
Year
San Francisco
Virginia Beach
San Francisco
Virginia Beach
San Francisco
Virginia Beach
San Francisco
Virginia Beach
San Francisco
Virginia Beach
San Francisco
Virginia Beach
San Francisco
Virginia Beach
2018
104
57
0.35
0.27
11.3
6.3
23.4
31.3
0.012
0.002
11.9
6.1
0.4
0.4
2017
96
60
0.40
0.22
11.4
6.8
22.5
33.2
0.008
0.002
9.9
6.9
0.6
0.3
2016
68
66
0.39
0.21
10.6
6.5
22.4
31.7
0.005
0.002
7.9
6.1
0.8
0.4
2015
85
57
0.41
0.27
12.1
7.3
22.5
33.8
0.004
0.002
7.9
6.4
0.8
0.5
2014
85
59
0.38
0.27
12.1
7.5
21.8
33.8
0.005
0.002
7.7
6.8
0.6
1.1
2013
88
66
0.40
0.28
13.9
7.1
20.4
31.2
0.004
0.002
10.2
6.8
0.5
1.1
2012
75
76
0.40
0.29
12.8
7.8
22.7
34.6
0.003
0.002
8.2
8.1
1.1
1.1
2011
86
66
0.24
0.27
14.1
9.2
21.3
35.1
0.003
0.003
9.5
8.8
1.7
1.7
2010
84
71
0.21
0.25
13.4
4.8
22.0
38.4
0.004
0.004
10.6
N/A
1.0
2.2
2009
95
51
0.30
0.25
15.1
9.7
20.4
31.5
0.005
0.012
12.8
N/A
1.1
2.6
2008
94
77
0.43
0.23
15.6
10.3
21.7
36.2
0.007
0.004
11.7
N/A
0.9
3.3
2007
84
81
0.45
0.18
15.6
12.2
20.5
36.3
0.007
0.004
8.9
N/A
1.2
4.3
2006
86
62
0.52
0.32
16.1
N/A
21.5
36.2
N/A
0.004
8.7
N/A
1.6
3.4
2005
89
67
0.39
0.28
14.8
N/A
20.5
35.4
N/A
N/A
8.8
N/A
1.3
3.4
2004
93
80
0.44
0.30
16.1
15.9
20.9
33.3
0.004
N/A
11.2
N/A
2.5
4.3
2003
65
84
0.64
0.34
18.4
16.2
19.7
34.3
N/A
N/A
N/A
N/A
1.7
3.9
2002
62
99
0.69
0.40
18.6
17.8
19.6
38.0
0.008
N/A
N/A
N/A
1.4
5.9
2001
64
92
0.72
0.42
19.2
18.2
19.0
36.3
0.008
N/A
N/A
N/A
1.4
6.0
2000
60
85
0.71
0.44
20.3
15.7
17.1
36.5
0.017
N/A
N/A
N/A
2.0
6.5
Natural disasters
Type
San Francisco
Virginia Beach
Tornado activity compared to U.S. average
7.7%
61.5%
Earthquake activity compared to U.S. average
7,468.1%
35.2%
Natural disasters compared to U.S. average
6%
0%
Transportation
San Francisco has one of the best public transportation networks in the countr with its MUNI buses, light rail and the iconic cable cars. For more, there is BART system. Virginia Beach, in contrast, is a more car-dependent city, however there is a good bus service covering most of the city.
Transport
Type
San Francisco
Virginia Beach
Amtrak stations
4
1
Amtrak stations nearby
3
2
FAA registered aircraft
453
374
FAA registered aircraft manufacturers and dealers
9
4
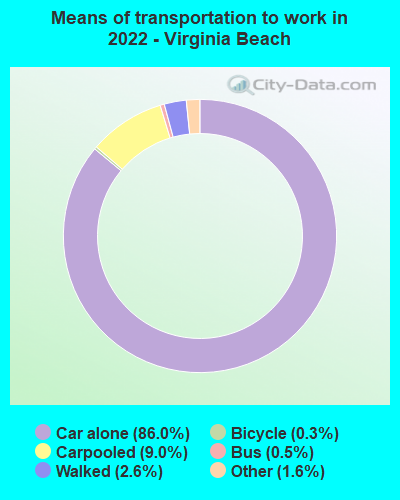
Means of transportation to work
Type
San Francisco
Virginia Beach
Bicycle
2.7%
0.2%
Bus
11.4%
1%
Carpooled
9.1%
9.5%
Car alone
53.9%
84.2%
Ferryboat
0.4%
0%
Motorcycle
0.9%
0.1%
Railroad
0.7%
0%
Streetcar
7.9%
0%
Subway
1.6%
0%
Taxicab
0.4%
0%
Walked
8.3%
3.2%
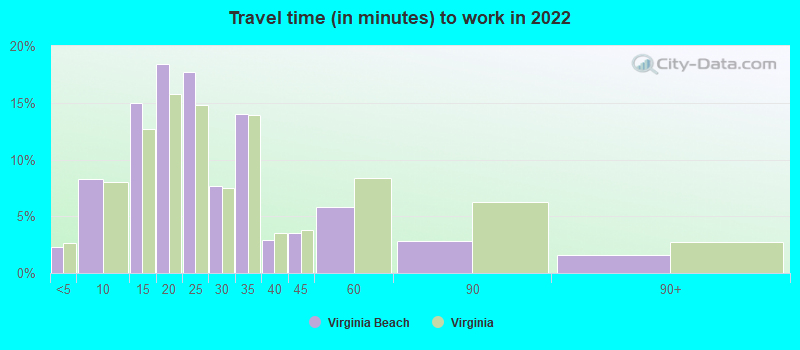
Average travel time to work
Type
San Francisco
Virginia Beach
Average
38 min
24.8 min
Other means
28.3 min
23.7 min
Public transportation
39.7 min
41.9 min
Private vehicle occupancy
Type
San Francisco
Virginia Beach
Average
1.2
1.1
Drove alone
85.5%
90.3%
In 2 person carpool
10.1%
8%
In 3 person carpool
3.2%
1.3%
In 4 person carpool
0.9%
0.2%
In 5-6 person carpool
0.2%
0.1%
In 7+ person carpool
0.1%
0%
How many people usually rode to work in the car, truck or van.
Real Estate
Real estate in San Francisco is among the most expensive in the US, which affects both the cost of living and business operations. Virginia Beach's real estate is much more affordable, making it more attractive for families and retirees.
Neighborhoods
San Francisco is famous for its eclectic neighborhoods, each with its unique charm, from busy Chinatown and upscale Pacific Heights to hip Mission District. Virginia Beach neighborhoods range from beachfront communities to suburban oases, offering a slower pace of life.
Houses and residents
Type
San Francisco
Virginia Beach
Houses
412,269
190,981
Average household size (people)
2.3
2.6
Median year apartment built
1953
1988
Median year house/condo built
1942
1983
Length of stay in the house since moving in
16.3 years
13.5 years
Houses occupied
350,796 (85.1%)
182,775 (95.7%)
Houses occupied by owners
140,809 (40.1%)
119,144 (65.2%)
Houses occupied by renters
209,987 (59.9%)
63,631 (34.8%)
Median rent asked for vacant for-rent units
$3,809
$1,833
Median monthly housing costs
$2,337
$1,490
Median price asked for vacant for-sale houses and condos
$1,670,841
$508,833
Estimated median house or condo value
Over $1,000,000
$328,500
Median numbers of rooms
3.9
6
Median number of rooms in apartments
3.2
4.6
Median number of rooms in houses and condos
5.6
7
Median house price - detached houses
Over $1,000,000
$459,164
Median house price - in 2-unit structures
Over $1,000,000
$200,674
Median house price - in 3-to-4-unit structures
Over $1,000,000
$279,464
Median house price - in 5 or more unit structures
Over $1,000,000
$229,647
Median house price - mobile homes
$517,939
$143,239
Median house price - Townhouses or other attached units
Over $1,000,000
$261,878
Median house price - All housing units
Over $1,000,000
$401,957
Median house age
76
36
Renting percentage
64.2%
34.7%
Housing density (houses/condos per square mile)
8,829.1
769.2
House value disparities
18.7%
29%
Household income disparities
41.7%
40.6%
Median household income for houses/condes with a mortgage
$210,544
$104,941
Median household income for apartments without a mortgage
$99,969
$82,507
Housing units without a mortgage
1,778 (1.9%)
2,373 (2.6%)
Housing units with both a second mortgage and home equity loan
7,687 (8.3%)
9,070 (10%)
Housing units with a mortgage
91,236 (98.1%)
88,748 (97.4%)
Housing units with a home equity loan
471 (0.5%)
287 (0.3%)
Housing units with a second mortgage
9,395 (10.1%)
10,952 (12%)
House/condo owner moved in on average (years ago)
14
10
House/condo renter moved in on average (years ago)
4
1
Housing units lacking complete kitchen facilities
4.7%
1%
Housing units lacking complete plumbing facilities
2.7%
0.4%
Housing units in structures
Housing units in structures
San Francisco
Virginia Beach
One, detached
19.1%
53.2%
One, attached
12.1%
18.3%
Two
9.0%
1.7%
3 or 4
11.4%
4.6%
5 to 9
9.0%
9.0%
10 to 19
9.3%
4.5%
20 to 49
11.3%
2.1%
50 or more
18.7%
5.4%
Mobile homes
0.1%
1.1%
Median real estate property taxes paid for housing units
Self-employed workers in own not incorporated business
30,288
9,992
State government workers
22,691
6,577
Unpaid family workers
399
251
Industries and Occupations
San Francisco’s main industries include tech, healthcare, and finance, offering a range of high-paying jobs. Virginia Beach’s economy is led by defense and military, tourism, and agriculture, which shape the city’s employment landscape.
Both cities have an assortment of world-class healthcare facilities, but they differ in cost. San Francisco’s healthcare cost is above the national average, while Virginia Beach’s costs are lower.
Health (county statistics)
Type
San Francisco
Virginia Beach
General health status score of residents in this county from 1 (poor) to 5 (excellent)
San Francisco is characterized by its steep hills, extensive public transit system, and iconic landmarks such as the Golden Gate Bridge. Virginia Beach's infrastructure, though less iconic, is well maintained and offers a more laid-back beach town setting.
Infrastructure
Type
San Francisco
Virginia Beach
Hospitals
16
7
TV stations
18
24
Bank branches located here
281
96
Bank institutions located here
52
16
Main business address for public companies
68
2
Drinking water stations with no reported violations in the past
5
6
Drinking water stations with reported violations in the past
HMDA - Conventional home purchase loans - Applications denied
Year
San Francisco
Virginia Beach
1999
1,402
0
2000
1,000
0
2001
733
0
2002
870
0
2003
1,576
941
2004
2,147
1,388
2005
2,344
1,545
2006
2,511
1,502
2007
2,117
1,073
2008
1,575
340
2009
952
167
Culture and Food
San Francisco has a vibrant cultural scene marked by a plethora of food cuisines, world-class museums, music festivals, and diverse communities. Virginia Beach also offers a vibrant cultural experience with its seafood, yearly festivals, and history.
Sports Teams
San Francisco is home to a number of successful sports teams, including the 49ers (NFL), Giants (MLB), and the Warriors (NBA). On the other hand, Virginia Beach does not have any major league professional teams, however, it is a short drive to cities that do.


 San Francisco, CA
 Virginia Beach, VA