While both San Francisco and Stockton are cities in California, they offer quite different living experiences. San Francisco, a globally-renowned urban hub hosts a vibrant economy, and diverse cultural scene, at significantly higher living costs. In contrast, Stockton provides a more affordable cost of living, with noticeable challenges in certain areas like crime rates and education, but also with its own unique cultural warmth and economic potential.
Distance between
San Francisco, CA and
Stockton, CA : 63.8 miles
San Francisco's population is larger by 153%. Its population has grown by 38,468 people (5.0%) since 2000. The population of Stockton has grown by 78,349 people (32.1%) during that time.
Unfortunately, both San Francisco and Stockton have significant crime rates to consider. San Francisco struggles with property and auto theft, mostly associated with its high tourist influx and dense population, but violent crimes can also occur. Stockton's crime rate is higher than the national average, especially for violent crimes, although initiatives are being taken to improve safety. Tourists in both cities are advised to maintain awareness of their surroundings.
City-data.com crime index counts serious crimes and violent crime more heavily. It adjusts for the number of visitors and daily workers commuting into cities. (higher means more crime, U.S. average = 301.1)
City-data.com crime index counts serious crimes and violent crime more heavily. It adjusts for the number of visitors and daily workers commuting into cities. (higher means more crime, U.S. average = 301.1)
Sex Offenders
According to our data, there are 830 registered sex offenders living in San Francisco and 1,026 registered sex offenders living in . The ratio of residents to sex offenders in San Francisco is 1,049 to 1; the ratio in Stockton is 299 to 1. The number of registered sex offenders compared to the number of residents is a lot smaller in San Francisco than in Stockton.
Cost of Living
San Francisco is one of the most expensive US cities to live in, reflecting in housing, food, transport, and utility costs. Stockton is considerably cheaper, offering more affordable housing, and overall lower living costs. Persons considering relocation need to take into consideration salary scales versus living costs in each city.
Income Tax
California has a progressive income tax system applicable to residents of both cities. It ranges from 1% to 13.3%, based on income level, making it one of the highest in the US.
Property Tax
Property taxes in California are administered at the county level and are generally 1% of the property's market value. However, due to San Francisco's significantly higher property values, expect to pay more in real dollars than in Stockton.
Sales Tax
Both cities are affected by California's 7.25% base sales tax rate. However, local additions make San Francisco's total sales tax 8.5% and Stockton's 9.0%. Notably, groceries and prescription medications are exempt from sales tax in both cities.
Income
Type
San Francisco
Stockton
Estimated median household income
$121,826
$69,844
Estimated per capita income
$80,383
$26,811
Cost of living index (U.S. average is 100)
141.1
99.1
If you make $50,000 in Stockton, you will have to make $71,191 in San Francisco to maintain the same standard of living.
Geographical Conditions
San Francisco's hilly terrain offers breathtaking views, but it poses challenges for construction and traffic. The coastline is marked by the iconic Golden Gate Bridge. Stockton has a flat topography, located on the San Joaquin River with an inland seaport.
San Francisco boasts high-rated public and private schools, and world-renowned colleges such as the University of San Francisco and San Francisco State University. Stockton's educational attainment is below the national average, but the city is home to the University of the Pacific and several community colleges.
San Francisco's economy is strong, driven by sectors like technology, finance, and tourism. Stockton's economy heavily relies on agriculture, but is progressively diversifying into health care and education. Job availability and wages are higher in San Francisco, but the competition is also greater.
Biggest Employers
San Francisco's large employers include Salesforce, Uber, and Wells Fargo. In Stockton, St. Joseph's Medical Center, Stockton Unified School District and the County of San Joaquin provide many jobs. The considerably different industries present in each city factor into their overall job market and unemployment rates.
There were 33 building permits issued in San Francisco in 2012 (2 more than in 2011) compared to 548 building permits issued in Stockton in 2012 (421 more than in 2011).
In San Francisco (San Francisco County), 83.5% voted for Democrats and 13.0% for Republicans in 2012 Presidential Election. In Stockton (San Joaquin County), 55.6% voted for Democrats and 41.9% for Republicans.
Elections
Type
Democrats
Republicans
Other
Year
San Francisco
Stockton
San Francisco
Stockton
San Francisco
Stockton
2020
85.3%
55.6%
12.7%
41.8%
2.0%
2.6%
2016
84.6%
53.4%
9.2%
39.2%
6.2%
7.5%
2012
83.5%
55.6%
13.0%
41.9%
3.4%
2.5%
2008
84.4%
54.2%
13.7%
43.6%
2.0%
2.2%
2004
83.0%
46.3%
15.2%
53.7%
1.8%
0.0%
2000
75.7%
47.9%
16.1%
49.1%
8.1%
3.0%
1996
72.2%
46.3%
15.7%
44.9%
12.1%
8.8%
Breakdown of population affiliated with a religious congregation
Type
Adherents
Congregations
Religion
San Francisco
Stockton
San Francisco
Stockton
CATHOLIC CHURCH
15.0%
26.8%
9.6%
4.0%
EPISCOPAL CHURCH
0.8%
0.1%
3.5%
0.7%
MUSLIM ESTIMATE
0.8%
1.5%
1.2%
2.0%
SOUTHERN BAPTIST CONVENTION
0.7%
1.1%
8.4%
10.2%
AMERICAN BAPTIST CHURCHES IN THE USA
0.6%
0.3%
2.5%
1.1%
LUTHERAN CHURCH
0.2%
0.4%
1.5%
1.1%
SEVENTH DAY ADVENTIST CHURCH
0.2%
0.7%
1.9%
3.1%
NORTH AMERICAN BAPTIST CONFERENCE
0.1%
0.6%
0.4%
1.3%
CHRISTIAN REFORMED CHURCH NORTH AMERICA
0.0%
0.4%
0.2%
1.3%
Weather
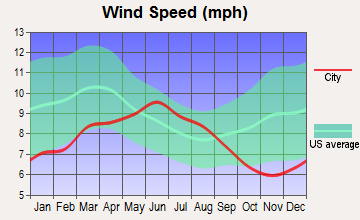
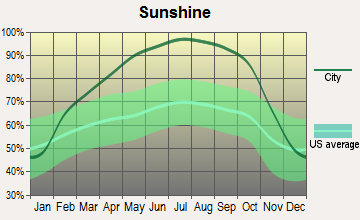
San Francisco is known for its moderate, Mediterranean-type weather, with cool, foggy summers and mild, wet winters. It also has microclimates, causing weather to change rapidly within city areas. Stockton's climate is warmer, experiencing hot, dry summers and mild to cool, wet winters. Both cities enjoy many sunlit days throughout the year, making them attractive to residents and visitors alike.
Weather and climate
Type
San Francisco
Stockton
Temperature - Average
58.3°F
60.9°F
Humidity - Average morning or afternoon humidity
84.3%
63.2%
Humidity - Differences between morning and afternoon humidity
29%
59%
Humidity - Maximum monthly morning or afternoon humidity
91%
86%
Humidity - Minimum monthly morning or afternoon humidity
62%
27%
Precipitation - Yearly average
22.2 in
16.6 in
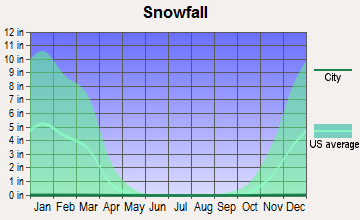
Snowfall - Yearly average
0 in
0 in
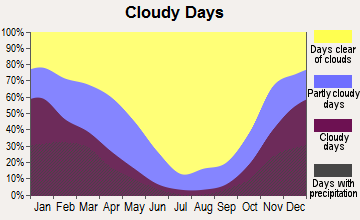
Clouds - Number of days clear of clouds
26.8%
30.7%
Sunshine amount - Average
73%
81.6%
Sunshine amount - Differences during a year
22%
44.4%
Sunshine amount - Maximum monthly
77%
91.9%
Sunshine amount - Minimum monthly
55%
47.5%
Wind speed - Average
11.4 mph
8.3 mph
Average climate in San Francisco, California
Average climate in Stockton, California
Air pollution
Type
AQI
CO
NO2
OZONE
PB
PM10
PM25
SO2
Year
San Francisco
Stockton
San Francisco
Stockton
San Francisco
Stockton
San Francisco
Stockton
San Francisco
Stockton
Stockton
San Francisco
Stockton
San Francisco
Stockton
2018
104
124
0.35
0.30
11.3
12.2
23.4
23.2
0.012
0.006
30.5
N/A
11.9
16.5
0.4
0.8
2017
96
108
0.40
0.29
11.4
11.3
22.5
23.4
0.008
0.005
27.4
N/A
9.9
12.3
0.6
1.5
2016
68
111
0.39
0.26
10.6
12.2
22.4
21.7
0.005
0.005
22.2
N/A
7.9
12.7
0.8
1.5
2015
85
113
0.41
0.27
12.1
11.9
22.5
24.0
0.004
0.005
26.3
N/A
7.9
12.7
0.8
1.0
2014
85
109
0.38
0.26
12.1
13.4
21.8
26.1
0.005
0.005
26.9
N/A
7.7
11.5
0.6
0.8
2013
88
111
0.40
0.31
13.9
15.5
20.4
23.8
0.004
0.005
29.8
N/A
10.2
15.7
0.5
0.6
2012
75
114
0.40
0.19
12.8
14.4
22.7
24.2
0.003
0.005
24.0
N/A
8.2
12.4
1.1
0.7
2011
86
105
0.24
0.25
14.1
15.5
21.3
22.1
0.003
0.003
23.5
N/A
9.5
12.6
1.7
0.9
2010
84
96
0.21
0.14
13.4
13.9
22.0
21.9
0.004
0.003
14.0
N/A
10.6
9.1
1.0
1.1
2009
95
98
0.30
0.20
15.1
15.3
20.4
21.1
0.005
0.005
15.8
N/A
12.8
6.0
1.1
1.0
2008
94
107
0.43
0.26
15.6
16.8
21.7
22.7
0.007
N/A
24.7
N/A
11.7
10.2
0.9
1.1
2007
84
110
0.45
0.34
15.6
16.4
20.5
21.5
0.007
0.009
19.5
N/A
8.9
12.5
1.2
1.1
2006
86
94
0.52
0.41
16.1
18.4
21.5
22.1
N/A
N/A
N/A
N/A
8.7
N/A
1.6
2.1
2005
89
81
0.39
0.44
14.8
17.2
20.5
20.1
N/A
N/A
N/A
N/A
8.8
N/A
1.3
2.0
2004
93
82
0.44
0.47
16.1
17.1
20.9
19.9
0.004
N/A
25.2
N/A
11.2
N/A
2.5
1.6
2003
65
89
0.64
0.55
18.4
18.4
19.7
19.1
N/A
N/A
26.1
N/A
N/A
N/A
1.7
2.2
2002
62
86
0.69
0.53
18.6
20.5
19.6
18.9
0.008
0.007
29.2
N/A
N/A
N/A
1.4
2.5
2001
64
97
0.72
0.54
19.2
19.4
19.0
19.7
0.008
0.006
28.3
N/A
N/A
N/A
1.4
2.1
2000
60
99
0.71
0.64
20.3
21.2
17.1
18.9
0.017
0.007
25.9
N/A
N/A
N/A
2.0
1.6
Natural disasters
Type
San Francisco
Stockton
Tornado activity compared to U.S. average
7.7%
10.1%
Earthquake activity compared to U.S. average
7,468.1%
8,060.1%
Natural disasters compared to U.S. average
6%
20%
Transportation
San Francisco has excellent public transit, with buses, light rail, subways, and the iconic cable cars, though traffic can be heavy. Biking and walking are also viable options. In Stockton, most people commute by car, but public transit options are available through San Joaquin Regional Transit District buses.
Transport
Type
San Francisco
Stockton
Amtrak stations
4
2
Amtrak stations nearby
3
3
FAA registered aircraft
453
146
FAA registered aircraft manufacturers and dealers
9
9
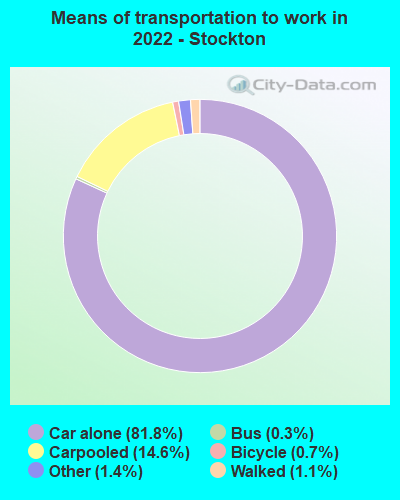
Means of transportation to work
Type
San Francisco
Stockton
Bicycle
2.7%
0.2%
Bus
11.4%
0.6%
Carpooled
9.1%
13.3%
Car alone
53.9%
83.6%
Ferryboat
0.4%
0.1%
Motorcycle
0.9%
0.1%
Railroad
0.7%
0.1%
Streetcar
7.9%
0%
Subway
1.6%
0.1%
Taxicab
0.4%
0%
Walked
8.3%
1%
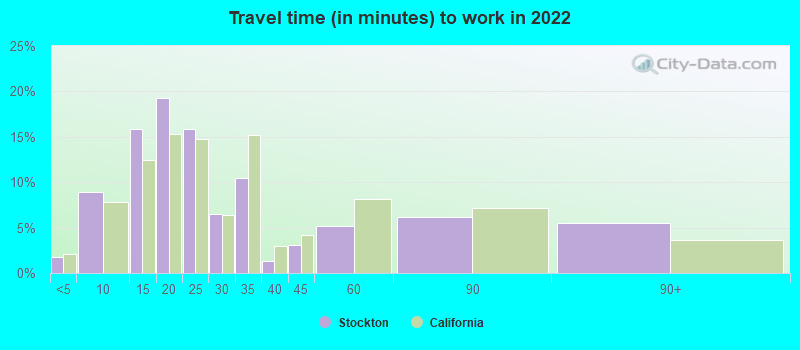
Average travel time to work
Type
San Francisco
Stockton
Average
38 min
29.9 min
Other means
28.3 min
26.4 min
Public transportation
39.7 min
44.5 min
Private vehicle occupancy
Type
San Francisco
Stockton
Average
1.2
1.2
Drove alone
85.5%
86.7%
In 2 person carpool
10.1%
8.9%
In 3 person carpool
3.2%
2.5%
In 4 person carpool
0.9%
0.7%
In 5-6 person carpool
0.2%
1%
In 7+ person carpool
0.1%
0.3%
How many people usually rode to work in the car, truck or van.
Real Estate
San Francisco's real estate market is one of the costliest in the country. Demand exceeds supply, pushing prices high. Stockton's real estate is much more affordable, with a mix of urban and suburban-style housing, although prices have been rising in recent years.
Neighborhoods
San Francisco hosts diverse neighborhoods like vibrant Mission, tourist-attracting Fisherman's Wharf or posh Pacific Heights. Stockton has family-friendly neighborhoods like Brookside and Lincoln Village. Safety, amenities, and cultural feel greatly vary among neighborhoods in both cities.
Houses and residents
Type
San Francisco
Stockton
Houses
412,269
102,642
Average household size (people)
2.3
3.2
Median year apartment built
1953
1977
Median year house/condo built
1942
1983
Length of stay in the house since moving in
16.3 years
13.2 years
Houses occupied
350,796 (85.1%)
97,447 (94.9%)
Houses occupied by owners
140,809 (40.1%)
53,081 (54.5%)
Houses occupied by renters
209,987 (59.9%)
44,366 (45.5%)
Median rent asked for vacant for-rent units
$3,809
$586.05
Median monthly housing costs
$2,337
$1,381
Median price asked for vacant for-sale houses and condos
$1,670,841
$363,278
Estimated median house or condo value
Over $1,000,000
$382,900
Median numbers of rooms
3.9
5.3
Median number of rooms in apartments
3.2
4.4
Median number of rooms in houses and condos
5.6
6.2
Median house price - detached houses
Over $1,000,000
$374,875
Median house price - in 2-unit structures
Over $1,000,000
$434,326
Median house price - in 3-to-4-unit structures
Over $1,000,000
$234,826
Median house price - in 5 or more unit structures
Over $1,000,000
$243,924
Median house price - mobile homes
$517,939
$146,499
Median house price - Townhouses or other attached units
Over $1,000,000
$256,924
Median house price - All housing units
Over $1,000,000
$367,426
Median house age
76
42
Renting percentage
64.2%
48.4%
Housing density (houses/condos per square mile)
8,829.1
1,876.1
House value disparities
18.7%
23.2%
Household income disparities
41.7%
42.3%
Median household income for houses/condes with a mortgage
$210,544
$102,856
Median household income for apartments without a mortgage
$99,969
$70,897
Housing units without a mortgage
1,778 (1.9%)
338 (0.9%)
Housing units with both a second mortgage and home equity loan
7,687 (8.3%)
2,064 (5.6%)
Housing units with a mortgage
91,236 (98.1%)
36,674 (99.1%)
Housing units with a home equity loan
471 (0.5%)
329 (0.9%)
Housing units with a second mortgage
9,395 (10.1%)
2,814 (7.6%)
House/condo owner moved in on average (years ago)
14
11
House/condo renter moved in on average (years ago)
4
4
Housing units lacking complete kitchen facilities
4.7%
2.3%
Housing units lacking complete plumbing facilities
2.7%
1%
Housing units in structures
Housing units in structures
San Francisco
Stockton
One, detached
19.1%
68.0%
One, attached
12.1%
6.7%
Two
9.0%
2.6%
3 or 4
11.4%
5.0%
5 to 9
9.0%
4.2%
10 to 19
9.3%
4.3%
20 to 49
11.3%
3.3%
50 or more
18.7%
4.6%
Mobile homes
0.1%
1.3%
Boats, RVs, vans, etc.
0.0%
0.1%
Median real estate property taxes paid for housing units
Self-employed workers in own not incorporated business
30,288
7,637
State government workers
22,691
6,210
Unpaid family workers
399
95
Industries and Occupations
Leading industries in San Francisco include technology, finance, and health care. In Stockton, agriculture, health care, and education provide significant employment. Tech jobs in San Francisco typically command high salaries, whereas Stockton's mean wages reflect the primarily blue-collar job environment.
San Francisco boasts excellent healthcare facilities, ranking high nationally for healthcare access and quality. Stockton also offers good healthcare with several notable hospitals, but access may be challenging in some areas.
San Francisco is praised for its infrastructure catering to pedestrians, cyclists, and public transit users. Stockton's infrastructure developed with a focus on driving, but improvements for pedestrians and cycle routes are underway. Both cities have amenities like parks, hospitals, and schools fairly distributed.
Infrastructure
Type
San Francisco
Stockton
Hospitals
16
17
TV stations
18
14
Arenas or stadiums
2
2
Bank branches located here
281
54
Bank institutions located here
52
19
Main business address for public companies
68
2
Drinking water stations with no reported violations in the past
5
14
Drinking water stations with reported violations in the past
HMDA - Conventional home purchase loans - Applications denied
Year
San Francisco
Stockton
1999
1,402
548
2000
1,000
606
2001
733
597
2002
870
622
2003
1,576
1,557
2004
2,147
2,481
2005
2,344
3,201
2006
2,511
3,075
2007
2,117
1,611
2008
1,575
744
2009
952
362
Culture and Food
San Francisco is globally acclaimed for its diverse culture and cuisine, hosting numerous festivals and a wide range of global culinary treats. Stockton also has a thriving culture with roots in the agricultural scene, boasting a strong farm-to-table dining scene and multiple festivals, such as the annual Asparagus Festival.
Sports Teams
San Francisco is home to several professional sports teams like the San Francisco Giants (MLB), the San Francisco 49ers (NFL), and the Golden State Warriors (NBA). Stockton has minor league teams, such as the Stockton Ports (Baseball) and Stockton Heat (Hockey).


 San Francisco, CA
 Stockton, CA