San Francisco, CA vs Spring Valley, NV - Advanced U.S. city comparison tool

San Francisco, CA vs Spring Valley, NV

San Francisco, California and Spring Valley, Nevada, while both being part of the lively West Coast, offer considerably different living experiences. The high-paced, dynamic life of San Francisco stands in contrast to the more laid-back, suburban feel of Spring Valley. Below, we delve into different aspects such as crime and safety, weather, cost of living, and more, to give a comprehensive comparison of life in these two cities.
 
 
Distance between San Francisco, CA and Spring Valley, NV : 412.8 miles

San Francisco's population is larger by 282%. Its population has grown by 38,468 people (5.0%) since 2000. The population of Spring Valley has grown by 96,162 people (81.9%) during that time.

Population
Type San Francisco Spring Valley
Population 815,201 213,552
Female / male percentage 48.8% / 51.2%
48.8%
51.2%
52.2% / 47.8%
52.2%
47.8%
Racial makeup - percentage
Ethnicity San FranciscoSpring Valley
White Non-Hispanic 37.1% 36.9%
Asian 35.1% 22.3%
Hispanic 15.7% 21.2%
Two or more 5.9% 7.9%
Black 5.0% 10.2%
Pacific Islander 0.3% 0.8%
American Indian 0.1% 0.5%
Racial makeup - absolute values
Ethnicity San FranciscoSpring Valley
White Non-Hispanic 302,182 78,907
Asian 286,518 47,566
Hispanic 128,030 45,270
Two or more 48,272 16,887
Black 40,955 21,784
Pacific Islander 2,153 1,735
American Indian 1,200 1,017

Crime and Safety

San Francisco has a notably higher crime rate compared to Spring Valley. While both places are generally safe, tourists and residents should be aware of their surroundings, especially in certain neighborhoods. In recent years, San Francisco has seen an increase in property crime, particularly car break-ins, although violent crime rates remain relatively low. Spring Valley features a somewhat lower crime rate, more typical of suburban areas.

Cost of Living

The cost of living is significantly higher in San Francisco compared to Spring Valley. San Francisco is one of the most expensive cities in the U.S., with high housing costs leading the way. On the other hand, Spring Valley, while not cheap, offers a lower cost of living, making it more affordable for many.

Income Tax

California has a progressive income tax while Nevada has no state income tax, potentially making Spring Valley an attractive location for those with high incomes.

Property Tax

Property tax in San Francisco is estimated at around 0.64% while Spring Valley has a lower rate at around 0.60%.

Sales Tax

The sales tax in San Francisco, at around 8.5%, is higher than Spring Valley's approximate 7%.
Income
Type San Francisco Spring Valley
Estimated median household income $121,826 $61,179
Estimated per capita income $80,383 $34,242
Cost of living index (U.S. average is 100) 141.1 100.2

If you make $50,000 in Spring Valley, you will have to make $70,409 in San Francisco to maintain the same standard of living.

Geographical Conditions

San Francisco is characterized by its steep rolling hills and waterfront, providing picturesque scenery. Spring Valley, located in the Mojave Desert, offers a unique desert landscape surrounded by mountains.
Geographical information
Type San Francisco Spring Valley
Land area 46.7 sq. miles 33.4 sq. miles
Population density 17,458 people per sq. mile 6,402.3 people per sq. mile
Relative area comparison
San Francisco, CA Spring Valley, NV
First ancestry reported - percentage
Ancestry San FranciscoSpring Valley
Irish 3.3% 3.4%
Italian 2.5% 3.4%
German 2.1% 3.6%
English 2.0% 2.6%
Russian 1.4% 0.7%
French 1.0% 0.6%
Ukrainian 0.7% 0.3%
Polish 0.5% 1.1%
Scottish 0.4% 0.4%
Dutch 0.3% 0.2%
Greek 0.3% 0.4%
Norwegian 0.3% 0.5%
Swedish 0.3% 0.2%
Hungarian 0.2% 0.4%
French Canadian 0.2% 0.3%
Scotch-Irish 0.2% 0.2%
Arab 0.1% 0.2%
Population origin - absolute values
Ancestry San FranciscoSpring Valley
Irish 15,882 4,551
Italian 11,973 4,648
German 10,077 4,908
English 9,502 3,531
Russian 6,672 949
French 4,680 826
Ukrainian 3,350 465
Polish 2,631 1,421
Scottish 2,139 595
Greek 1,653 515
Swedish 1,389 281
Dutch 1,357 262
Norwegian 1,284 650
French Canadian 1,066 365
Scotch-Irish 1,009 286
Hungarian 984 483
Portuguese 848 152
Czech 548 109
Lithuanian 527 81
Swiss 483 37
Foreign born residents - absolute values
Type Count
Region San FranciscoSpring Valley
All 295,308 62,019
Africa 3,860 6,718
Asia 179,493 31,852
Europe 36,393 5,992
Latin America 49,898 18,209
North America 4,940 928
Oceania 3,504 369
Foreign born residents - percentage
Type Percentage
Region San FranciscoSpring Valley
All 36.2% 27.8%
Africa 0.5% 3.0%
Asia 22.0% 14.3%
Europe 4.5% 2.7%
Latin America 6.1% 8.2%
North America 0.6% 0.4%
Oceania 0.4% 0.2%

Education

San Francisco hosts renowned universities and has a well-established public school system. High schools in SF have constantly achieved high rankings nationwide. Spring Valley's educational system is good, although it may not have the high-profile educational institutions San Francisco boasts.
School enrollment
Type San Francisco Spring Valley
Nursery, preschool 8,718 (5.9%) 1,723 (4%)
Kindergarten 6,826 (4.7%) 2,980 (6.8%)
Grade 1 to 4 23,832 (16.3%) 9,180 (21.1%)
Grade 5 to 8 22,348 (15.2%) 8,186 (18.8%)
Grade 9 to 12 23,856 (16.3%) 11,071 (25.4%)
College undergrad 41,089 (28%) 8,153 (18.7%)
Graduate or professional 19,914 (13.6%) 2,284 (5.2%)
Students in private schools - absolute values
Type Count
Grade San FranciscoSpring Valley
Grades 1 to 8 (elementary and middle school) 15,204 1,383
Grades 9 to 12 (high school) 5,965 1,160
Undergraduate colleges 10,206 1,762
Students in private schools - percentage
Type Percentage
Grade San FranciscoSpring Valley
Grades 1 to 8 (elementary and middle school) 32.9% 8.0%
Grades 9 to 12 (high school) 25.0% 10.5%
Undergraduate colleges 24.8% 21.6%
Educational attainment
Type San Francisco Spring Valley
Less than high school 10.8% 8.9%
High school or equiv. 11.5% 24.4%
Less than 1 year of college 3.5% 8.2%
1 or more years of college 8.1% 15.8%
Associate degree 5.2% 8.8%
Bachelor's degree 34.6% 24.1%
Master's degree 17.4% 7%
Profess. school degree 5% 1.5%
Doctorate degree 3.9% 1.5%
Education level (25-year-olds and older)
Type San Francisco Spring Valley
Bachelor's degree or higher 60.9% 34%
Graduate or professional degree 26.3% 9.9%
High school or higher 89.2% 91.1%

Work and Economy

Both cities offer ample job opportunities but in different sectors. San Francisco, being in the heart of Silicon Valley, is a hub for the technology sector. Spring Valley's economy, while diverse, is heavily centered around tourism, hospitality, and retail due to its proximity to Las Vegas.

Biggest Employers

Some of the biggest employers in San Francisco include Salesforce, Uber, and PG&E. In Spring Valley, many residents are employed by nearby Las Vegas casinos, retail outlets, and restaurants.
Employment and residency - absolute values
Kind San FranciscoSpring Valley
Work and live in this city 322,009 6,393
Work and live in this county 377,734 97,928
Workers who work outside the city they live in 454,724 110,997
Workers who work outside the county they live in 61,209 1,646
Working at home 200,083 9,089
Not working at home 238,860 98,806
Daytime population change due to commuting 168,747 N/A
Employment and residency - percentage
Kind San FranciscoSpring Valley
Work and live in this city 76.9% 10.3%
Work and live in this county 86.1% 98.3%
Workers who work outside the city they live in 23.1% 89.7%
Workers who work outside the county they live in 13.9% 1.7%
Working at home 45.6% 8.4%
Not working at home 54.4% 91.6%
Daytime population change due to commuting 21.7% N/A
Geographical mobility: all
Type all
Mobility San FranciscoSpring Valley
Same house 1 year ago 82.2% 81.9%
Moved from abroad 1.1% 0.3%
Moved within same county 9.6% 12.5%
Moved from different state 2.1% 5.3%
Moved within same state 5.0% 0.1%
Geographical mobility: Asian
Type Asian
Mobility San FranciscoSpring Valley
Same house 1 year ago 84.8% 85.9%
Moved from abroad 1.1% 0.9%
Moved within same county 7.9% 8.5%
Moved from different state 1.3% 4.7%
Moved within same state 5.0% 0%
Geographical mobility: Black
Type Black
Mobility San FranciscoSpring Valley
Same house 1 year ago 82.8% 69.8%
Moved from abroad 0.7% 0%
Moved within same county 7.3% 15.0%
Moved from different state 1.1% 15.2%
Moved within same state 8.1% 0%
Geographical mobility: White
Type White
Mobility San FranciscoSpring Valley
Same house 1 year ago 78.2% 82.2%
Moved from abroad 0.8% 0.2%
Moved within same county 12.4% 13.0%
Moved from different state 2.9% 4.7%
Moved within same state 5.7% 0%

In San Francisco (San Francisco County), 83.5% voted for Democrats and 13.0% for Republicans in 2012 Presidential Election. In Spring Valley (Clark County), 56.4% voted for Democrats and 41.8% for Republicans.

Elections
Type DemocratsRepublicansOther
Year San FranciscoSpring ValleySan FranciscoSpring ValleySan FranciscoSpring Valley
2020 85.3% 53.7% 12.7% 44.3% 2.0% 2.0%
2016 84.6% 52.4% 9.2% 41.7% 6.2% 5.8%
2012 83.5% 56.4% 13.0% 41.8% 3.4% 1.8%
2008 84.4% 58.5% 13.7% 39.5% 2.0% 2.0%
2004 83.0% 51.8% 15.2% 46.9% 1.8% 1.3%
2000 75.7% 51.4% 16.1% 44.8% 8.1% 3.8%
1996 72.2% 75.5% 15.7% 18.8% 12.1% 5.7%
Breakdown of population affiliated with a religious congregation
Type AdherentsCongregations
Religion San FranciscoSpring ValleySan FranciscoSpring Valley
CATHOLIC CHURCH 15.0% 18.1% 9.6% 4.0%
EPISCOPAL CHURCH 0.8% 0.1% 3.5% 1.1%
MUSLIM ESTIMATE 0.8% 0.1% 1.2% 0.6%
SOUTHERN BAPTIST CONVENTION 0.7% 1.6% 8.4% 11.2%
AMERICAN BAPTIST CHURCHES IN THE USA 0.6% 0.2% 2.5% 1.4%
EVANGELICAL LUTHERAN CHURCH IN AMERICA 0.2% 0.4% 1.7% 1.6%

Weather

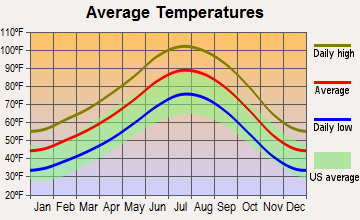
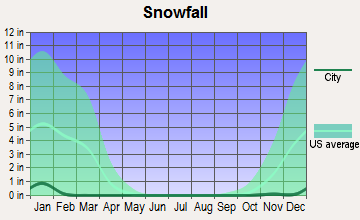
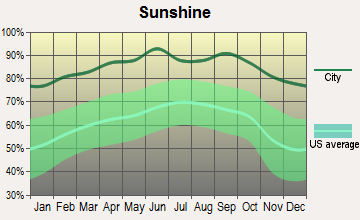
Climate-wise, San Francisco is known for its cool summers, fog, and mild winters, while Spring Valley boasts a desert climate with hot summers and short, mild winters. San Francisco's iconic foggy weather is both loved and hated by residents and visitors. Spring Valley offers more sunshine days, which can be an advantage for those craving warm weather.
Weather and climate
Type San Francisco Spring Valley
Temperature - Average 58.3°F 66.1°F
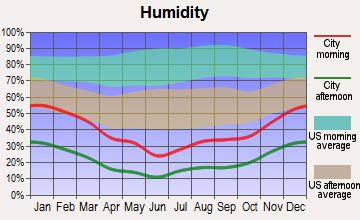
Humidity - Average morning or afternoon humidity 84.3% 30.8%
Humidity - Differences between morning and afternoon humidity 29% 42.1%
Humidity - Maximum monthly morning or afternoon humidity 91% 52.1%
Humidity - Minimum monthly morning or afternoon humidity 62% 10.1%
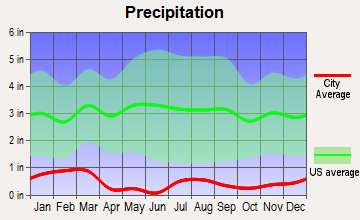
Precipitation - Yearly average 22.2 in 5.8 in
Snowfall - Yearly average 0 in 1.6 in
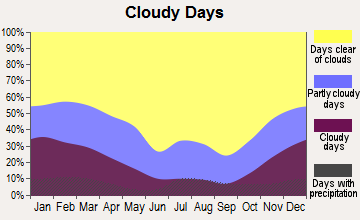
Clouds - Number of days clear of clouds 26.8% 35.1%
Sunshine amount - Average 73% 91.8%
Sunshine amount - Differences during a year 22% 16%
Sunshine amount - Maximum monthly 77% 91.9%
Sunshine amount - Minimum monthly 55% 75.9%
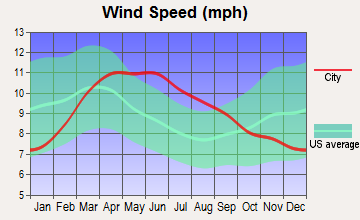
Wind speed - Average 11.4 mph 9.2 mph

Average climate in San Francisco, California

Chicago, Illinois average temperatures Chicago, Illinois average precipitation Chicago, Illinois humidity Chicago, Illinois wind speed Chicago, Illinois snowfall Chicago, Illinois sunshine Chicago, Illinois clear and cloudy days
 

Average climate in Spring Valley, Nevada

Chicago, Illinois average temperatures Chicago, Illinois average precipitation Chicago, Illinois humidity Chicago, Illinois wind speed Chicago, Illinois snowfall Chicago, Illinois sunshine Chicago, Illinois clear and cloudy days
 

Air pollution
Type AQICONO2OZONEPBPM10PM25SO2
Year San FranciscoSpring ValleySan FranciscoSpring ValleySan FranciscoSpring ValleySan FranciscoSpring ValleySan Francisco Spring Valley San FranciscoSpring ValleySan FranciscoSpring Valley
2018 104 102 0.35 0.42 11.3 14.5 23.4 34.8 0.012 N/A 24.6 N/A 11.9 6.5 0.4 0.7
2017 96 102 0.40 0.31 11.4 14.5 22.5 34.4 0.008 N/A 20.1 N/A 9.9 6.3 0.6 0.8
2016 68 111 0.39 0.38 10.6 12.2 22.4 33.6 0.005 N/A 18.8 N/A 7.9 8.1 0.8 0.8
2015 85 92 0.41 0.38 12.1 13.2 22.5 33.7 0.004 N/A 18.7 N/A 7.9 8.0 0.8 1.2
2014 85 92 0.38 0.41 12.1 11.5 21.8 33.3 0.005 N/A 18.6 N/A 7.7 8.7 0.6 1.4
2013 88 103 0.40 0.44 13.9 10.7 20.4 33.8 0.004 N/A 18.7 N/A 10.2 8.1 0.5 1.5
2012 75 98 0.40 0.48 12.8 6.1 22.7 34.1 0.003 N/A 21.0 N/A 8.2 7.8 1.1 1.4
2011 86 86 0.24 0.42 14.1 5.3 21.3 34.1 0.003 N/A 17.3 N/A 9.5 7.1 1.7 1.2
2010 84 87 0.21 0.50 13.4 5.7 22.0 33.3 0.004 N/A 14.6 N/A 10.6 6.6 1.0 N/A
2009 95 83 0.30 0.57 15.1 6.0 20.4 32.0 0.005 N/A 17.9 N/A 12.8 7.8 1.1 N/A
2008 94 82 0.43 0.63 15.6 8.2 21.7 33.2 0.007 N/A N/A N/A 11.7 8.5 0.9 N/A
2007 84 98 0.45 0.53 15.6 10.6 20.5 33.6 0.007 N/A N/A N/A 8.9 8.2 1.2 0.1
2006 86 102 0.52 0.71 16.1 10.8 21.5 31.5 N/A N/A N/A N/A 8.7 8.1 1.6 0.8
2005 89 101 0.39 0.76 14.8 12.6 20.5 29.3 N/A N/A N/A N/A 8.8 7.7 1.3 5.3
2004 93 88 0.44 0.74 16.1 13.6 20.9 30.5 0.004 N/A N/A N/A 11.2 N/A 2.5 1.6
2003 65 99 0.64 0.52 18.4 12.8 19.7 30.4 N/A N/A N/A N/A N/A N/A 1.7 0.9
2002 62 95 0.69 0.12 18.6 12.4 19.6 30.5 0.008 N/A N/A N/A N/A N/A 1.4 0.7
2001 64 96 0.72 0.07 19.2 11.3 19.0 30.3 0.008 N/A N/A N/A N/A N/A 1.4 1.0
2000 60 96 0.71 0.37 20.3 11.6 17.1 31.8 0.017 N/A N/A N/A N/A N/A 2.0 0.4
Natural disasters
Type San Francisco Spring Valley
Tornado activity compared to U.S. average 7.7% 2.1%
Earthquake activity compared to U.S. average 7,468.1% 6,139.5%
Natural disasters compared to U.S. average 6% 12%

Transportation

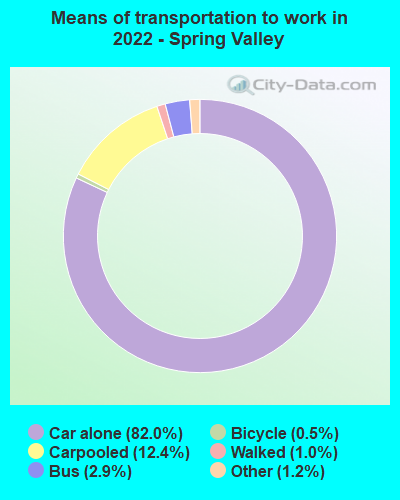
San Francisco is well-served by BART and Muni systems, along with biking routes and walking paths, reducing commute times. Spring Valley, still more car-dependent, does offer bus services which run throughout the city.
Transport
Type San Francisco Spring Valley
Amtrak stations 4 0
Amtrak stations nearby 3 1
FAA registered aircraft 453 0
FAA registered aircraft manufacturers and dealers 9 0
Means of transportation to work
Type San Francisco Spring Valley
Bicycle 2.7% 0.3%
Bus 11.4% 3.1%
Carpooled 9.1% 14.1%
Car alone 53.9% 76.5%
Ferryboat 0.4% 0%
Motorcycle 0.9% 0.3%
Railroad 0.7% 0%
Streetcar 7.9% 0%
Subway 1.6% 0.1%
Taxicab 0.4% 0.1%
Walked 8.3% 1.7%
Means of transportation to work
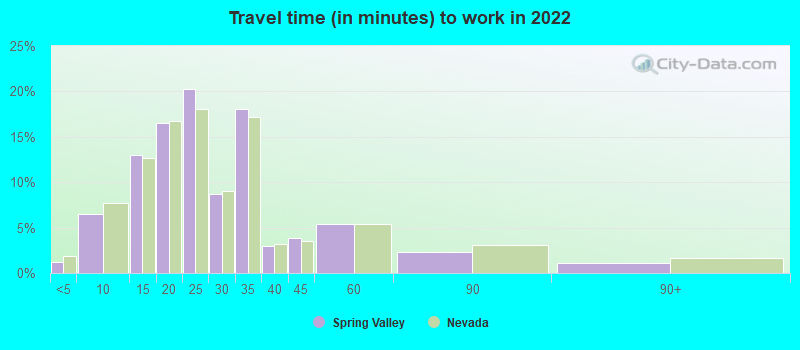
Average travel time to work
Type San Francisco Spring Valley
Average 38 min 25.7 min
Other means 28.3 min 21.1 min
Public transportation 39.7 min 47.6 min
Travel time to work
Time leaving to work
Travel time to work
Time leaving to work
Private vehicle occupancy
Type San Francisco Spring Valley
Average 1.2 1.2
Drove alone 85.5% 88%
In 2 person carpool 10.1% 9.6%
In 3 person carpool 3.2% 1.4%
In 4 person carpool 0.9% 0.5%
In 5-6 person carpool 0.2% 0.2%
In 7+ person carpool 0.1% 0.2%

How many people usually rode to work in the car, truck or van.

Real Estate

The housing market is steep in San Francisco, with it consistently being among the most expensive in the country. Spring Valley, although increasing, offers a more affordable housing market, especially for families looking for suburban homes.

Neighborhoods

From the energy of the Mission District to the quiet elegance of Presidio, San Francisco offers diverse neighborhoods. Spring Valley is less diverse, but offers quiet, family-friendly neighborhoods.
Houses and residents
Type San Francisco Spring Valley
Houses 412,269 94,405
Average household size (people) 2.3 2.5
Median year apartment built 1953 1998
Median year house/condo built 1942 2000
Length of stay in the house since moving in 16.3 years 9.9 years
Houses occupied 350,796 (85.1%) 88,063 (93.3%)
Houses occupied by owners 140,809 (40.1%) 40,227 (45.7%)
Houses occupied by renters 209,987 (59.9%) 47,836 (54.3%)
Median rent asked for vacant for-rent units $3,809 $485.59
Median monthly housing costs $2,337 $1,400
Median price asked for vacant for-sale houses and condos $1,670,841 $442,486
Estimated median house or condo value Over $1,000,000 $382,400
Median numbers of rooms 3.9 4.8
Median number of rooms in apartments 3.2 4.1
Median number of rooms in houses and condos 5.6 5.8
Median house price - detached houses Over $1,000,000 $443,713
Median house price - in 2-unit structures Over $1,000,000 $138,481
Median house price - in 3-to-4-unit structures Over $1,000,000 $191,015
Median house price - in 5 or more unit structures Over $1,000,000 $200,235
Median house price - mobile homes $517,939 $131,058
Median house price - Townhouses or other attached units Over $1,000,000 $392,352
Median house price - All housing units Over $1,000,000 $402,364
Median house age 76 23
Renting percentage 64.2% 48.7%
Housing density (houses/condos per square mile) 8,829.1 2,830.3
House value disparities 18.7% 26.1%
Household income disparities 41.7% 45.3%
Median household income for houses/condes with a mortgage $210,544 $82,617
Median household income for apartments without a mortgage $99,969 $65,301
Housing units without a mortgage 1,778 (1.9%) 443 (1.7%)
Housing units with both a second mortgage and home equity loan 7,687 (8.3%) 2,148 (8.3%)
Housing units with a mortgage 91,236 (98.1%) 25,336 (98.3%)
Housing units with a home equity loan 471 (0.5%) 0 (0%)
Housing units with a second mortgage 9,395 (10.1%) 2,758 (10.7%)
House/condo owner moved in on average (years ago) 14 6
House/condo renter moved in on average (years ago) 4 1
Housing units lacking complete kitchen facilities 4.7% 0.8%
Housing units lacking complete plumbing facilities 2.7% 0.3%
Housing units in structures
Housing units in structures San FranciscoSpring Valley
One, detached 19.1% 49.6%
One, attached 12.1% 7.5%
Two 9.0% 1.3%
3 or 4 11.4% 6.6%
5 to 9 9.0% 9.7%
10 to 19 9.3% 5.8%
20 to 49 11.3% 3.6%
50 or more 18.7% 13.1%
Mobile homes 0.1% 2.7%
Median real estate property taxes paid for housing units
Type San Francisco Spring Valley
With mortgages $10,001 (0.7%) $1,972 (0.5%)
With no mortgages $5,134 (0.4%) $1,871 (0.5%)
Marital status
Type San Francisco Spring Valley
Divorced 7.8% 14.4%
Never married 43.5% 37.1%
Now married 43.1% 41.2%
Separated 1.4% 1.8%
Widowed 4.2% 5.4%
Class of workers - percentage
Class of Workers San FranciscoSpring Valley
Employee of private company 66.7% 77.5%
Private not-for-profit wage and salary workers 9.1% 3.9%
Local government workers 7.0% 4.8%
Self-employed workers in own not incorporated business 6.8% 5.7%
State government workers 5.1% 1.7%
Self-employed in own incorporated business 2.9% 5.4%
Federal government workers 2.3% 1.0%
Class of workers - absolute values
Class of Workers San FranciscoSpring Valley
Employee of private company 299,240 79,588
Federal government workers 10,343 983
Local government workers 31,512 4,962
Private not-for-profit wage and salary workers 40,971 4,004
Self-employed in own incorporated business 12,972 5,569
Self-employed workers in own not incorporated business 30,288 5,829
State government workers 22,691 1,795
Unpaid family workers 399 0

Industries and Occupations

Expectedly, the predominant industry in San Francisco is tech, followed by healthcare and finance. Spring Valley leans heavily on the hospitality, gaming, and retail industries.
Most common male industries
Industry San FranciscoSpring Valley
Professional, scientific, and technical services 25.9% 7.5%
Retail trade 8.0% 13.4%
Educational services 7.6% 3.6%
Health care and social assistance 7.3% 4.7%
Information 7.2% 2.6%
Finance and insurance 6.8% 4.7%
Transportation and warehousing 5.5% 8.2%
Accommodation and food services 5.2% 16.2%
Manufacturing 5.1% 4.0%
Construction 4.0% 8.3%
Administrative and support and waste management services 3.5% 5.7%
Public administration 3.4% 2.2%
Other services, except public administration 3.1% 2.3%
Wholesale trade 2.4% 1.7%
Real estate and rental and leasing 2.1% 3.9%
Arts, entertainment, and recreation 2.0% 10.4%
Utilities 0.7% 0.3%
Agriculture, forestry, fishing and hunting 0.3% 0.1%
Management of companies and enterprises 0.0% 0.4%
Most common female industries
Industry San FranciscoSpring Valley
Professional, scientific, and technical services 22.2% 8.7%
Health care and social assistance 18.5% 15.0%
Educational services 11.4% 8.9%
Retail trade 7.4% 13.8%
Information 5.6% 1.4%
Other services, except public administration 5.0% 5.2%
Finance and insurance 4.3% 7.2%
Public administration 4.1% 2.0%
Accommodation and food services 4.0% 12.2%
Manufacturing 3.8% 2.1%
Administrative and support and waste management services 3.2% 6.0%
Arts, entertainment, and recreation 2.4% 11.2%
Transportation and warehousing 2.3% 3.0%
Real estate and rental and leasing 2.0% 2.5%
Wholesale trade 1.7% 0.3%
Construction 1.0% 0.4%
Utilities 0.5% 0.1%
Agriculture, forestry, fishing and hunting 0.2% 0.0%
Management of companies and enterprises 0.2% 0.0%
Most common male occupations
Occupation San FranciscoSpring Valley
Management occupations 17.8% 12.9%
Computer and mathematical occupations 16.2% 6.3%
Business and financial operations occupations 8.8% 6.5%
Sales and related occupations 8.0% 10.2%
Office and administrative support occupations 4.8% 7.0%
Arts, design, entertainment, sports, and media occupations 4.4% 3.4%
Educational instruction, and library occupations 4.3% 2.4%
Architecture and engineering occupations 3.6% 1.6%
Food preparation and serving related occupations 3.6% 10.9%
Legal occupations 3.3% 0.6%
Life, physical, and social science occupations 3.1% 0.3%
Building and grounds cleaning and maintenance occupations 2.8% 2.2%
Transportation occupations 2.7% 6.0%
Production occupations 2.5% 2.7%
Health diagnosing and treating practitioners and other technical occupations 2.4% 2.2%
Construction and extraction occupations 2.2% 5.7%
Installation, maintenance, and repair occupations 2.1% 4.4%
Material moving occupations 1.9% 4.2%
Healthcare support occupations 1.3% 0.9%
Firefighting and prevention, and other protective service workers including supervisors 1.3% 1.8%
Most common female occupations
Occupation San FranciscoSpring Valley
Management occupations 16.6% 9.9%
Business and financial operations occupations 11.8% 5.8%
Office and administrative support occupations 9.3% 18.3%
Educational instruction, and library occupations 7.4% 4.8%
Health diagnosing and treating practitioners and other technical occupations 6.9% 6.5%
Sales and related occupations 6.8% 12.8%
Arts, design, entertainment, sports, and media occupations 5.4% 2.4%
Healthcare support occupations 5.1% 4.6%
Computer and mathematical occupations 4.9% 4.3%
Life, physical, and social science occupations 4.5% 1.7%
Personal care and service occupations 3.6% 8.0%
Legal occupations 3.4% 1.4%
Food preparation and serving related occupations 2.7% 7.7%
Architecture and engineering occupations 2.0% 0.2%
Building and grounds cleaning and maintenance occupations 2.0% 3.2%
Community and social service occupations 1.8% 0.5%
Health technologists and technicians 1.6% 3.0%
Production occupations 1.4% 1.0%
Material moving occupations 1.1% 0.8%
Transportation occupations 1.1% 0.8%
Food environment data per 10,000 residents
Food environment statistics San FranciscoSpring Valley
Number of convenience stores (no gas) 0.8 2.2
Number of convenience stores (with gas) 0.6 1.0
Number of full-service restaurants 19.8 5.7
Number of grocery stores 3.9 1.4
Food environment - absolute values
Food environment statistics San FranciscoSpring Valley
Number of convenience stores (no gas) 65 403
Number of convenience stores (with gas) 47 176
Number of full-service restaurants 1,580 1,038
Number of grocery stores 311 258
Number of supercenters and club stores 1 15
Obesity and diabetes
Food environment statistics rate San FranciscoSpring Valley
Adult diabetes rate 7.4% 8.7%
Adult obesity rate 16.1% 24.8%
Low-income preschool obesity rate 16.3% 13.2%

Health Care

San Francisco hosts some of the best healthcare facilities in the country, including UCSF Medical Center. Spring Valley, while offering solid health care services, may not compare to the large number of world-renowned medical centers in San Francisco.
Health (county statistics)
Type San Francisco Spring Valley
General health status score of residents in this county from 1 (poor) to 5 (excellent) 3.6 3.4
Average weight of females (lbs) 144.4 lbs 160.2 lbs
Average weight of males (lbs) 179.1 lbs 194.9 lbs
Residents visited a dentist within the past year 73.1% 64%
Residents exercised in the past month 81.8% 72.3%
Adult residents drank alcohol in the past 30 days 99.8% 71.5%
Residents smoked 100+ cigarettes in their lives 39.5% 50.6%

Fatal vehicle accidents per 100,000 residents
Type Total count per 100,000Drunk per 100,000Fatal count per 100,000Pedestrian count per 100,000Person count per 100,000Vehicle count per 100,000
Year San FranciscoSpring ValleySan FranciscoSpring ValleySan FranciscoSpring ValleySan FranciscoSpring ValleySan FranciscoSpring ValleySan FranciscoSpring Valley
2021 3.8 10.1 0.0 0.0 3.8 10.1 2.0 3.4 7.7 24.1 6.9 16.8
2020 3.3 11.2 0.0 1.1 3.6 11.8 1.8 2.8 7.9 25.2 5.5 20.2
2019 3.9 6.2 0.3 2.2 4.4 9.0 2.5 2.2 9.2 22.4 6.3 15.1
2018 3.1 3.9 0.2 1.1 3.1 3.9 2.7 1.7 4.7 7.3 4.1 7.3
2017 2.8 6.7 0.1 2.8 2.8 6.7 2.1 0.6 4.3 19.6 3.6 15.1
2016 3.9 5.0 0.5 1.7 4.1 5.6 2.8 0.6 8.0 16.3 7.2 10.7
2015 4.4 10.1 0.2 3.4 4.4 10.7 3.5 4.5 7.2 27.5 6.1 17.4
2014 3.6 5.6 0.5 0.6 3.8 5.6 2.8 1.7 6.7 9.5 4.6 7.8
2013 3.8 9.5 0.6 1.7 3.9 9.5 3.2 5.0 5.5 17.9 5.7 13.5
2012 3.6 2.2 1.3 0.0 3.6 2.2 2.3 1.1 7.9 5.6 5.4 3.9
2011 3.7 4.5 1.1 2.2 3.7 4.5 2.1 1.7 8.5 14.0 5.3 9.0
2010 3.5 3.9 1.2 1.7 3.9 3.9 2.1 0.6 8.4 10.7 5.1 6.7
2009 4.8 4.1 0.6 1.7 4.8 4.6 2.8 0.6 10.9 14.5 6.4 9.3
2008 4.3 6.0 1.1 1.8 4.3 6.0 2.6 1.2 11.0 17.4 6.1 12.6
2007 6.5 11.2 2.3 3.7 6.6 11.9 4.5 1.9 16.4 32.5 10.9 22.5
2006 5.0 14.9 1.8 5.2 5.3 14.9 2.7 1.9 14.8 36.4 10.4 26.0
2005 4.0 12.2 1.7 2.0 4.2 14.2 2.2 4.1 9.4 39.9 5.1 23.7
2004 4.7 0.7 2.1 0.0 5.3 0.7 3.0 0.0 12.3 4.2 5.8 4.2
2003 6.1 0.0 1.7 0.0 6.7 0.0 4.6 0.0 15.6 0.0 8.0 0.0
2002 4.9 0.0 1.2 0.0 5.0 0.0 2.8 0.0 12.6 0.0 6.7 0.0
2001 4.8 0.8 1.0 0.0 5.0 0.8 3.1 0.0 13.3 2.4 6.6 0.8
2000 6.1 0.0 1.0 0.0 6.3 0.0 4.9 0.0 16.9 0.0 7.5 0.0
1999 6.0 0.9 1.9 0.0 6.0 0.9 3.7 0.0 17.3 2.7 8.7 0.9
1998 7.9 1.0 1.6 1.0 8.2 1.0 5.1 0.0 19.2 5.8 10.3 1.9
1997 7.2 0.0 0.9 0.0 7.3 0.0 5.3 0.0 17.0 0.0 8.6 0.0
1996 6.3 0.0 1.2 0.0 6.8 0.0 3.4 0.0 18.9 0.0 9.5 0.0
1995 8.2 0.0 1.5 0.0 8.8 0.0 4.5 0.0 23.7 0.0 12.6 0.0
1994 8.5 0.0 2.3 0.0 8.6 0.0 4.9 0.0 21.0 0.0 11.5 0.0
1993 7.1 0.0 1.6 0.0 7.3 0.0 4.9 0.0 19.5 0.0 9.7 0.0
1992 8.4 0.0 3.0 0.0 8.9 0.0 5.1 0.0 23.1 0.0 12.0 0.0
1991 9.1 0.0 2.9 0.0 9.4 0.0 5.8 0.0 25.9 0.0 13.2 0.0
1990 10.7 0.0 4.0 0.0 11.6 0.0 0.0 0.0 27.3 0.0 14.8 0.0
1989 7.0 0.0 2.2 0.0 7.2 0.0 0.0 0.0 18.2 0.0 9.2 0.0
1988 10.2 0.0 3.4 0.0 10.6 0.0 0.0 0.0 28.7 0.0 15.4 0.0
1987 6.3 0.0 1.4 0.0 6.6 0.0 0.0 0.0 16.5 0.0 9.3 0.0
1986 6.8 0.0 2.1 0.0 6.9 0.0 0.0 0.0 15.7 0.0 8.8 0.0
1985 10.0 0.0 3.7 0.0 10.5 0.0 0.0 0.0 25.4 0.0 14.4 0.0
1984 7.6 0.0 1.9 0.0 8.2 0.0 0.0 0.0 17.1 0.0 9.8 0.0
1983 8.7 0.0 3.0 0.0 9.0 0.0 0.0 0.0 20.2 0.0 11.1 0.0
1982 10.3 0.0 3.5 0.0 10.6 0.0 0.0 0.0 30.8 0.0 15.6 0.0
1981 8.5 0.0 2.9 0.0 9.1 0.0 0.0 0.0 22.5 0.0 11.9 0.0
1980 12.2 0.0 5.2 0.0 12.7 0.0 0.0 0.0 29.5 0.0 16.6 0.0
1979 10.8 0.0 2.9 0.0 11.7 0.0 0.0 0.0 24.9 0.0 14.4 0.0
1978 11.1 0.0 3.4 0.0 11.9 0.0 0.0 0.0 24.2 0.0 13.3 0.0
1977 10.0 0.0 2.6 0.0 10.3 0.0 0.0 0.0 22.8 0.0 13.0 0.0
1976 11.8 0.0 1.9 0.0 12.4 0.0 0.0 0.0 27.7 0.0 13.7 0.0
1975 11.8 0.0 1.9 0.0 12.3 0.0 0.0 0.0 27.5 0.0 13.6 0.0

Fatal vehicle accidents
Type Total countDrunkFatal countPedestrian countPerson countVehicle count
Year San FranciscoSpring ValleySan FranciscoSpring ValleySan FranciscoSpring ValleySan FranciscoSpring ValleySan FranciscoSpring ValleySan FranciscoSpring Valley
1975 82 0 13 0 86 0 0 0 192 0 95 0
1976 82 0 13 0 86 0 0 0 192 0 95 0
1977 69 0 18 0 71 0 0 0 157 0 90 0
1978 76 0 23 0 82 0 0 0 166 0 91 0
1979 74 0 20 0 80 0 0 0 170 0 98 0
1980 83 0 35 0 86 0 0 0 200 0 113 0
1981 58 0 20 0 62 0 0 0 154 0 81 0
1982 71 0 24 0 73 0 0 0 212 0 107 0
1983 60 0 21 0 62 0 0 0 140 0 77 0
1984 53 0 13 0 57 0 0 0 119 0 68 0
1985 70 0 26 0 74 0 0 0 178 0 101 0
1986 48 0 15 0 49 0 0 0 111 0 62 0
1987 45 0 10 0 47 0 0 0 117 0 66 0
1988 73 0 24 0 76 0 0 0 205 0 110 0
1989 50 0 16 0 52 0 0 0 131 0 66 0
1990 77 0 29 0 84 0 0 0 197 0 107 0
1991 66 0 21 0 68 0 42 0 188 0 96 0
1992 61 0 22 0 65 0 37 0 168 0 87 0
1993 52 0 12 0 53 0 36 0 142 0 71 0
1994 62 0 17 0 63 0 36 0 153 0 84 0
1995 60 0 11 0 64 0 33 0 173 0 92 0
1996 46 0 9 0 50 0 25 0 139 0 70 0
1997 53 0 7 0 54 0 39 0 126 0 64 0
1998 59 1 12 1 61 1 38 0 143 6 77 2
1999 45 1 14 0 45 1 28 0 129 3 65 1
2000 47 0 8 0 49 0 38 0 131 0 58 0
2001 38 1 8 0 39 1 24 0 104 3 52 1
2002 38 0 9 0 39 0 22 0 98 0 52 0
2003 47 0 13 0 52 0 36 0 121 0 62 0
2004 36 1 16 0 41 1 23 0 95 6 45 6
2005 31 18 13 3 33 21 17 6 73 59 40 35
2006 39 23 14 8 42 23 21 3 116 56 82 40
2007 52 18 18 6 53 19 36 3 131 52 87 36
2008 35 10 9 3 35 10 21 2 89 29 49 21
2009 39 7 5 3 39 8 23 1 89 25 52 16
2010 28 7 10 3 31 7 17 1 68 19 41 12
2011 30 8 9 4 30 8 17 3 69 25 43 16
2012 30 4 11 0 30 4 19 2 65 10 45 7
2013 32 17 5 3 33 17 27 9 46 32 48 24
2014 31 10 4 1 32 10 24 3 57 17 39 14
2015 38 18 2 6 38 19 30 8 62 49 53 31
2016 34 9 4 3 36 10 24 1 70 29 63 19
2017 25 12 1 5 25 12 18 1 38 35 32 27
2018 27 7 2 2 27 7 24 3 41 13 36 13
2019 34 11 3 4 39 16 22 4 81 40 55 27
2020 29 20 0 2 31 21 16 5 69 45 48 36
2021 31 18 0 0 31 18 16 6 63 43 56 30
Place of birth - Foreign born
Residents San FranciscoSpring Valley
All residents 34.3% 26.5%
American Indian / Alaska Native residents 32.7% 31.2%
Asian residents 60.9% 66.5%
Black or African American residents 10.2% 12.2%
Native Hawaiian / Pacific Islander residents 20.5% 6.8%
Other race residents 46.6% 45.0%
Two or more races residents 16.7% 12.3%
White residents 15.3% 11.0%
White alone, not Hispanic / Latino residents 15.4% 12.1%
Place of birth - Native, outside of US
Residents San FranciscoSpring Valley
All residents 2.3% 3.2%
Asian residents 2.3% 6.3%
Black or African American residents 2.7% 0.7%
Native Hawaiian / Pacific Islander residents 11.2% 10.0%
Other race residents 2.3% 1.7%
Two or more races residents 3.3% 4.2%
White residents 1.6% 2.2%
White alone, not Hispanic / Latino residents 1.9% 1.5%
Place of birth - Born in state of residence
Residents San FranciscoSpring Valley
All residents 41.6% 22.4%
American Indian / Alaska Native residents 52.0% 16.4%
Asian residents 30.8% 13.9%
Black or African American residents 64.9% 23.0%
Native Hawaiian / Pacific Islander residents 48.0% 11.5%
Other race residents 44.2% 22.7%
Two or more races residents 61.5% 35.2%
White residents 41.8% 23.4%
White alone, not Hispanic / Latino residents 40.0% 20.2%
Place of birth - Born in other state
Residents San FranciscoSpring Valley
All residents 21.8% 47.8%
American Indian / Alaska Native residents 15.2% 52.5%
Asian residents 6.0% 13.3%
Black or African American residents 22.2% 64.1%
Native Hawaiian / Pacific Islander residents 20.3% 71.7%
Other race residents 7.0% 30.6%
Two or more races residents 18.5% 48.3%
White residents 41.3% 63.4%
White alone, not Hispanic / Latino residents 42.7% 66.2%
English speakers (speaking English at home)
Type San Francisco Spring Valley
Born in the United States residents 91.4% 87.2%
Foreign born residents 17.7% 12.7%
Native, born elsewhere residents 55% 60.5%
Total residents 57.3% 61.7%
Mechanisms of homicide
Mechanism San FranciscoSpring Valley
Homicides from 2000 to 2006 441 1,069
Cut / Pierce 34 117
Firearm 294 698
Suffocation 0 59
Mechanisms of homicide per 1,000,000 residents
Mechanism San FranciscoSpring Valley
Homicides from 2000 to 2006 80.9 96.7
Cut / Pierce 6.2 10.6
Firearm 53.9 63.1
Suffocation 0 5.3
Mechanisms of suicide per 1,000,000 residents
Mechanism San FranciscoSpring Valley
Suicides from 2000 to 2006 120.3 178.3
Cut / Pierce 0 3.9
Drowning 4.4 0
Fall 16.5 3.3
Firearm 21.5 98.1
Poisoning 31.0 37.3
Suffocation 35.8 31.8

Infrastructure

With a network of bridges, ferries, and a solid public transit system, San Francisco offers superior accessibility compared to Spring Valley. Infrastructure in Spring Valley, although adequate, is more car-dependent.
Infrastructure
Type San Francisco Spring Valley
TV stations 18 18
HMDA - Conventional home purchase loans - Applications denied
Year San FranciscoSpring Valley
1999 1,402 484
2000 1,000 101
2001 733 34
2002 870 51
2003 1,576 1,226
2004 2,147 2,298
2005 2,344 3,570
2006 2,511 2,556
2007 2,117 1,323
2008 1,575 659
2009 952 337

Culture and Food

San Francisco is globally known for its diverse culture and excellent food scene. Spring Valley, being located next to Las Vegas, also offers a good food scene with diverse options, but may lack in the accessibility of cultural arts compared to San Francisco.

Sports Teams

As for sports, San Francisco is home to several professional teams, including the 49ers and Giants, providing rich sports culture. Meanwhile, Spring Valley residents primarily support Las Vegas teams, such as the Raiders and the Golden Knights.