San Francisco, CA, and South Aurora, CO, are two distinct cities, each offering a unique lifestyle. San Francisco, known for its bustling lifestyle, strong tech industry, and steep cost of living, contrasts with South Aurora's quieter environment, affordable living, and rapidly growing economy. Both cities have their charms and welcome everyone from seasoned professionals to tourists seeking a relaxing getaway.
San Francisco has high crime rates compared to the national average, with theft appliances being a common crime. However, it's important to note that crime is concentrated in certain neighborhoods. South Aurora, on the other hand, is generally a safer city with crime rates lower than the national average. Local organizations and law enforcement work together to maintain this safe environment, making it an attractive place to live.
Cost of Living
Living in San Francisco is expensive, with its cost of living significantly higher than the national average, driven primarily by housing prices. On the other hand, South Aurora offers a more affordable lifestyle. While it's still above the national average in terms of cost of living, it's considerably cheaper than San Francisco.
Income Tax
High-income earners in California, including San Francisco, face one of the highest state income tax rates in the U.S. Colorado has a flat income tax rate, so South Aurora residents pay a lower rate compared to those in San Francisco.
Property Tax
Despite its high property prices, San Francisco has relatively low property tax rates. South Aurora also has relatively low property tax rates, making it an attractive place for homeownership.
Sales Tax
San Francisco has a high sales tax rate at 8.5%, which includes the state, county, and city tax. South Aurora's combined sales tax rate is significantly lower, currently at 4.75%.
Income
Type
San Francisco
South Aurora
Estimated median household income
$121,826
$80,212
Estimated per capita income
$80,383
$39,129
Cost of living index (U.S. average is 100)
141.1
110.1
If you make $50,000 in South Aurora, you will have to make $64,078 in San Francisco to maintain the same standard of living.
Geographical Conditions
San Francisco is defined by its hills, oceanic coastline, and Bay. South Aurora sits on relatively flat terrain as a part of the Great Plains, with the scenic Rocky Mountains serving as a beautiful backdrop to the west.
Geographical information
Type
San Francisco
South Aurora
Land area
46.7 sq. miles
78.4 sq. miles
Population density
17,458 people per sq. mile
4,199.1 people per sq. mile
Relative area comparison
San Francisco, CA South Aurora, CO
Education
Both cities prioritize education. San Francisco is home to world-renowned institutions such as UC Berkeley and Stanford. South Aurora also has quality educational opportunities with the Cherry Creek School District being one of Colorado's best. Both cities have numerous public and private school choices for K-12 education, along with community colleges.
San Francisco is the hub of the tech industry, with large corporations like Apple, Google, and Facebook headquartered nearby. South Aurora's economy is diverse with robust healthcare, aerospace, and retail sectors. Job growth is on the rise in both cities, though the median household income in San Francisco is higher.
Biggest Employers
San Francisco's biggest employers include Salesforce, Uber, and Wells Fargo. In South Aurora, the largest employers are the University of Colorado Health and the Cherry Creek School District. Both cities provide plenty of job opportunities across various sectors.
In San Francisco (San Francisco County), 83.5% voted for Democrats and 13.0% for Republicans in 2012 Presidential Election. In South Aurora (Arapahoe County), 54.4% voted for Democrats and 44.4% for Republicans.
Elections
Type
Democrats
Republicans
Other
Year
San Francisco
South Aurora
San Francisco
South Aurora
San Francisco
South Aurora
2020
85.3%
61.3%
12.7%
36.6%
2.0%
2.1%
2016
84.6%
53.1%
9.2%
38.9%
6.2%
8.1%
2012
83.5%
54.4%
13.0%
44.4%
3.4%
1.3%
2008
84.4%
56.0%
13.7%
43.0%
2.0%
1.0%
2004
83.0%
47.6%
15.2%
51.6%
1.8%
0.8%
2000
75.7%
43.6%
16.1%
51.6%
8.1%
4.8%
1996
72.2%
41.9%
15.7%
50.8%
12.1%
7.3%
Breakdown of population affiliated with a religious congregation
Type
Adherents
Congregations
Religion
San Francisco
South Aurora
San Francisco
South Aurora
CATHOLIC CHURCH
15.0%
12.1%
9.6%
4.3%
EPISCOPAL CHURCH
0.8%
0.4%
3.5%
1.7%
MUSLIM ESTIMATE
0.8%
1.9%
1.2%
1.0%
SOUTHERN BAPTIST CONVENTION
0.7%
1.6%
8.4%
9.9%
AMERICAN BAPTIST CHURCHES IN THE USA
0.6%
0.1%
2.5%
1.7%
EVANGELICAL LUTHERAN CHURCH IN AMERICA
0.2%
2.0%
1.7%
4.3%
LUTHERAN CHURCH
0.2%
1.0%
1.5%
2.6%
Weather
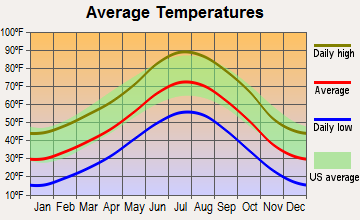
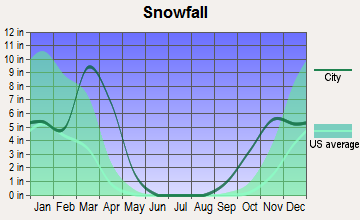
San Francisco boasts a mild year-round climate with wet, cool winters and dry summers. The foggy city is globally known for its microclimates which can cause sudden temperature shifts. Conversely, South Aurora experiences a seasonal climate with hot summers and snowy winters, providing a variety of outdoor activities throughout the year like skiing and hiking.
Weather and climate
Type
San Francisco
South Aurora
Temperature - Average
58.3°F
49.9°F
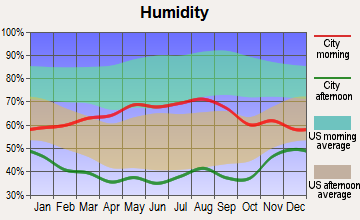
Humidity - Average morning or afternoon humidity
84.3%
50.6%
Humidity - Differences between morning and afternoon humidity
29%
20%
Humidity - Maximum monthly morning or afternoon humidity
91%
55%
Humidity - Minimum monthly morning or afternoon humidity
62%
35%
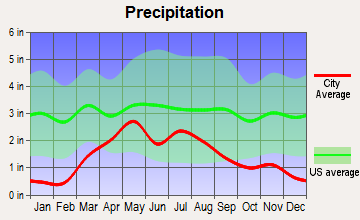
Precipitation - Yearly average
22.2 in
17.6 in
Snowfall - Yearly average
0 in
114 in
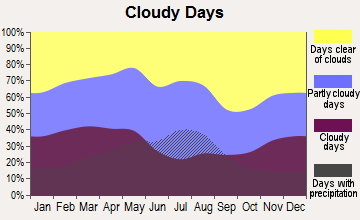
Clouds - Number of days clear of clouds
26.8%
19.2%
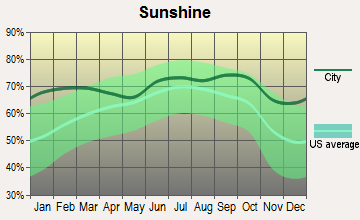
Sunshine amount - Average
73%
75.6%
Sunshine amount - Differences during a year
22%
10%
Sunshine amount - Maximum monthly
77%
74%
Sunshine amount - Minimum monthly
55%
64%
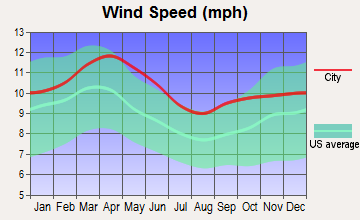
Wind speed - Average
11.4 mph
8.6 mph
Average climate in San Francisco, California
Average climate in South Aurora, Colorado
Air pollution
Type
AQI
CO
NO2
OZONE
PB
PM10
PM25
SO2
Year
San Francisco
South Aurora
San Francisco
South Aurora
San Francisco
South Aurora
San Francisco
South Aurora
San Francisco
South Aurora
South Aurora
San Francisco
South Aurora
San Francisco
South Aurora
2018
104
99
0.35
0.37
11.3
21.6
23.4
31.9
0.012
N/A
29.2
N/A
11.9
8.5
0.4
0.7
2017
96
95
0.40
0.37
11.4
22.0
22.5
31.8
0.008
N/A
22.0
N/A
9.9
8.4
0.6
0.9
2016
68
90
0.39
0.43
10.6
24.0
22.4
31.3
0.005
N/A
22.6
N/A
7.9
8.1
0.8
1.0
2015
85
101
0.41
0.44
12.1
23.0
22.5
30.2
0.004
N/A
20.6
N/A
7.9
9.6
0.8
1.1
2014
85
94
0.38
0.43
12.1
22.0
21.8
30.3
0.005
N/A
22.7
N/A
7.7
10.1
0.6
1.3
2013
88
84
0.40
0.39
13.9
19.7
20.4
30.7
0.004
N/A
22.0
N/A
10.2
N/A
0.5
1.4
2012
75
90
0.40
0.34
12.8
18.9
22.7
31.4
0.003
N/A
24.3
N/A
8.2
N/A
1.1
1.2
2011
86
91
0.24
0.34
14.1
18.1
21.3
31.5
0.003
N/A
23.8
N/A
9.5
N/A
1.7
1.5
2010
84
81
0.21
0.41
13.4
16.3
22.0
29.3
0.004
N/A
26.6
N/A
10.6
N/A
1.0
1.0
2009
95
79
0.30
0.37
15.1
14.1
20.4
27.3
0.005
0.005
22.6
N/A
12.8
N/A
1.1
1.3
2008
94
85
0.43
0.41
15.6
17.3
21.7
29.1
0.007
0.008
25.5
N/A
11.7
N/A
0.9
1.6
2007
84
96
0.45
0.41
15.6
20.6
20.5
25.7
0.007
0.007
28.9
N/A
8.9
N/A
1.2
1.2
2006
86
89
0.52
0.50
16.1
19.0
21.5
25.4
N/A
0.026
28.0
N/A
8.7
N/A
1.6
1.4
2005
89
86
0.39
0.57
14.8
21.3
20.5
22.7
N/A
0.106
29.6
N/A
8.8
N/A
1.3
1.5
2004
93
82
0.44
0.61
16.1
21.2
20.9
21.6
0.004
0.035
28.6
N/A
11.2
N/A
2.5
1.8
2003
65
106
0.64
0.61
18.4
21.2
19.7
23.4
N/A
0.038
32.6
N/A
N/A
N/A
1.7
1.9
2002
62
86
0.69
0.64
18.6
19.2
19.6
23.0
0.008
0.027
35.7
N/A
N/A
N/A
1.4
2.5
2001
64
95
0.72
0.79
19.2
23.8
19.0
20.8
0.008
0.029
32.6
N/A
N/A
N/A
1.4
2.6
2000
60
93
0.71
0.77
20.3
13.7
17.1
21.7
0.017
0.032
12.2
N/A
N/A
N/A
2.0
2.1
Natural disasters
Type
San Francisco
South Aurora
Tornado activity compared to U.S. average
7.7%
137.7%
Earthquake activity compared to U.S. average
7,468.1%
797.1%
Natural disasters compared to U.S. average
6%
10%
Transportation
Public transportation in San Francisco is plentiful and includes Muni, BART, and ferries. However, traffic can be a major concern. South Aurora has a reliable public transit system with Light Rail and buses and less traffic, making commuting less of an ordeal.
Transport
Type
San Francisco
South Aurora
Amtrak stations
4
0
Amtrak stations nearby
3
2
FAA registered aircraft
453
0
FAA registered aircraft manufacturers and dealers
9
0
Means of transportation to work
Type
San Francisco
South Aurora
Bicycle
2.7%
0.2%
Bus
11.4%
3.5%
Carpooled
9.1%
12%
Car alone
53.9%
78.6%
Ferryboat
0.4%
0%
Motorcycle
0.9%
0.1%
Railroad
0.7%
0%
Streetcar
7.9%
0%
Subway
1.6%
0%
Taxicab
0.4%
0.1%
Walked
8.3%
1.3%
Average travel time to work
Type
San Francisco
South Aurora
Average
38 min
27.5 min
Real Estate
San Francisco real estate is notoriously expensive, with sky-high prices for both homes and rentals. In contrast, while South Aurora's market is also competitive, it offers more affordable homes, townhouses, and apartments.
Neighborhoods
San Francisco is known for its distinct neighborhoods from cultural Mission District to posh Pacific Heights. South Aurora has more suburban-style neighborhoods, known for being quiet, family-friendly, and having a strong sense of community.
Houses and residents
Type
San Francisco
South Aurora
Houses
412,269
119,373
Average household size (people)
2.3
2.6
Houses occupied
350,796 (85.1%)
115,977 (97.2%)
Houses occupied by owners
140,809 (40.1%)
76,163 (65.7%)
Houses occupied by renters
209,987 (59.9%)
39,814 (34.3%)
Median rent asked for vacant for-rent units
$3,809
$1,519
Median price asked for vacant for-sale houses and condos
$1,670,841
$836,561
Estimated median house or condo value
Over $1,000,000
$439,151
Median number of rooms in apartments
3.2
3.9
Median number of rooms in houses and condos
5.6
7.2
Renting percentage
64.2%
38.4%
Housing density (houses/condos per square mile)
8,829.1
1,522.9
Household income disparities
41.7%
40.8%
Housing units without a mortgage
1,778 (1.9%)
6,903 (10.6%)
Housing units with both a second mortgage and home equity loan
7,687 (8.3%)
358 (0.6%)
Housing units with a mortgage
91,236 (98.1%)
57,942 (89.4%)
Housing units with a home equity loan
471 (0.5%)
5,373 (8.3%)
Housing units with a second mortgage
9,395 (10.1%)
10,116 (15.6%)
Housing units lacking complete kitchen facilities
4.7%
0.4%
Housing units lacking complete plumbing facilities
Self-employed workers in own not incorporated business
30,288
8,665
State government workers
22,691
4,200
Unpaid family workers
399
351
Industries and Occupations
San Francisco is a global tech hub, with many residents working in software development, marketing, and research. South Aurora has a diversified economy with many residents employed in healthcare, education, and retail. Aerospace is also a significant industry in Aurora due to the presence of Buckley Air Force Base.
Both cities have excellent healthcare facilities. San Francisco is home to renowned UCSF Medical Center, while South Aurora's healthcare is anchored by the UCHealth University of Colorado Hospital.
Health (county statistics)
Type
San Francisco
South Aurora
General health status score of residents in this county from 1 (poor) to 5 (excellent)
San Francisco has an extensive infrastructure, from its famous cable cars to the Golden Gate Bridge. It's a tech-friendly city that encourages entrepreneurship and innovation. South Aurora's infrastructure is less iconic but still well-equipped, with a developing network of transportation, utilities, and public services that support its growing population.
Infrastructure
Type
San Francisco
South Aurora
TV stations
18
14
Culture and Food
San Francisco is famous for its dynamic culture and international cuisine. It offers a vibrant nightlife, numerous festivals, museums, and theaters. South Aurora has a quieter but still rich cultural scene, with Vietnamese, Mexican, and other ethnic cuisines well-represented.
Sports Teams
San Francisco has several professional sports teams, including the Giants (MLB) and the 49ers (NFL). South Aurora has close proximity to Denver, allowing easy access to games by the Broncos (NFL), Nuggets (NBA), and Rockies (MLB).
 San Francisco, CA
 South Aurora, CO