San Francisco, CA, and Kansas City, MO, offer distinctively different living experiences influenced by geographic, economic, and cultural disparities. While San Francisco is renowned for its technological innovation, scenic beauty, high cost of living, and cultural diversity, Kansas City boasts its low living costs, hearty Midwestern culture, up-and-coming tech scene, and rich jazz and barbeque traditions. Each city appeals differently to prospective residents and tourists, and a comparison helps in highlighting their unique attributes.
Distance between
San Francisco, CA and
Kansas City, MO : 1,506.1 miles
San Francisco's population is larger by 60%. Its population has grown by 38,468 people (5.0%) since 2000. The population of Kansas City has grown by 66,849 people (15.1%) during that time.
Both cities face their crime challenges. San Francisco has a higher crime rate compared to Kansas City per capita, largely attributed to property crime rates, largely due to vehicle break-ins. In contrast, Kansas City's crime challenges lean more towards violent crime, but it's worth noting that these are mostly concentrated in specific areas. Municipal efforts are ongoing in both cities to improve safety and security.
City-data.com crime index counts serious crimes and violent crime more heavily. It adjusts for the number of visitors and daily workers commuting into cities. (higher means more crime, U.S. average = 301.1)
City-data.com crime index counts serious crimes and violent crime more heavily. It adjusts for the number of visitors and daily workers commuting into cities. (higher means more crime, U.S. average = 301.1)
Sex Offenders
According to our data, there are 830 registered sex offenders living in San Francisco and 1,820 registered sex offenders living in . The ratio of residents to sex offenders in San Francisco is 1,049 to 1; the ratio in Kansas City is 264 to 1. The number of registered sex offenders compared to the number of residents is a lot smaller in San Francisco than in Kansas City.
Cost of Living
San Francisco is one of the most expensive cities to live in the U.S., with high housing costs driving the cost of living. In contrast, Kansas City offers a significantly lower cost of living, particularly in housing, making it more affordable for families and retirees.
Income Tax
California, where San Francisco is located, has a progressive income tax, whereas Missouri, home to Kansas City, has a lower, flat rate income tax, though local earnings taxes are also in effect.
Property Tax
Property taxes in San Francisco are lower than the national average, but high property values can result in substantial tax bills. Kansas City has an average property tax rate, but the lower property values mean homeowners typically pay less.
Sales Tax
Both cities have sales taxes, but San Francisco's overall sales tax is typically higher. Kansas City, however, levies additional local sales taxes that make its sales tax one of the highest in the nation.
Income
Type
San Francisco
Kansas City
Estimated median household income
$121,826
$63,396
Estimated per capita income
$80,383
$36,456
Cost of living index (U.S. average is 100)
141.1
87.3
If you make $50,000 in Kansas City, you will have to make $80,813 in San Francisco to maintain the same standard of living.
Geographical Conditions
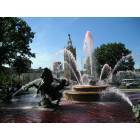
San Francisco is characterised by hilly terrain and surrounded by water on three sides, offering stunning views of the Pacific Ocean and the Bay. Kansas City has a flatter landscape, known for its fountains and boulevards, located on the confluence of the Missouri and Kansas rivers.
San Francisco has a variety of world-class educational institutions, including notable universities and an array of public and private schools. Kansas City also offers a good school system, both public and private, with initiatives aimed at improving its public schools. The city is home to solid universities, including the University of Missouri-Kansas City.
San Francisco's economy is robust, fueled by sectors like technology, finance, and tourism. Meanwhile, Kansas City has a diversified economy, with key sectors including telecommunications, automobile manufacturing, and a burgeoning tech startup scene.
Biggest Employers
In San Francisco, some of the biggest employers include Salesforce, Wells Fargo, and Uber, reflecting its strong ties to tech and finance. Kansas City's big employers include the federal government, Ford Motor Company, and Cerner Corporation.
In San Francisco (San Francisco County), 83.5% voted for Democrats and 13.0% for Republicans in 2012 Presidential Election. In Kansas City (Jackson County), 58.9% voted for Democrats and 39.3% for Republicans.
Elections
Type
Democrats
Republicans
Other
Year
San Francisco
Kansas City
San Francisco
Kansas City
San Francisco
Kansas City
2020
85.3%
60.1%
12.7%
38.1%
2.0%
1.8%
2016
84.6%
55.5%
9.2%
38.1%
6.2%
6.4%
2012
83.5%
58.9%
13.0%
39.3%
3.4%
1.7%
2008
84.4%
62.1%
13.7%
36.8%
2.0%
1.1%
2004
83.0%
58.2%
15.2%
41.4%
1.8%
0.4%
2000
75.7%
59.0%
16.1%
38.4%
8.1%
2.5%
1996
72.2%
56.2%
15.7%
34.3%
12.1%
9.5%
Breakdown of population affiliated with a religious congregation
Type
Adherents
Congregations
Religion
San Francisco
Kansas City
San Francisco
Kansas City
CATHOLIC CHURCH
15.0%
10.3%
9.6%
6.4%
EPISCOPAL CHURCH
0.8%
0.8%
3.5%
1.7%
MUSLIM ESTIMATE
0.8%
0.4%
1.2%
1.1%
SOUTHERN BAPTIST CONVENTION
0.7%
9.5%
8.4%
13.7%
AMERICAN BAPTIST CHURCHES IN THE USA
0.6%
0.3%
2.5%
1.4%
LUTHERAN CHURCH
0.2%
1.4%
1.5%
1.8%
SALVATION ARMY
0.2%
0.4%
1.3%
0.6%
SEVENTH DAY ADVENTIST CHURCH
0.2%
0.5%
1.9%
1.0%
Weather
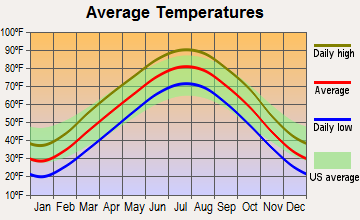
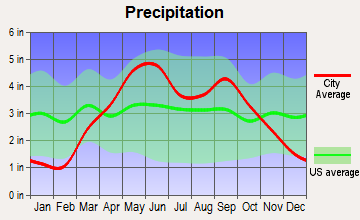
San Francisco is characterized by a Mediterranean climate with mild, moist winters and dry summers, tempered by cool marine layers that often result in fog. Kansas City, on the other hand, experiences a humid continental climate, with hot, humid summers and cold winters. Kansas City also experiences more precipitation, including snow in winters, compared to San Francisco.
Weather and climate
Type
San Francisco
Kansas City
Temperature - Average
58.3°F
56.2°F
Humidity - Average morning or afternoon humidity
84.3%
76.3%
Humidity - Differences between morning and afternoon humidity
29%
30.1%
Humidity - Maximum monthly morning or afternoon humidity
91%
86%
Humidity - Minimum monthly morning or afternoon humidity
62%
56%
Precipitation - Yearly average
22.2 in
36.3 in
Snowfall - Yearly average
0 in
38 in
Clouds - Number of days clear of clouds
26.8%
20.1%
Sunshine amount - Average
73%
67.3%
Sunshine amount - Differences during a year
22%
25.9%
Sunshine amount - Maximum monthly
77%
74%
Sunshine amount - Minimum monthly
55%
48%
Wind speed - Average
11.4 mph
11.2 mph
Average climate in San Francisco, California
Average climate in Kansas City, Missouri
Air pollution
Type
AQI
CO
NO2
OZONE
PB
PM10
PM25
SO2
Year
San Francisco
Kansas City
San Francisco
Kansas City
San Francisco
Kansas City
San Francisco
Kansas City
San Francisco
Kansas City
San Francisco
Kansas City
San Francisco
Kansas City
2018
104
89
0.35
0.29
11.3
11.1
23.4
29.6
0.012
N/A
24.5
N/A
11.9
7.4
0.4
0.9
2017
96
88
0.40
0.29
11.4
11.6
22.5
30.4
0.008
N/A
26.7
N/A
9.9
10.0
0.6
1.4
2016
68
85
0.39
0.30
10.6
12.0
22.4
28.9
0.005
N/A
24.9
N/A
7.9
9.0
0.8
1.5
2015
85
90
0.41
0.30
12.1
12.9
22.5
28.9
0.004
N/A
33.6
N/A
7.9
8.3
0.8
4.6
2014
85
90
0.38
0.28
12.1
13.0
21.8
28.6
0.005
N/A
28.5
N/A
7.7
9.3
0.6
5.0
2013
88
88
0.40
0.41
13.9
13.2
20.4
29.3
0.004
N/A
30.8
N/A
10.2
10.3
0.5
5.6
2012
75
105
0.40
0.52
12.8
14.2
22.7
31.9
0.003
N/A
N/A
N/A
8.2
10.3
1.1
6.4
2011
86
108
0.24
0.45
14.1
15.0
21.3
29.9
0.003
N/A
N/A
N/A
9.5
10.9
1.7
4.8
2010
84
97
0.21
0.40
13.4
15.0
22.0
27.4
0.004
N/A
N/A
N/A
10.6
11.9
1.0
5.4
2009
95
96
0.30
0.29
15.1
14.8
20.4
28.3
0.005
N/A
N/A
N/A
12.8
9.6
1.1
6.1
2008
94
89
0.43
0.40
15.6
17.0
21.7
25.7
0.007
N/A
N/A
N/A
11.7
11.5
0.9
6.0
2007
84
104
0.45
0.42
15.6
18.4
20.5
29.1
0.007
N/A
N/A
N/A
8.9
13.1
1.2
4.2
2006
86
104
0.52
0.36
16.1
18.5
21.5
29.2
N/A
N/A
N/A
N/A
8.7
12.4
1.6
5.1
2005
89
105
0.39
0.55
14.8
18.3
20.5
28.4
N/A
N/A
N/A
N/A
8.8
N/A
1.3
4.5
2004
93
83
0.44
0.45
16.1
11.6
20.9
26.2
0.004
N/A
N/A
N/A
11.2
N/A
2.5
4.0
2003
65
99
0.64
0.41
18.4
10.9
19.7
28.0
N/A
N/A
N/A
N/A
N/A
N/A
1.7
3.0
2002
62
100
0.69
0.40
18.6
8.9
19.6
27.0
0.008
N/A
N/A
N/A
N/A
N/A
1.4
2.5
2001
64
88
0.72
0.52
19.2
7.9
19.0
27.0
0.008
N/A
N/A
N/A
N/A
N/A
1.4
1.2
2000
60
102
0.71
0.75
20.3
8.8
17.1
29.2
0.017
N/A
N/A
N/A
N/A
N/A
2.0
2.2
Natural disasters
Type
San Francisco
Kansas City
Tornado activity compared to U.S. average
7.7%
200.4%
Earthquake activity compared to U.S. average
7,468.1%
598.9%
Natural disasters compared to U.S. average
6%
24%
Transportation
San Francisco has a comprehensive public transit system, including buses, light rail, and the iconic cable cars. Meanwhile, Kansas City has a growing transit system, highlighted by the free-to-ride streetcar line downtown. Traffic can be heavy in both cities, but commuting is generally more manageable in Kansas City.
Transport
Type
San Francisco
Kansas City
Amtrak stations
4
1
Amtrak stations nearby
3
3
FAA registered aircraft
453
0
FAA registered aircraft manufacturers and dealers
9
0
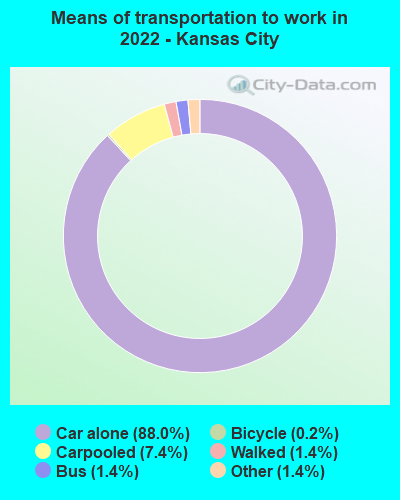
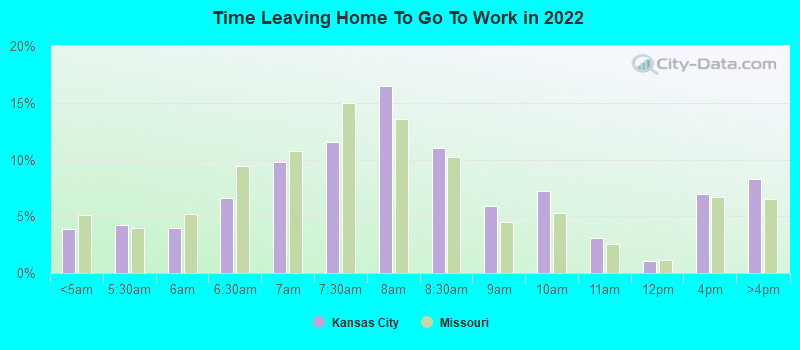
Means of transportation to work
Type
San Francisco
Kansas City
Bicycle
2.7%
0.4%
Bus
11.4%
1.5%
Carpooled
9.1%
8.7%
Car alone
53.9%
86.8%
Ferryboat
0.4%
0%
Motorcycle
0.9%
0.1%
Railroad
0.7%
0%
Streetcar
7.9%
0%
Subway
1.6%
0%
Taxicab
0.4%
0.2%
Walked
8.3%
1.3%
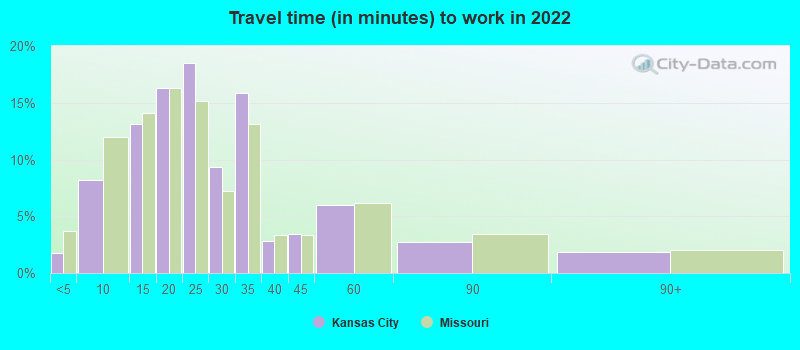
Average travel time to work
Type
San Francisco
Kansas City
Average
38 min
25.5 min
Other means
28.3 min
21.7 min
Public transportation
39.7 min
38.9 min
Private vehicle occupancy
Type
San Francisco
Kansas City
Average
1.2
1.1
Drove alone
85.5%
89.4%
In 2 person carpool
10.1%
8%
In 3 person carpool
3.2%
2.1%
In 4 person carpool
0.9%
0.3%
In 5-6 person carpool
0.2%
0.2%
In 7+ person carpool
0.1%
0%
How many people usually rode to work in the car, truck or van.
Real Estate
San Francisco's real estate is notoriously expensive and competitive, with a high demand and low supply driving prices up. Meanwhile, Kansas City's real estate is much more affordable, offering a diverse range of housing options, from downtown lofts to suburban homes.
Neighborhoods
San Francisco's neighborhoods offer a mix of urban and suburban feel, with each carrying its unique character and charm. Kansas City's neighborhoods, contrastingly, offer a blend of historic and modern styles, with a general sense of spaciousness and affordability.
Houses and residents
Type
San Francisco
Kansas City
Houses
412,269
243,950
Average household size (people)
2.3
2.3
Median year apartment built
1953
1975
Median year house/condo built
1942
1967
Length of stay in the house since moving in
16.3 years
12 years
Houses occupied
350,796 (85.1%)
219,020 (89.8%)
Houses occupied by owners
140,809 (40.1%)
118,384 (54.1%)
Houses occupied by renters
209,987 (59.9%)
100,636 (45.9%)
Median rent asked for vacant for-rent units
$3,809
$933.71
Median monthly housing costs
$2,337
$1,092
Median price asked for vacant for-sale houses and condos
$1,670,841
$71,644
Estimated median house or condo value
Over $1,000,000
$213,400
Median numbers of rooms
3.9
5.5
Median number of rooms in apartments
3.2
4.3
Median number of rooms in houses and condos
5.6
6.6
Median house price - detached houses
Over $1,000,000
$250,072
Median house price - in 2-unit structures
Over $1,000,000
$212,485
Median house price - in 3-to-4-unit structures
Over $1,000,000
$147,015
Median house price - in 5 or more unit structures
Over $1,000,000
$274,597
Median house price - mobile homes
$517,939
$19,650
Median house price - Townhouses or other attached units
Over $1,000,000
$203,232
Median house price - All housing units
Over $1,000,000
$247,285
Median house age
76
52
Renting percentage
64.2%
43.8%
Housing density (houses/condos per square mile)
8,829.1
778
House value disparities
18.7%
36%
Household income disparities
41.7%
43.9%
Median household income for houses/condes with a mortgage
$210,544
$96,255
Median household income for apartments without a mortgage
$99,969
$64,961
Housing units without a mortgage
1,778 (1.9%)
1,566 (2%)
Housing units with both a second mortgage and home equity loan
7,687 (8.3%)
5,650 (7.2%)
Housing units with a mortgage
91,236 (98.1%)
77,422 (98%)
Housing units with a home equity loan
471 (0.5%)
403 (0.5%)
Housing units with a second mortgage
9,395 (10.1%)
6,848 (8.7%)
House/condo owner moved in on average (years ago)
14
9
House/condo renter moved in on average (years ago)
4
1
Housing units lacking complete kitchen facilities
4.7%
3.8%
Housing units lacking complete plumbing facilities
2.7%
2.2%
Housing units in structures
Housing units in structures
San Francisco
Kansas City
One, detached
19.1%
60.7%
One, attached
12.1%
3.9%
Two
9.0%
3.1%
3 or 4
11.4%
4.4%
5 to 9
9.0%
5.8%
10 to 19
9.3%
6.2%
20 to 49
11.3%
5.8%
50 or more
18.7%
9.3%
Mobile homes
0.1%
0.6%
Boats, RVs, vans, etc.
0.0%
0.1%
Median real estate property taxes paid for housing units
Self-employed workers in own not incorporated business
30,288
13,035
State government workers
22,691
6,835
Unpaid family workers
399
197
Industries and Occupations
San Francisco is globally recognized for its tech industry, hosting numerous tech giants and startups. In contrast, Kansas City hosts a mix of industries, including health care, federal government jobs, automobile manufacturing, and tech startups.
Both cities offer excellent healthcare options. San Francisco has numerous top-rated hospitals and a wealth of specialists, influenced by its healthcare innovation. Kansas City also provides high-quality healthcare, with a high number of healthcare providers per capita.
Health (county statistics)
Type
San Francisco
Kansas City
General health status score of residents in this county from 1 (poor) to 5 (excellent)
San Francisco's infrastructure caters well to its high-density population, with impressive skyscrapers, comprehensive public transportation, and well-maintained parks. Kansas City also boasts quality infrastructure, including a free downtown streetcar line, an expanding airport, and significant historic architecture.
Infrastructure
Type
San Francisco
Kansas City
Hospitals
16
30
TV stations
18
14
Arenas or stadiums
2
2
Bank branches located here
281
140
Bank institutions located here
52
41
Main business address for public companies
68
27
Drinking water stations with no reported violations in the past
5
0
Drinking water stations with reported violations in the past
HMDA - Conventional home purchase loans - Applications denied
Year
San Francisco
Kansas City
1999
1,402
1,565
2000
1,000
1,758
2001
733
1,494
2002
870
1,380
2003
1,576
1,975
2004
2,147
3,011
2005
2,344
3,470
2006
2,511
3,499
2007
2,117
2,228
2008
1,575
742
2009
952
447
Culture and Food
San Francisco offers a vibrant cultural scene, with a plethora of cuisines, arts, and music. Comparatively, Kansas City is famous for its jazz music, barbecue food, and a burgeoning arts scene.
Sports Teams
San Francisco is home to major sports teams including the San Francisco 49ers(NFL) and the Giants(MLB). Kansas City also has significant sports teams, including the Kansas City Chiefs(NFL) and the Royals(MLB).


 San Francisco, CA
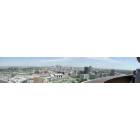
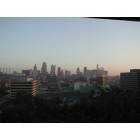
 Kansas City, MO