San Francisco, CA, and Huntington Beach, CA, show significant differences as living destinations, with distinct factors influencing their appeal to prospective residents and tourists. These differences and similarities span across crime and safety, weather, cost of living, education, work and economy, infrastructure, industries and occupations, biggest employers, real estate, neighborhoods, transportation, taxes, culture, sports, geography, and healthcare. This comprehensive report will offer an in-depth comparison of the two appealing California locations.
Distance between
San Francisco, CA and
Huntington Beach, CA : 375.3 miles
San Francisco's population is larger by 315%. Its population has grown by 38,468 people (5.0%) since 2000. The population of Huntington Beach has grown by 7,058 people (3.7%) during that time.
San Francisco has higher crime rates compared to the national average, despite improved policing measures in recent years. Personal safety can be a concern especially in certain neighborhoods. Huntington Beach, on the other hand, has a lower crime rate than the national average, making it safer and appealing for families and individuals. Tourists can feel more secure while exploring local attractions.
City-data.com crime index counts serious crimes and violent crime more heavily. It adjusts for the number of visitors and daily workers commuting into cities. (higher means more crime, U.S. average = 301.1)
City-data.com crime index counts serious crimes and violent crime more heavily. It adjusts for the number of visitors and daily workers commuting into cities. (higher means more crime, U.S. average = 301.1)
Sex Offenders
According to our data, there are 830 registered sex offenders living in San Francisco and 91 registered sex offenders living in . The ratio of residents to sex offenders in San Francisco is 1,049 to 1; the ratio in Huntington Beach is 2,205 to 1. The number of registered sex offenders compared to the number of residents is larger in San Francisco than in Huntington Beach.
Cost of Living
San Francisco is notorious for having an extremely high cost of living, as it surveys as one of the most expensive cities in the US. Everything from groceries to housing can be significantly more costly. By contrast, Huntington Beach, while still expensive compared to the national average, is less costly than San Francisco, offering a more affordable living experience especially for those relocating.
Income Tax
Both cities fall under California's high state income tax, which ranges from 1% to 13.3% based on income levels.
Property Tax
Property taxes in both cities are also influenced by California's state laws. San Francisco and Huntington Beach both have an average property tax rate of approximately 0.76%.
Sales Tax
Both cities share California's 7.25% state sales tax, but San Francisco has a slightly higher total sales tax at 8.5% when including the city tax. Huntington Beach is a bit lower at 7.75%.
Income
Type
San Francisco
Huntington Beach
Estimated median household income
$121,826
$107,808
Estimated per capita income
$80,383
$56,934
Cost of living index (U.S. average is 100)
141.1
89.5
If you make $50,000 in Huntington Beach, you will have to make $78,827 in San Francisco to maintain the same standard of living.
Geographical Conditions
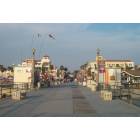
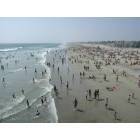
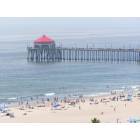
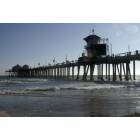
San Francisco is known for its hilly terrain and stunning bay views. Huntington Beach, recognized as 'Surf City USA,' offers nearly ten miles of uninterrupted beachfront scenery, inviting to both residents and tourists.
Both cities exhibit robust education systems. San Francisco hosts several Universities and Colleges, including the well-regarded University of San Francisco. Similarly, Huntington Beach’s educational scene is dominated by the Huntington Beach City School District and Huntington Beach Union High School District. Both cities provide excellent educational opportunities, but San Francisco may have an edge in higher education.
San Francisco's economy is dynamically driven by technology, finance, and tourism. Huntington Beach's economy, conversely, is influenced by tourism, aviation, and manufacturing. While job opportunities abound in both cities, San Francisco's wider array of industries and higher salaries can be more tempting for professionals.
Biggest Employers
In San Francisco, the biggest employers are tech giants like Salesforce, Uber, and Twitter. These companies offer high-paying jobs, attracting a youthful and affluent workforce. Huntington Beach's largest employers include Boeing, Quiksilver, and the healthcare provider Huntington Beach Hospital.
There were 33 building permits issued in San Francisco in 2012 (2 more than in 2011) compared to 100 building permits issued in Huntington Beach in 2012 (76 more than in 2011).
In San Francisco (San Francisco County), 83.5% voted for Democrats and 13.0% for Republicans in 2012 Presidential Election. In Huntington Beach (Orange County), 45.8% voted for Democrats and 52.0% for Republicans.
Elections
Type
Democrats
Republicans
Other
Year
San Francisco
Huntington Beach
San Francisco
Huntington Beach
San Francisco
Huntington Beach
2020
85.3%
53.6%
12.7%
44.6%
2.0%
1.8%
2016
84.6%
50.9%
9.2%
42.4%
6.2%
6.7%
2012
83.5%
45.8%
13.0%
52.0%
3.4%
2.3%
2008
84.4%
47.8%
13.7%
50.3%
2.0%
1.9%
2004
83.0%
39.3%
15.2%
60.2%
1.8%
0.5%
2000
75.7%
40.4%
16.1%
55.9%
8.1%
3.7%
1996
72.2%
37.9%
15.7%
51.7%
12.1%
10.5%
Breakdown of population affiliated with a religious congregation
Type
Adherents
Congregations
Religion
San Francisco
Huntington Beach
San Francisco
Huntington Beach
CATHOLIC CHURCH
15.0%
26.5%
9.6%
4.4%
EPISCOPAL CHURCH
0.8%
0.4%
3.5%
1.4%
MUSLIM ESTIMATE
0.8%
0.8%
1.2%
1.3%
SOUTHERN BAPTIST CONVENTION
0.7%
2.3%
8.4%
8.8%
AMERICAN BAPTIST CHURCHES IN THE USA
0.6%
0.2%
2.5%
1.7%
EVANGELICAL LUTHERAN CHURCH IN AMERICA
0.2%
0.4%
1.7%
2.3%
LUTHERAN CHURCH
0.2%
0.6%
1.5%
2.0%
REFORMED CHURCH IN AMERICA
0.2%
0.3%
0.2%
0.2%
SEVENTH DAY ADVENTIST CHURCH
0.2%
0.4%
1.9%
1.3%
Weather
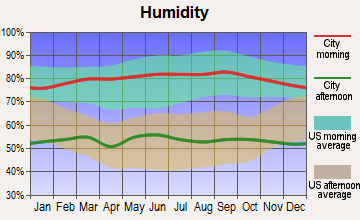
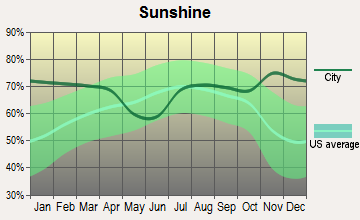
San Francisco's weather is typically cool with heavy fog, especially in the summer. The average highs rarely exceed 70°F, offering a much cooler climate than most cities in California. On the other hand, Huntington Beach, due to its Southern California location, boasts warmer and sunnier weather year-round. Tourists and residents can enjoy lots of beach time in Huntington Beach.
Weather and climate
Type
San Francisco
Huntington Beach
Temperature - Average
58.3°F
64.3°F
Humidity - Average morning or afternoon humidity
84.3%
70.1%
Humidity - Differences between morning and afternoon humidity
29%
26.7%
Humidity - Maximum monthly morning or afternoon humidity
91%
78.7%
Humidity - Minimum monthly morning or afternoon humidity
62%
52%
Precipitation - Yearly average
22.2 in
12.9 in
Snowfall - Yearly average
0 in
0 in
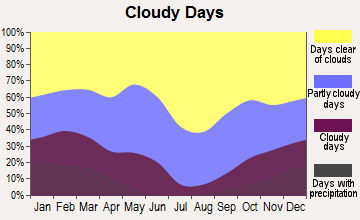
Clouds - Number of days clear of clouds
26.8%
26.5%
Sunshine amount - Average
73%
78.4%
Sunshine amount - Differences during a year
22%
21.9%
Sunshine amount - Maximum monthly
77%
84.8%
Sunshine amount - Minimum monthly
55%
62.9%
Wind speed - Average
11.4 mph
6 mph
Average climate in San Francisco, California
Average climate in Huntington Beach, California
Air pollution
Type
AQI
CO
NO2
OZONE
PB
PM10
PM25
SO2
Year
San Francisco
Huntington Beach
San Francisco
Huntington Beach
San Francisco
Huntington Beach
San Francisco
Huntington Beach
San Francisco
Huntington Beach
Huntington Beach
San Francisco
Huntington Beach
San Francisco
Huntington Beach
2018
104
119
0.35
0.35
11.3
14.5
23.4
26.2
0.012
N/A
27.5
N/A
11.9
12.7
0.4
0.7
2017
96
116
0.40
0.33
11.4
13.6
22.5
29.3
0.008
N/A
26.7
N/A
9.9
13.9
0.6
0.5
2016
68
102
0.39
0.31
10.6
11.8
22.4
29.9
0.005
N/A
24.1
N/A
7.9
12.4
0.8
0.2
2015
85
106
0.41
0.30
12.1
12.8
22.5
30.4
0.004
N/A
25.0
N/A
7.9
14.4
0.8
0.2
2014
85
110
0.38
0.27
12.1
12.4
21.8
29.0
0.005
N/A
26.7
N/A
7.7
15.4
0.6
0.4
2013
88
107
0.40
0.32
13.9
13.4
20.4
28.2
0.004
0.003
29.7
N/A
10.2
14.2
0.5
0.3
2012
75
103
0.40
0.27
12.8
12.1
22.7
27.1
0.003
0.004
28.3
N/A
8.2
14.3
1.1
0.1
2011
86
109
0.24
0.30
14.1
14.2
21.3
27.3
0.003
0.006
27.7
N/A
9.5
15.8
1.7
0.7
2010
84
102
0.21
0.31
13.4
13.6
22.0
26.5
0.004
0.011
23.6
N/A
10.6
13.9
1.0
0.6
2009
95
118
0.30
0.33
15.1
14.9
20.4
28.1
0.005
0.009
24.3
N/A
12.8
14.4
1.1
1.1
2008
94
124
0.43
0.38
15.6
15.7
21.7
28.7
0.007
0.010
29.3
N/A
11.7
21.6
0.9
1.1
2007
84
100
0.45
0.35
15.6
15.6
20.5
27.4
0.007
0.012
N/A
N/A
8.9
N/A
1.2
0.8
2006
86
114
0.52
0.39
16.1
16.6
21.5
26.6
N/A
0.007
N/A
N/A
8.7
N/A
1.6
1.3
2005
89
95
0.39
0.37
14.8
16.8
20.5
28.2
N/A
0.012
N/A
N/A
8.8
N/A
1.3
1.3
2004
93
119
0.44
0.49
16.1
18.5
20.9
30.6
0.004
0.014
N/A
N/A
11.2
N/A
2.5
1.6
2003
65
122
0.64
0.63
18.4
21.1
19.7
30.0
N/A
0.030
N/A
N/A
N/A
N/A
1.7
1.1
2002
62
106
0.69
0.63
18.6
21.2
19.6
26.3
0.008
0.018
N/A
N/A
N/A
N/A
1.4
1.7
2001
64
116
0.72
0.71
19.2
21.0
19.0
26.0
0.008
0.033
N/A
N/A
N/A
N/A
1.4
1.5
2000
60
125
0.71
0.80
20.3
23.3
17.1
24.6
0.017
0.027
N/A
N/A
N/A
N/A
2.0
1.9
Natural disasters
Type
San Francisco
Huntington Beach
Tornado activity compared to U.S. average
7.7%
18.5%
Earthquake activity compared to U.S. average
7,468.1%
6,818%
Natural disasters compared to U.S. average
6%
32%
Transportation
San Francisco’s public transit is extensive, with options including BART, Muni, and ferries. This is a significant advantage for those commuting or without a car. Huntington Beach relies more on cars, with limited public transit options, a consideration for those without personal vehicles.
Transport
Type
San Francisco
Huntington Beach
Amtrak stations
4
0
Amtrak stations nearby
3
3
FAA registered aircraft
453
156
FAA registered aircraft manufacturers and dealers
9
6
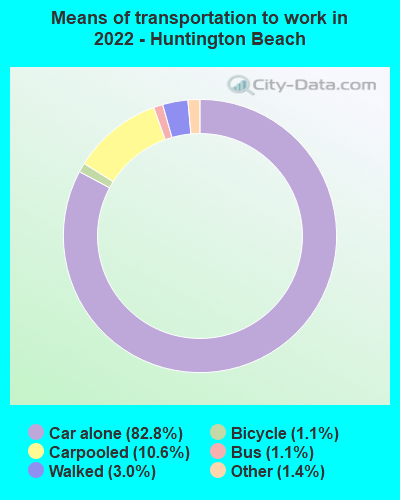
Means of transportation to work
Type
San Francisco
Huntington Beach
Bicycle
2.7%
0.4%
Bus
11.4%
1.1%
Carpooled
9.1%
9.8%
Car alone
53.9%
85.3%
Ferryboat
0.4%
0%
Motorcycle
0.9%
0.2%
Railroad
0.7%
0%
Streetcar
7.9%
0%
Subway
1.6%
0%
Taxicab
0.4%
0%
Walked
8.3%
2%
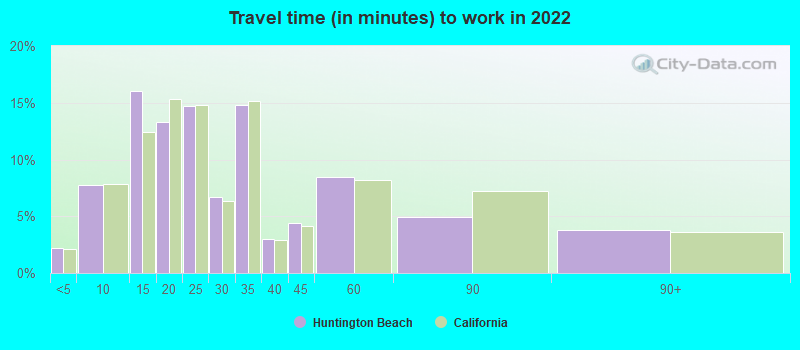
Average travel time to work
Type
San Francisco
Huntington Beach
Average
38 min
25.6 min
Other means
28.3 min
30.1 min
Public transportation
39.7 min
42.2 min
Private vehicle occupancy
Type
San Francisco
Huntington Beach
Average
1.2
1.1
Drove alone
85.5%
92.2%
In 2 person carpool
10.1%
6.3%
In 3 person carpool
3.2%
1%
In 4 person carpool
0.9%
0.5%
In 5-6 person carpool
0.2%
0%
In 7+ person carpool
0.1%
0%
How many people usually rode to work in the car, truck or van.
Real Estate
Real-estate in San Francisco is notably expensive, with high property values and rents. Huntington Beach real estate is more affordable comparatively but still ranks above the national average. While both cities have high real estate prices, relocating families may find Huntington Beach more affordable.
Neighborhoods
San Francisco's neighborhoods range from upscale, like Presidio Heights, to more affordable regions, like Outer Sunset. Each neighborhood offers a unique charm. Huntington Beach neighborhoods, like Downtown and Southeast, offer beachside living with close-knit communities offering a laid-back lifestyle.
Houses and residents
Type
San Francisco
Huntington Beach
Houses
412,269
83,658
Average household size (people)
2.3
2.6
Median year apartment built
1953
1976
Median year house/condo built
1942
1971
Length of stay in the house since moving in
16.3 years
16.6 years
Houses occupied
350,796 (85.1%)
79,930 (95.5%)
Houses occupied by owners
140,809 (40.1%)
45,454 (56.9%)
Houses occupied by renters
209,987 (59.9%)
34,476 (43.1%)
Median rent asked for vacant for-rent units
$3,809
$2,370
Median monthly housing costs
$2,337
$2,132
Median price asked for vacant for-sale houses and condos
$1,670,841
$672,773
Estimated median house or condo value
Over $1,000,000
$937,200
Median numbers of rooms
3.9
5.3
Median number of rooms in apartments
3.2
4.1
Median number of rooms in houses and condos
5.6
6.2
Median house price - detached houses
Over $1,000,000
Over $1,000,000
Median house price - in 2-unit structures
Over $1,000,000
Over $1,000,000
Median house price - in 3-to-4-unit structures
Over $1,000,000
$728,022
Median house price - in 5 or more unit structures
Over $1,000,000
$577,548
Median house price - mobile homes
$517,939
$94,814
Median house price - Townhouses or other attached units
Over $1,000,000
$754,302
Median house price - All housing units
Over $1,000,000
$992,600
Median house age
76
48
Renting percentage
64.2%
39.5%
Housing density (houses/condos per square mile)
8,829.1
3,169.8
House value disparities
18.7%
21.8%
Household income disparities
41.7%
40.7%
Median household income for houses/condes with a mortgage
$210,544
$154,344
Median household income for apartments without a mortgage
$99,969
$104,573
Housing units without a mortgage
1,778 (1.9%)
644 (2.2%)
Housing units with both a second mortgage and home equity loan
7,687 (8.3%)
2,305 (8%)
Housing units with a mortgage
91,236 (98.1%)
28,306 (97.8%)
Housing units with a home equity loan
471 (0.5%)
132 (0.5%)
Housing units with a second mortgage
9,395 (10.1%)
2,690 (9.3%)
House/condo owner moved in on average (years ago)
14
17
House/condo renter moved in on average (years ago)
4
3
Housing units lacking complete kitchen facilities
4.7%
0.6%
Housing units in structures
Housing units in structures
San Francisco
Huntington Beach
One, detached
19.1%
50.0%
One, attached
12.1%
10.5%
Two
9.0%
1.0%
3 or 4
11.4%
13.6%
5 to 9
9.0%
4.7%
10 to 19
9.3%
5.0%
20 to 49
11.3%
2.9%
50 or more
18.7%
9.2%
Mobile homes
0.1%
3.2%
Median real estate property taxes paid for housing units
Self-employed workers in own not incorporated business
30,288
7,644
State government workers
22,691
2,609
Unpaid family workers
399
245
Industries and Occupations
San Francisco's main industries are technology, finance, and tourism, attracting a lot of young professionals and tech enthusiasts. Huntington Beach, on the other hand, leans towards tourism, retail, and aerospace industries, offering diverse opportunities for various professionals.
Both cities have excellent healthcare systems. San Francisco is home to several world-class hospitals like UCSF Medical Center. Huntington Beach is served by the highly-regarded Huntington Beach Hospital and has easy access to prominent Orange County healthcare facilities like UCI Medical Center.
Health (county statistics)
Type
San Francisco
Huntington Beach
General health status score of residents in this county from 1 (poor) to 5 (excellent)
San Francisco boasts of robust infrastructure with iconic landmarks like the Golden Gate Bridge. Huntington Beach, labeled as 'Surf City USA,' features beautiful beachfront property and well-kept roads. Both cities are well-planned and extensively developed, though San Francisco's more extensive public transit system might be an advantage.
Infrastructure
Type
San Francisco
Huntington Beach
Hospitals
16
2
TV stations
18
2
Bank branches located here
281
46
Bank institutions located here
52
19
Main business address for public companies
68
3
Drinking water stations with no reported violations in the past
5
0
Drinking water stations with reported violations in the past
HMDA - Conventional home purchase loans - Applications denied
Year
San Francisco
Huntington Beach
1999
1,402
756
2000
1,000
771
2001
733
544
2002
870
493
2003
1,576
703
2004
2,147
738
2005
2,344
952
2006
2,511
715
2007
2,117
604
2008
1,575
375
2009
952
232
Culture and Food
San Francisco is renowned for its cultural diversity and renowned culinary scene, from its Chinatown to its multitude of Michelin-starred restaurants. Huntington Beach has a more relaxed culture featuring numerous seafood restaurants and bars to cater to its beach-loving residents and tourists.
Sports Teams
San Francisco sports fans enjoy a plethora of options, including the San Francisco 49ers (NFL), the Giants (MLB), and the Golden State Warriors (NBA). Huntington Beach doesn't have its own professional sports teams but is close to Los Angeles, allowing easy access to LA's vast sports offerings.


 San Francisco, CA
 Huntington Beach, CA