San Francisco, CA, and Colorado Springs, CO, are both American cities that offer diverse experiences for both residents and visitors. They offer vastly different climates, costs of living, and cultures, while also providing top-class education, healthcare, and employment opportunities. This comprehensive comparison will provide an in-depth look at the pros and cons of living in these two unique cities, touching on subjects ranging from crime and safety to weather, cost of living and more.
Distance between
San Francisco, CA and
Colorado Springs, CO : 958.1 miles
San Francisco's population is larger by 68%. Its population has grown by 38,468 people (5.0%) since 2000. The population of Colorado Springs has grown by 123,066 people (34.1%) during that time.
Both cities have varying levels of crime, with San Francisco generally having higher crime rates. However, it's important to note that crime is often concentrated in specific neighborhoods, and many areas in both cities are quite safe. San Francisco has been experiencing an upsurge in property crimes, particularly auto burglaries. Colorado Springs has its share of crime, though the rates are typically lower than in San Francisco. Both cities have robust police departments and community safety initiatives.
City-data.com crime index counts serious crimes and violent crime more heavily. It adjusts for the number of visitors and daily workers commuting into cities. (higher means more crime, U.S. average = 301.1)
City-data.com crime index counts serious crimes and violent crime more heavily. It adjusts for the number of visitors and daily workers commuting into cities. (higher means more crime, U.S. average = 301.1)
Sex Offenders
According to our data, there are 830 registered sex offenders living in San Francisco and 1,683 registered sex offenders living in . The ratio of residents to sex offenders in San Francisco is 1,049 to 1; the ratio in Colorado Springs is 276 to 1. The number of registered sex offenders compared to the number of residents is a lot smaller in San Francisco than in Colorado Springs.
Cost of Living
The cost of living is substantially different in these two cities. San Francisco is one of the most expensive cities in the US, with high housing costs being a major factor. On the other side, Colorado Springs is significantly more affordable with lower housing, groceries, and healthcare costs, although it's more expensive than the national average.
Income Tax
California has one of the highest income tax rates in the US, which affects San Francisco residents. Colorado has a flat income tax rate, which can be more favorable for higher-income individuals.
Property Tax
California has a lower property tax rate than Colorado, benefiting homeowners in San Francisco. However, due to higher home prices in San Francisco, the actual property tax bills can be quite high.
Sales Tax
California has a higher state sales tax than Colorado. However, when combined with local sales taxes, the overall sales tax can be higher in some parts of Colorado Springs compared to San Francisco.
Income
Type
San Francisco
Colorado Springs
Estimated median household income
$121,826
$74,579
Estimated per capita income
$80,383
$39,808
Cost of living index (U.S. average is 100)
141.1
99.6
If you make $50,000 in Colorado Springs, you will have to make $70,833 in San Francisco to maintain the same standard of living.
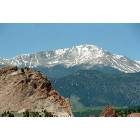
Geographical Conditions
San Francisco features a remarkable mix of oceanfront, hills, and varied topography. Colorado Springs, located at the foot of the Rocky Mountains, offers a mountainous landscape and outdoor recreational opportunities.
Both cities have strong education systems, with numerous quality public and private schools. San Francisco is home to several top-rated universities, including the University of California, San Francisco. In contrast, Colorado Springs also offers high-ranking educations at institutions like the United States Air Force Academy and Colorado College.
Both cities have diverse economies. San Francisco boasts a strong economy rooted in technology, finance, and tourism sectors. In contrast, Colorado Springs' economy is driven by the military, the high-tech industry, and tourism.
Biggest Employers
In San Francisco, some of the biggest employers include Salesforce, Sutter Health, and Wells Fargo. Colorado Springs' largest employers consist of Fort Carson, Peterson Air Force Base, and Colorado Springs School District 11.
In San Francisco (San Francisco County), 83.5% voted for Democrats and 13.0% for Republicans in 2012 Presidential Election. In Colorado Springs (El Paso County), 38.7% voted for Democrats and 59.2% for Republicans.
Elections
Type
Democrats
Republicans
Other
Year
San Francisco
Colorado Springs
San Francisco
Colorado Springs
San Francisco
Colorado Springs
2020
85.3%
43.0%
12.7%
53.9%
2.0%
3.1%
2016
84.6%
34.1%
9.2%
56.6%
6.2%
9.4%
2012
83.5%
38.7%
13.0%
59.2%
3.4%
2.0%
2008
84.4%
40.0%
13.7%
58.9%
2.0%
1.1%
2004
83.0%
32.2%
15.2%
66.9%
1.8%
0.9%
2000
75.7%
30.9%
16.1%
64.1%
8.1%
5.0%
1996
72.2%
32.2%
15.7%
59.0%
12.1%
8.8%
Breakdown of population affiliated with a religious congregation
Type
Adherents
Congregations
Religion
San Francisco
Colorado Springs
San Francisco
Colorado Springs
CATHOLIC CHURCH
15.0%
8.4%
9.6%
5.4%
EPISCOPAL CHURCH
0.8%
0.4%
3.5%
1.6%
MUSLIM ESTIMATE
0.8%
0.0%
1.2%
0.2%
SOUTHERN BAPTIST CONVENTION
0.7%
2.6%
8.4%
11.3%
AMERICAN BAPTIST CHURCHES IN THE USA
0.6%
0.3%
2.5%
1.2%
EVANGELICAL LUTHERAN CHURCH IN AMERICA
0.2%
1.0%
1.7%
2.3%
LUTHERAN CHURCH
0.2%
0.7%
1.5%
1.9%
Weather
In terms of weather, the cities could hardly be more different. San Francisco is known for its mild, temperate climate with cool, foggy summers and mild, wet winters. On the other hand, Colorado Springs is characterized by a semi-arid climate with four distinct seasons, including snowy winters and hot, dry summers. It also has more sunshine hours than San Francisco.
Weather and climate
Type
San Francisco
Colorado Springs
Temperature - Average
58.3°F
43.4°F
Humidity - Average morning or afternoon humidity
84.3%
53.3%
Humidity - Differences between morning and afternoon humidity
29%
30%
Humidity - Maximum monthly morning or afternoon humidity
91%
64%
Humidity - Minimum monthly morning or afternoon humidity
62%
34%
Precipitation - Yearly average
22.2 in
18.6 in
Snowfall - Yearly average
0 in
77 in
Clouds - Number of days clear of clouds
26.8%
21.2%
Sunshine amount - Average
73%
82.2%
Sunshine amount - Differences during a year
22%
10.5%
Sunshine amount - Maximum monthly
77%
79.7%
Sunshine amount - Minimum monthly
55%
69.2%
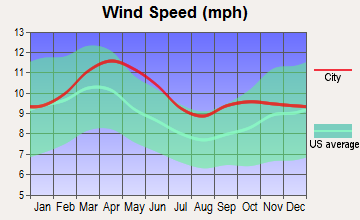
Wind speed - Average
11.4 mph
10.3 mph
Average climate in San Francisco, California
Average climate in Colorado Springs, Colorado
Air pollution
Type
AQI
CO
NO2
OZONE
PB
PM10
PM25
SO2
Year
San Francisco
Colorado Springs
San Francisco
Colorado Springs
San Francisco
Colorado Springs
San Francisco
San Francisco
Colorado Springs
Colorado Springs
San Francisco
Colorado Springs
San Francisco
Colorado Springs
2018
104
60
0.35
N/A
11.3
N/A
23.4
N/A
0.012
N/A
N/A
N/A
11.9
6.3
0.4
N/A
2017
96
58
0.40
N/A
11.4
N/A
22.5
N/A
0.008
N/A
N/A
N/A
9.9
6.1
0.6
N/A
2016
68
48
0.39
N/A
10.6
N/A
22.4
N/A
0.005
N/A
N/A
N/A
7.9
6.9
0.8
N/A
2015
85
N/A
0.41
N/A
12.1
N/A
22.5
N/A
0.004
N/A
N/A
N/A
7.9
N/A
0.8
N/A
2014
85
N/A
0.38
N/A
12.1
N/A
21.8
N/A
0.005
N/A
N/A
N/A
7.7
N/A
0.6
N/A
2013
88
N/A
0.40
N/A
13.9
N/A
20.4
N/A
0.004
N/A
N/A
N/A
10.2
N/A
0.5
N/A
2012
75
N/A
0.40
N/A
12.8
N/A
22.7
N/A
0.003
N/A
N/A
N/A
8.2
N/A
1.1
N/A
2011
86
N/A
0.24
N/A
14.1
N/A
21.3
N/A
0.003
N/A
N/A
N/A
9.5
N/A
1.7
N/A
2010
84
N/A
0.21
N/A
13.4
N/A
22.0
N/A
0.004
N/A
N/A
N/A
10.6
N/A
1.0
N/A
2009
95
N/A
0.30
N/A
15.1
N/A
20.4
N/A
0.005
N/A
N/A
N/A
12.8
N/A
1.1
N/A
2008
94
N/A
0.43
N/A
15.6
N/A
21.7
N/A
0.007
N/A
N/A
N/A
11.7
N/A
0.9
N/A
2007
84
N/A
0.45
N/A
15.6
N/A
20.5
N/A
0.007
N/A
N/A
N/A
8.9
N/A
1.2
N/A
2006
86
15
0.52
0.50
16.1
N/A
21.5
N/A
N/A
0.005
N/A
N/A
8.7
N/A
1.6
N/A
2005
89
17
0.39
0.55
14.8
N/A
20.5
N/A
N/A
0.027
N/A
N/A
8.8
N/A
1.3
N/A
2004
93
17
0.44
0.56
16.1
N/A
20.9
N/A
0.004
0.010
N/A
N/A
11.2
N/A
2.5
N/A
2003
65
19
0.64
0.59
18.4
N/A
19.7
N/A
N/A
0.011
N/A
N/A
N/A
N/A
1.7
N/A
2002
62
24
0.69
0.66
18.6
N/A
19.6
N/A
0.008
0.010
N/A
N/A
N/A
N/A
1.4
N/A
2001
64
51
0.72
0.63
19.2
16.7
19.0
N/A
0.008
0.005
21.3
N/A
N/A
N/A
1.4
1.9
2000
60
78
0.71
0.58
20.3
22.5
17.1
N/A
0.017
0.010
21.0
N/A
N/A
N/A
2.0
2.3
Natural disasters
Type
San Francisco
Colorado Springs
Tornado activity compared to U.S. average
7.7%
78.4%
Earthquake activity compared to U.S. average
7,468.1%
816.1%
Natural disasters compared to U.S. average
6%
17%
Transportation
San Francisco has a comprehensive public transit system, including buses, subways, and ferries. Colorado Springs has the Mountain Metro Transit bus system, but many residents rely on cars for commuting.
Transport
Type
San Francisco
Colorado Springs
Amtrak stations
4
1
Amtrak stations nearby
3
1
FAA registered aircraft
453
552
FAA registered aircraft manufacturers and dealers
9
44
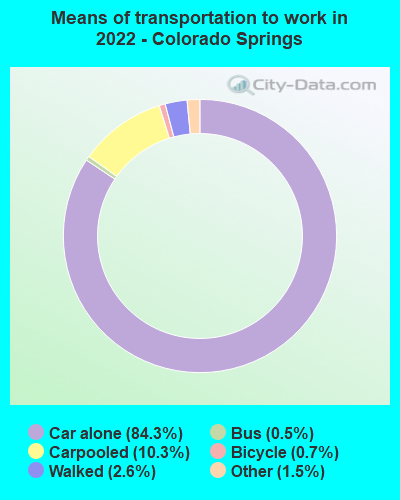
Means of transportation to work
Type
San Francisco
Colorado Springs
Bicycle
2.7%
0.3%
Bus
11.4%
0.4%
Carpooled
9.1%
9.2%
Car alone
53.9%
87%
Ferryboat
0.4%
0%
Motorcycle
0.9%
0.1%
Railroad
0.7%
0%
Streetcar
7.9%
0%
Subway
1.6%
0%
Taxicab
0.4%
0.1%
Walked
8.3%
2.1%
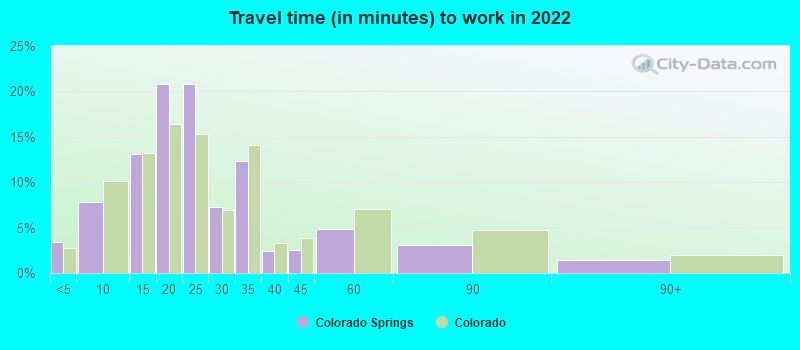
Average travel time to work
Type
San Francisco
Colorado Springs
Average
38 min
23.8 min
Other means
28.3 min
21.3 min
Public transportation
39.7 min
39 min
Private vehicle occupancy
Type
San Francisco
Colorado Springs
Average
1.2
1.1
Drove alone
85.5%
90%
In 2 person carpool
10.1%
7.5%
In 3 person carpool
3.2%
1.9%
In 4 person carpool
0.9%
0.2%
In 5-6 person carpool
0.2%
0.4%
In 7+ person carpool
0.1%
0.1%
How many people usually rode to work in the car, truck or van.
Real Estate
San Francisco has one of the priciest real-estate markets in the US. Colorado Springs, on the other hand, offers a more affordable housing market. However, prices have been rising due to increased demand and low inventory.
Neighborhoods
San Francisco's neighborhoods like Fisherman’s Wharf and The Castro are vibrant and diverse. Colorado Springs offers family-oriented neighborhoods with scenic views, such as Briargate and Broadmoor.
Houses and residents
Type
San Francisco
Colorado Springs
Houses
412,269
205,380
Average household size (people)
2.3
2.4
Median year apartment built
1953
1984
Median year house/condo built
1942
1987
Length of stay in the house since moving in
16.3 years
10.6 years
Houses occupied
350,796 (85.1%)
197,542 (96.2%)
Houses occupied by owners
140,809 (40.1%)
123,398 (62.5%)
Houses occupied by renters
209,987 (59.9%)
74,144 (37.5%)
Median rent asked for vacant for-rent units
$3,809
$1,458
Median monthly housing costs
$2,337
$1,422
Median price asked for vacant for-sale houses and condos
$1,670,841
$595,239
Estimated median house or condo value
Over $1,000,000
$390,500
Median numbers of rooms
3.9
6
Median number of rooms in apartments
3.2
4.1
Median number of rooms in houses and condos
5.6
7.2
Median house price - detached houses
Over $1,000,000
$427,641
Median house price - in 2-unit structures
Over $1,000,000
$389,381
Median house price - in 3-to-4-unit structures
Over $1,000,000
$295,560
Median house price - in 5 or more unit structures
Over $1,000,000
$258,564
Median house price - mobile homes
$517,939
$30,081
Median house price - Townhouses or other attached units
Over $1,000,000
$308,944
Median house price - All housing units
Over $1,000,000
$403,675
Median house age
76
35
Renting percentage
64.2%
39.9%
Housing density (houses/condos per square mile)
8,829.1
1,105.7
House value disparities
18.7%
25.2%
Household income disparities
41.7%
41%
Median household income for houses/condes with a mortgage
$210,544
$99,037
Median household income for apartments without a mortgage
$99,969
$72,581
Housing units without a mortgage
1,778 (1.9%)
1,835 (2.1%)
Housing units with both a second mortgage and home equity loan
7,687 (8.3%)
6,564 (7.3%)
Housing units with a mortgage
91,236 (98.1%)
87,580 (97.9%)
Housing units with a home equity loan
471 (0.5%)
86 (0.1%)
Housing units with a second mortgage
9,395 (10.1%)
7,898 (8.8%)
House/condo owner moved in on average (years ago)
14
7
House/condo renter moved in on average (years ago)
4
1
Housing units lacking complete kitchen facilities
4.7%
0.6%
Housing units lacking complete plumbing facilities
2.7%
0.3%
Housing units in structures
Housing units in structures
San Francisco
Colorado Springs
One, detached
19.1%
62.3%
One, attached
12.1%
8.3%
Two
9.0%
1.4%
3 or 4
11.4%
4.7%
5 to 9
9.0%
4.9%
10 to 19
9.3%
6.7%
20 to 49
11.3%
6.1%
50 or more
18.7%
4.0%
Mobile homes
0.1%
1.7%
Median real estate property taxes paid for housing units
Self-employed workers in own not incorporated business
30,288
13,110
State government workers
22,691
7,029
Unpaid family workers
399
735
Industries and Occupations
San Francisco is a global hub for the tech industry, while other major industries include finance, healthcare, and education. Colorado Springs has a diverse industrial landscape featuring defense and military, tech, education, and healthcare sectors.
Both cities provide high-level healthcare. San Francisco is renown for hospitals like UCSF Medical Center. Colorado Springs has top facilities like UCHealth Memorial Hospital Central, which is highly rated in several specialties.
Health (county statistics)
Type
San Francisco
Colorado Springs
General health status score of residents in this county from 1 (poor) to 5 (excellent)
San Francisco is known for its iconic structures like the Golden Gate Bridge and its comprehensive public transportation system. Colorado Springs has a well-developed infrastructure, including roads and public transportation but lacks wider coverage of public transit compared to San Francisco.
Infrastructure
Type
San Francisco
Colorado Springs
Hospitals
16
10
TV stations
18
18
Arenas or stadiums
2
3
Bank branches located here
281
133
Bank institutions located here
52
33
Main business address for public companies
68
6
Drinking water stations with no reported violations in the past
5
6
Drinking water stations with reported violations in the past
HMDA - Conventional home purchase loans - Applications denied
Year
San Francisco
Colorado Springs
1999
1,402
1,957
2000
1,000
985
2001
733
756
2002
870
502
2003
1,576
1,131
2004
2,147
1,811
2005
2,344
2,631
2006
2,511
2,188
2007
2,117
1,246
2008
1,575
496
2009
952
233
Culture and Food
San Francisco offers a diverse cultural scene, with world-renowned restaurants, an active arts scene, and various cultural institutions. Colorado Springs has a vibrant cultural life as well and is known for its outdoor recreational activities.
Sports Teams
San Francisco has multiple professional sports teams, including the 49ers (NFL) and the Giants (MLB). While Colorado Springs doesn't have its own pro teams, Denver's teams like the Broncos (NFL), the Nuggets (NBA), and the Rockies (MLB) have a strong following in the Springs.


 San Francisco, CA
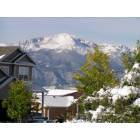
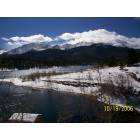
 Colorado Springs, CO