Understanding the differences between living in San Francisco, CA and Aurora, CO can be crucial for potential residents and tourists alike as both cities offer unique opportunities and challenges. From crime and safety to culture and food, this comparison will cover essential aspects of life in both cities. By comparing these areas, one can make a more informed decision about where to settle down or visit, whether considering job opportunities, cost of living, or other lifestyle factors like climate.
Distance between
San Francisco, CA and
Aurora, CO : 958.0 miles
San Francisco's population is larger by 109%. Its population has grown by 38,468 people (5.0%) since 2000. The population of Aurora has grown by 112,954 people (40.9%) during that time.
San Francisco, being a larger and more populous city, tends to have a higher crime rate than Aurora. While the city invests heavily in public safety, its dense population and urban environment can lead to higher levels of both property and violent crime. On the other hand, Aurora shows lower crime rates overall but does have neighborhoods with higher-than-average crime rates. Both cities prioritize public safety and have substantial police and community outreach programs.
City-data.com crime index counts serious crimes and violent crime more heavily. It adjusts for the number of visitors and daily workers commuting into cities. (higher means more crime, U.S. average = 301.1)
City-data.com crime index counts serious crimes and violent crime more heavily. It adjusts for the number of visitors and daily workers commuting into cities. (higher means more crime, U.S. average = 301.1)
Sex Offenders
According to our data, there are 830 registered sex offenders living in San Francisco and 1,044 registered sex offenders living in . The ratio of residents to sex offenders in San Francisco is 1,049 to 1; the ratio in Aurora is 347 to 1. The number of registered sex offenders compared to the number of residents is a lot smaller in San Francisco than in Aurora.
Cost of Living
The cost of living in San Francisco is significantly higher than in Aurora, especially regarding housing. Besides housing, groceries, health care, utilities and transportation also tend to have a considerable price tag in San Francisco. Aurora, being a smaller and less densely populated city, offers a significantly lower cost of living, with a more affordable housing market and lower overall expenses.
Income Tax
Both California and Colorado have state income taxes. However, California's income tax is progressive, with rates ranging from 1% to 13.3%, while Colorado employs a flat tax rate of 4.63% regardless of income.
Property Tax
Property taxes in both areas are close to the national average. San Francisco's property tax is in line with the overall California rate, while Aurora falls within the Colorado standard rate.
Sales Tax
Sales tax in San Francisco is higher than Aurora's. The combined city and state sales tax in San Francisco is currently set at 8.5%, whereas, in Aurora, it's noticeably lower at 4.75%.
Income
Type
San Francisco
Aurora
Estimated median household income
$121,826
$71,647
Estimated per capita income
$80,383
$35,054
Cost of living index (U.S. average is 100)
141.1
109.4
If you make $50,000 in Aurora, you will have to make $64,488 in San Francisco to maintain the same standard of living.
Geographical Conditions
San Francisco is on the Pacific coast, characterized by its hilly landscape and infamous fog. Aurora, located in the Denver metro area, features a more dry, semi-arid climate with surrounding mountains.
Both cities take pride in their high-quality education systems, but there are a few differences. San Francisco is home to several world-renowned universities and a range of private and public schools. Aurora's education sector, most significantly, its public school system, receives high marks for academic performance, but it doesn't boast the same breadth of higher education institutions as San Francisco.
San Francisco boasts a robust economy with strong representation in industries like technology, finance, and tourism. Aurora's economy is not as diverse, but it's growing significantly with key sectors like healthcare, retail trade, and manufacturing. Both cities have low unemployment rates, but average salaries tend to be higher in San Francisco due to the cost of living and industry concentration.
Biggest Employers
The City and County of San Francisco, Salesforce, and Wells Fargo are among the city's biggest employers. Aurora's major employers include the University of Colorado Hospital, Aurora Public Schools, and Buckley Air Force Base.
In San Francisco (San Francisco County), 83.5% voted for Democrats and 13.0% for Republicans in 2012 Presidential Election. In Aurora (Adams County), 57.3% voted for Democrats and 40.4% for Republicans.
Elections
Type
Democrats
Republicans
Other
Year
San Francisco
Aurora
San Francisco
Aurora
San Francisco
Aurora
2020
85.3%
57.1%
12.7%
40.7%
2.0%
2.2%
2016
84.6%
50.1%
9.2%
41.6%
6.2%
8.3%
2012
83.5%
57.3%
13.0%
40.4%
3.4%
2.3%
2008
84.4%
58.5%
13.7%
40.1%
2.0%
1.4%
2004
83.0%
50.7%
15.2%
48.4%
1.8%
0.9%
2000
75.7%
50.3%
16.1%
44.2%
8.1%
5.5%
1996
72.2%
51.3%
15.7%
38.9%
12.1%
9.8%
Breakdown of population affiliated with a religious congregation
Type
Adherents
Congregations
Religion
San Francisco
Aurora
San Francisco
Aurora
CATHOLIC CHURCH
15.0%
16.0%
9.6%
4.5%
EPISCOPAL CHURCH
0.8%
0.1%
3.5%
1.2%
MUSLIM ESTIMATE
0.8%
0.1%
1.2%
0.8%
SOUTHERN BAPTIST CONVENTION
0.7%
0.7%
8.4%
7.8%
AMERICAN BAPTIST CHURCHES IN THE USA
0.6%
0.0%
2.5%
0.4%
EVANGELICAL LUTHERAN CHURCH IN AMERICA
0.2%
0.4%
1.7%
2.5%
LUTHERAN CHURCH
0.2%
0.7%
1.5%
3.3%
SEVENTH DAY ADVENTIST CHURCH
0.2%
0.4%
1.9%
3.3%
Weather
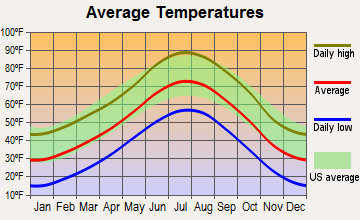
The weather in San Francisco and Aurora is quite different. San Francisco is known for its mild, foggy weather with cool, dry summers and mild, rainy winters. Aurora, on the other hand, has a semi-arid climate with hot summers and cold, snowy winters, which can be ideal for tourists looking for winter sports opportunities.
Weather and climate
Type
San Francisco
Aurora
Temperature - Average
58.3°F
49.9°F
Humidity - Average morning or afternoon humidity
84.3%
50.6%
Humidity - Differences between morning and afternoon humidity
29%
20%
Humidity - Maximum monthly morning or afternoon humidity
91%
55%
Humidity - Minimum monthly morning or afternoon humidity
62%
35%
Precipitation - Yearly average
22.2 in
16.9 in
Snowfall - Yearly average
0 in
114 in
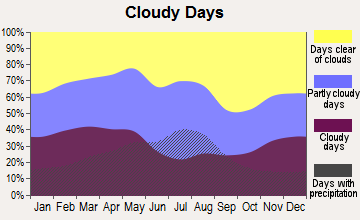
Clouds - Number of days clear of clouds
26.8%
19.2%
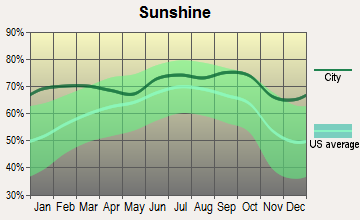
Sunshine amount - Average
73%
75.6%
Sunshine amount - Differences during a year
22%
10%
Sunshine amount - Maximum monthly
77%
74%
Sunshine amount - Minimum monthly
55%
64%
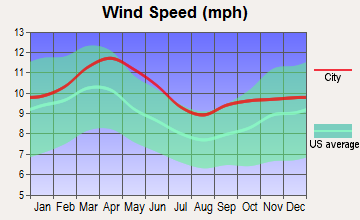
Wind speed - Average
11.4 mph
8.6 mph
Average climate in San Francisco, California
Average climate in Aurora, Colorado
Air pollution
Type
AQI
CO
NO2
OZONE
PB
PM10
PM25
SO2
Year
San Francisco
Aurora
San Francisco
Aurora
San Francisco
Aurora
San Francisco
Aurora
San Francisco
Aurora
Aurora
San Francisco
Aurora
San Francisco
Aurora
2018
104
99
0.35
0.37
11.3
21.5
23.4
31.3
0.012
N/A
29.2
N/A
11.9
8.5
0.4
0.7
2017
96
95
0.40
0.37
11.4
21.9
22.5
31.1
0.008
N/A
22.0
N/A
9.9
8.5
0.6
0.9
2016
68
90
0.39
0.42
10.6
24.0
22.4
30.7
0.005
N/A
22.6
N/A
7.9
8.1
0.8
1.0
2015
85
101
0.41
0.44
12.1
22.8
22.5
29.5
0.004
N/A
20.6
N/A
7.9
9.5
0.8
1.1
2014
85
94
0.38
0.42
12.1
21.8
21.8
29.6
0.005
N/A
22.5
N/A
7.7
10.1
0.6
1.3
2013
88
84
0.40
0.39
13.9
19.6
20.4
29.9
0.004
N/A
21.9
N/A
10.2
N/A
0.5
1.4
2012
75
90
0.40
0.35
12.8
18.9
22.7
30.8
0.003
N/A
24.2
N/A
8.2
N/A
1.1
1.2
2011
86
91
0.24
0.34
14.1
18.1
21.3
30.9
0.003
N/A
23.8
N/A
9.5
N/A
1.7
1.5
2010
84
81
0.21
0.41
13.4
16.3
22.0
28.8
0.004
N/A
26.6
N/A
10.6
N/A
1.0
1.0
2009
95
79
0.30
0.37
15.1
14.1
20.4
27.1
0.005
0.005
22.6
N/A
12.8
N/A
1.1
1.3
2008
94
85
0.43
0.41
15.6
17.3
21.7
28.8
0.007
0.008
25.5
N/A
11.7
N/A
0.9
1.6
2007
84
96
0.45
0.42
15.6
20.6
20.5
25.4
0.007
0.007
28.8
N/A
8.9
N/A
1.2
1.2
2006
86
89
0.52
0.50
16.1
19.0
21.5
25.0
N/A
0.027
28.0
N/A
8.7
N/A
1.6
1.4
2005
89
86
0.39
0.57
14.8
21.3
20.5
22.5
N/A
0.109
29.6
N/A
8.8
N/A
1.3
1.5
2004
93
82
0.44
0.61
16.1
21.2
20.9
21.4
0.004
0.037
28.6
N/A
11.2
N/A
2.5
1.8
2003
65
106
0.64
0.62
18.4
21.2
19.7
23.1
N/A
0.040
32.6
N/A
N/A
N/A
1.7
1.9
2002
62
86
0.69
0.64
18.6
19.2
19.6
22.8
0.008
0.028
35.7
N/A
N/A
N/A
1.4
2.5
2001
64
95
0.72
0.79
19.2
24.0
19.0
20.4
0.008
0.030
32.6
N/A
N/A
N/A
1.4
2.6
2000
60
93
0.71
0.77
20.3
13.8
17.1
21.4
0.017
0.033
12.2
N/A
N/A
N/A
2.0
2.1
Natural disasters
Type
San Francisco
Aurora
Tornado activity compared to U.S. average
7.7%
138.7%
Earthquake activity compared to U.S. average
7,468.1%
796.4%
Natural disasters compared to U.S. average
6%
11%
Transportation
San Francisco's public transportation includes buses, trains, and the famous cable cars, making it easy to get around without a car. In contrast, Aurora is more car-dependent, although it does have access to the Denver area's light rail system.
Transport
Type
San Francisco
Aurora
Amtrak stations
4
0
Amtrak stations nearby
3
2
FAA registered aircraft
453
138
FAA registered aircraft manufacturers and dealers
9
19
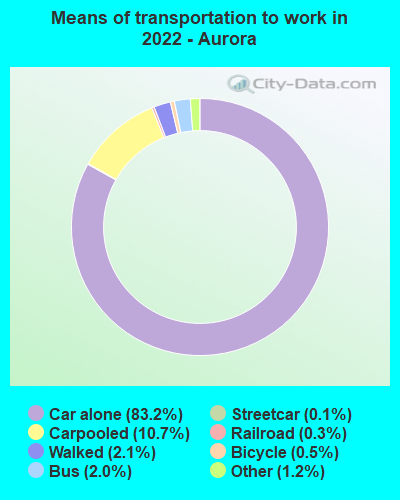
Means of transportation to work
Type
San Francisco
Aurora
Bicycle
2.7%
0.6%
Bus
11.4%
1.7%
Carpooled
9.1%
9.3%
Car alone
53.9%
84.4%
Ferryboat
0.4%
0%
Motorcycle
0.9%
0.1%
Railroad
0.7%
0.1%
Streetcar
7.9%
0%
Subway
1.6%
0.1%
Taxicab
0.4%
0%
Walked
8.3%
2.5%
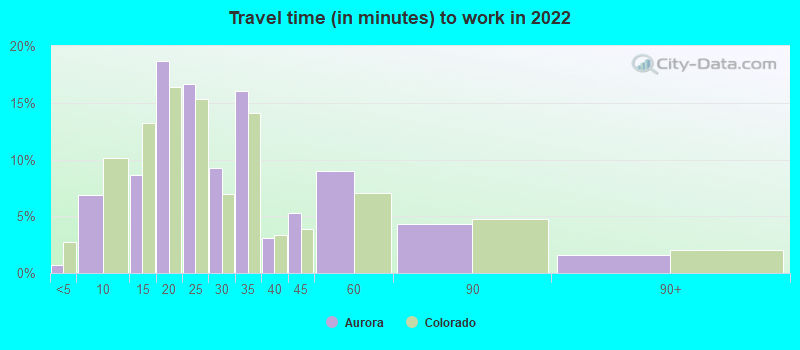
Average travel time to work
Type
San Francisco
Aurora
Average
38 min
28.3 min
Other means
28.3 min
26.9 min
Public transportation
39.7 min
50.5 min
Private vehicle occupancy
Type
San Francisco
Aurora
Average
1.2
1.2
Drove alone
85.5%
85.1%
In 2 person carpool
10.1%
10%
In 3 person carpool
3.2%
2.8%
In 4 person carpool
0.9%
1.5%
In 5-6 person carpool
0.2%
0.3%
In 7+ person carpool
0.1%
0.2%
How many people usually rode to work in the car, truck or van.
Real Estate
Real estate in San Francisco is exceedingly expensive, with a median home value significantly higher than the national average. On the other hand, real estate in Aurora is more modest, making homeownership an achievable goal for many more residents.
Neighborhoods
San Francisco's neighborhoods are distinct and well-identified, each offering unique cultural experiences and living environments. Aurora's neighborhoods are more suburban in nature, offering family-friendly environments with lower population density.
Houses and residents
Type
San Francisco
Aurora
Houses
412,269
149,636
Average household size (people)
2.3
2.7
Median year apartment built
1953
1986
Median year house/condo built
1942
1984
Length of stay in the house since moving in
16.3 years
10.4 years
Houses occupied
350,796 (85.1%)
140,003 (93.6%)
Houses occupied by owners
140,809 (40.1%)
89,615 (64%)
Houses occupied by renters
209,987 (59.9%)
50,388 (36%)
Median rent asked for vacant for-rent units
$3,809
$2,036
Median monthly housing costs
$2,337
$1,526
Median price asked for vacant for-sale houses and condos
$1,670,841
$725,445
Estimated median house or condo value
Over $1,000,000
$411,400
Median numbers of rooms
3.9
5.5
Median number of rooms in apartments
3.2
3.9
Median number of rooms in houses and condos
5.6
6.5
Median house price - detached houses
Over $1,000,000
$500,029
Median house price - in 2-unit structures
Over $1,000,000
$384,060
Median house price - in 3-to-4-unit structures
Over $1,000,000
$254,381
Median house price - in 5 or more unit structures
Over $1,000,000
$231,026
Median house price - mobile homes
$517,939
$130,226
Median house price - Townhouses or other attached units
Over $1,000,000
$471,483
Median house price - All housing units
Over $1,000,000
$476,379
Median house age
76
36
Renting percentage
64.2%
40.1%
Housing density (houses/condos per square mile)
8,829.1
1,050.1
House value disparities
18.7%
23.6%
Household income disparities
41.7%
41.5%
Median household income for houses/condes with a mortgage
$210,544
$99,433
Median household income for apartments without a mortgage
$99,969
$63,316
Housing units without a mortgage
1,778 (1.9%)
424 (0.6%)
Housing units with both a second mortgage and home equity loan
7,687 (8.3%)
5,246 (7.8%)
Housing units with a mortgage
91,236 (98.1%)
66,791 (99.4%)
Housing units with a home equity loan
471 (0.5%)
176 (0.3%)
Housing units with a second mortgage
9,395 (10.1%)
6,860 (10.2%)
House/condo owner moved in on average (years ago)
14
7
House/condo renter moved in on average (years ago)
4
1
Housing units lacking complete kitchen facilities
4.7%
1%
Housing units lacking complete plumbing facilities
2.7%
0.6%
Housing units in structures
Housing units in structures
San Francisco
Aurora
One, detached
19.1%
52.6%
One, attached
12.1%
11.9%
Two
9.0%
0.2%
3 or 4
11.4%
4.2%
5 to 9
9.0%
7.1%
10 to 19
9.3%
11.0%
20 to 49
11.3%
5.5%
50 or more
18.7%
5.7%
Mobile homes
0.1%
1.7%
Median real estate property taxes paid for housing units
Self-employed workers in own not incorporated business
30,288
13,677
State government workers
22,691
5,134
Unpaid family workers
399
0
Industries and Occupations
San Francisco is home to major tech companies which dominate the job market. Aurora, however, has a well-diversified economy with jobs in health care, government services, and defence among the leading industries. While tech sector jobs are prevalent in both cities, San Francisco offers more opportunities in this field.
Both San Francisco and Aurora are known for their health care facilities. San Francisco especially stands out due to its world-class hospitals and outstanding access to most types of specialized care.
Health (county statistics)
Type
San Francisco
Aurora
General health status score of residents in this county from 1 (poor) to 5 (excellent)
San Francisco has a mature and well-developed infrastructure that caters to its dense population, including several bridges, airports, and well-maintained roads. Aurora, while not as dense or large, still has a good infrastructure system for its residents, including an expanding public transit system and good road and highway access to Denver and surrounding areas.
Infrastructure
Type
San Francisco
Aurora
Hospitals
16
4
TV stations
18
15
Bank branches located here
281
77
Bank institutions located here
52
19
Main business address for public companies
68
1
Drinking water stations with no reported violations in the past
5
1
Drinking water stations with reported violations in the past
HMDA - Conventional home purchase loans - Applications denied
Year
San Francisco
Aurora
1999
1,402
1,737
2000
1,000
1,460
2001
733
1,056
2002
870
635
2003
1,576
1,276
2004
2,147
2,052
2005
2,344
3,087
2006
2,511
2,880
2007
2,117
1,693
2008
1,575
782
2009
952
302
Culture and Food
San Francisco is well-known for its cultural diversity, which is mirrored in its food scene. Aurora also offers a variety of restaurants serving various cuisines reflective of its diverse population.
Sports Teams
San Francisco is home to well-known teams such as the San Francisco 49ers (NFL) and Giants (MLB). Aurora, lacking its own major sports teams, is closely located to Denver, which provides residents access to a variety of professional sports teams.


 San Francisco, CA
 Aurora, CO