San Diego, CA, and Urban Honolulu, HI are two city-strongholds that offer a unique blend of cultural, economic, and lifestyle charms. While San Diego enchants with its beautiful weather, ample job opportunities, and engaging sports culture, Urban Honolulu is an island paradise known for its laid-back lifestyle, breathtaking scenery, and an unparalleled island culture. This comparison aims to dissect both these cities in terms of living and visiting, providing a detailed perspective on crime/safety, climate, living costs, education system and more.
San Diego, CA is one of the safer cities in the US when compared to others of similar size, although like all cities, specific neighborhoods may present more significant challenges. On the other hand, Urban Honolulu also maintains a reasonably low crime rate relative to similar urban areas, although it suffers from property crimes, primarily due to the large tourist population.
Cost of Living
The cost of living in both San Diego and Honolulu is high in comparison with the national average. However, Honolulu's housing is particularly expensive, whereas, in San Diego, other costs like utilities and groceries contribute more significantly to the overall cost of living.
Income Tax
In California, income tax can range from 1% to 13.3%, depending on your income bracket. In Hawaii, income tax rates range from 1.4% to 11% also based on income level.
Property Tax
Property tax rates in both San Diego and Honolulu are relatively low compared to other cities in the U.S. San Diego's rate is approximately 0.76%, while Honolulu's can go as low as 0.31%.
Sales Tax
California's state sales tax is 7.25%, but San Diego adds an additional 0.75%, leading to a total sales tax of 8%. In contrast, Honolulu has a General Excise Tax (GET) of 4.712%; unlike sales tax, GET applies to all transactions and services.
Income
Type
San Diego
Urban Honolulu
Estimated median household income
$93,042
$90,704
Estimated per capita income
$48,380
$39,573
Cost of living index (U.S. average is 100)
126.4
128.3
If you make $50,000 in San Diego, you will have to make $50,752 in Urban Honolulu to maintain the same standard of living.
Geographical Conditions
Young mountain ranges, desert areas, and a sun-soaked coastline defines San Diego topographically. Honolulu, on the other hand, is a tropical paradise with majestic mountains, lush green rainforests, and pristine beaches.
San Diego boasts of excellent public and private schools and prestigious universities like the University of California, San Diego, and San Diego State University. Honolulu also has solid educational choices with the University of Hawaii leading the pack. Both places are educational drawcards for domestic and international students.
San Diego's economy is diverse, with a strong presence in the defense, tourism, international trade, and manufacturing sectors. Conversely, Honolulu's economy heavily relies on tourism, alongside military defense and agriculture.
Biggest Employers
In San Diego, some of the significant employers are the Navy, University of California, Qualcomm, and Scripps Health. In contrast, the State of Hawaii, Hawaiian Airlines, the University of Hawaii, and Hilton Hawaiian Village form the major employers in Honolulu.
In San Diego (San Diego County), 52.6% voted for Democrats and 45.0% for Republicans in 2012 Presidential Election. In Urban Honolulu (Honolulu County), 68.9% voted for Democrats and 29.8% for Republicans.
Elections
Type
Democrats
Republicans
Other
Year
San Diego
Urban Honolulu
San Diego
Urban Honolulu
San Diego
Urban Honolulu
2020
60.3%
62.7%
37.5%
35.8%
2.1%
1.5%
2016
56.3%
61.5%
36.6%
31.6%
7.1%
6.9%
2012
52.6%
68.9%
45.0%
29.8%
2.4%
1.3%
2008
54.2%
70.1%
44.0%
28.8%
1.8%
1.1%
2004
46.7%
51.1%
52.9%
48.3%
0.4%
0.6%
2000
45.8%
54.6%
49.8%
39.6%
4.5%
5.7%
1996
44.1%
56.3%
45.6%
33.6%
10.3%
10.1%
Breakdown of population affiliated with a religious congregation
Type
Adherents
Congregations
Religion
San Diego
Urban Honolulu
San Diego
Urban Honolulu
CATHOLIC CHURCH
25.9%
18.2%
6.7%
5.2%
SOUTHERN BAPTIST CONVENTION
1.1%
1.5%
12.0%
9.7%
MUSLIM ESTIMATE
0.7%
0.0%
1.1%
0.1%
SEVENTH DAY ADVENTIST CHURCH
0.5%
0.5%
2.0%
2.6%
EPISCOPAL CHURCH
0.4%
0.5%
2.0%
2.7%
EVANGELICAL LUTHERAN CHURCH IN AMERICA
0.4%
0.2%
2.0%
1.1%
LUTHERAN CHURCH
0.4%
0.1%
2.2%
0.8%
Weather
Weather-wise, San Diego enjoys mild, warm climates year-round making it a haven for outdoorsy types and sun-lovers. In contrast, Honolulu also has a tropical climate, with warmer temperatures and heavier rainfall. However, various microclimates on the island can provide a refreshing break from the city heat.
Weather and climate
Type
San Diego
Urban Honolulu
Temperature - Average
64.4°F
74.7°F
Humidity - Average morning or afternoon humidity
74%
70.5%
Humidity - Differences between morning and afternoon humidity
22%
27%
Humidity - Maximum monthly morning or afternoon humidity
80%
79%
Humidity - Minimum monthly morning or afternoon humidity
58%
52%
Precipitation - Yearly average
11 in
58.7 in
Snowfall - Yearly average
0 in
0 in
Clouds - Number of days clear of clouds
24.3%
14.9%
Sunshine amount - Average
74.8%
71%
Sunshine amount - Differences during a year
19%
19%
Sunshine amount - Maximum monthly
75%
75%
Sunshine amount - Minimum monthly
56%
56%
Wind speed - Average
6.9 mph
11.1 mph
Average climate in San Diego, California
Air pollution
Type
AQI
CO
NO2
OZONE
PB
PM10
PM25
SO2
Year
San Diego
Urban Honolulu
San Diego
Urban Honolulu
San Diego
Urban Honolulu
San Diego
Urban Honolulu
San Diego
Urban Honolulu
San Diego
Urban Honolulu
San Diego
Urban Honolulu
San Diego
Urban Honolulu
2018
101
43
0.53
0.44
11.2
3.9
32.6
25.8
0.007
N/A
N/A
12.8
10.5
3.8
0.1
0.1
2017
115
46
0.63
0.49
12.7
4.4
32.7
24.8
0.007
N/A
N/A
11.9
10.8
3.5
0.1
0.4
2016
105
46
0.46
0.59
13.0
3.9
30.4
24.8
0.006
N/A
N/A
13.7
11.4
3.2
0.1
0.3
2015
111
53
0.43
0.53
13.2
3.5
29.9
24.0
0.005
N/A
N/A
11.7
11.9
4.5
0.1
0.4
2014
105
45
0.44
0.41
11.6
3.4
31.1
21.6
0.007
N/A
N/A
13.3
11.1
4.6
0.1
1.2
2013
138
53
0.50
0.41
12.4
3.0
27.4
26.4
0.019
N/A
N/A
12.0
12.3
5.6
0.2
1.1
2012
110
58
0.53
0.32
12.7
2.9
28.0
24.7
0.019
N/A
N/A
12.4
13.6
5.6
0.2
0.6
2011
122
57
0.51
0.38
13.5
2.9
29.0
28.4
0.034
N/A
N/A
12.8
14.0
6.1
1.5
0.6
2010
109
68
0.52
0.38
14.0
3.4
29.3
N/A
0.019
0.002
N/A
N/A
13.9
5.9
1.0
1.1
2009
121
58
0.64
0.42
15.6
4.3
26.9
N/A
0.014
0.003
N/A
N/A
15.1
5.8
2.7
0.7
2008
127
19
0.71
0.45
16.1
4.2
28.4
N/A
N/A
0.002
67.3
N/A
N/A
N/A
2.6
0.6
2007
157
23
0.71
0.52
16.4
4.7
28.0
N/A
0.012
0.001
64.6
N/A
N/A
N/A
2.8
0.5
2006
123
21
0.81
0.24
18.9
4.9
27.1
N/A
0.056
0.003
64.8
N/A
N/A
N/A
3.4
1.1
2005
112
19
0.90
0.42
19.2
5.0
24.4
N/A
0.049
0.001
N/A
N/A
N/A
N/A
3.7
0.7
2004
120
18
0.93
0.60
18.4
4.8
25.9
N/A
0.055
0.001
N/A
N/A
N/A
N/A
4.6
0.5
2003
124
21
0.88
0.62
19.4
4.7
25.4
N/A
0.049
0.002
N/A
N/A
N/A
N/A
3.8
0.5
2002
125
19
0.86
0.64
20.9
4.9
25.9
N/A
0.039
N/A
N/A
N/A
N/A
N/A
3.6
0.9
2001
132
21
0.93
0.62
20.4
4.5
26.5
N/A
0.048
N/A
N/A
N/A
N/A
N/A
3.4
0.7
2000
134
21
1.02
0.68
22.3
4.9
23.8
N/A
0.054
N/A
N/A
N/A
N/A
N/A
3.6
0.4
Natural disasters
Type
San Diego
Urban Honolulu
Tornado activity compared to U.S. average
6.7%
3.7%
Earthquake activity compared to U.S. average
5,835%
1,250.1%
Natural disasters compared to U.S. average
39%
16%
Transportation
San Diego offers extensive public transit options with buses and a light rail system. Honolulu depends more heavily on the bus system, with a large number of residents also opting for private vehicles. Commute times in both cities may be affected by rush-hour traffic.
Transport
Type
San Diego
Urban Honolulu
Amtrak stations
1
0
Amtrak stations nearby
2
0
FAA registered aircraft
852
0
FAA registered aircraft manufacturers and dealers
33
0
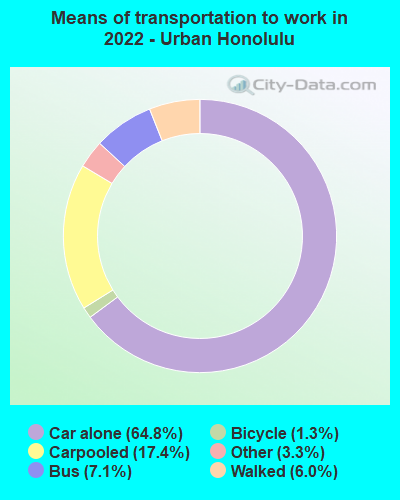
Means of transportation to work
Type
San Diego
Urban Honolulu
Bicycle
0.6%
0.9%
Bus
2%
6.3%
Carpooled
9.4%
15.5%
Car alone
81.7%
69.3%
Ferryboat
0.1%
0%
Motorcycle
0.3%
0%
Railroad
0.5%
0%
Walked
3.6%
5.4%
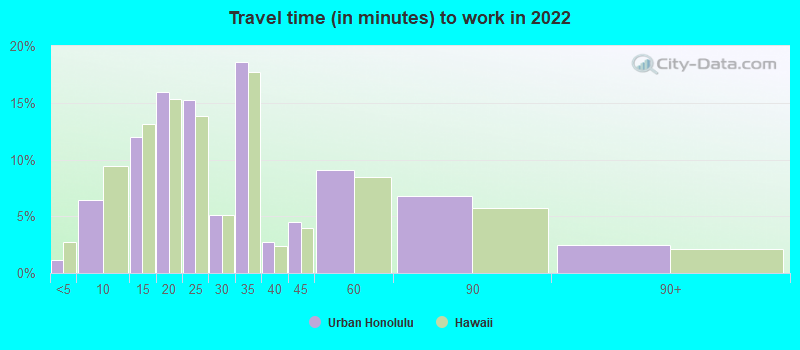
Average travel time to work
Type
San Diego
Urban Honolulu
Average
27.4 min
29.3 min
Private vehicle occupancy
Type
San Diego
Urban Honolulu
Average
1.2
1.3
Drove alone
89.5%
78.5%
In 2 person carpool
7.6%
16.2%
In 3 person carpool
1.8%
2.9%
In 4 person carpool
0.4%
1.6%
In 5-6 person carpool
0.5%
0.8%
In 7+ person carpool
0.2%
0%
How many people usually rode to work in the car, truck or van.
Real Estate
San Diego's real estate market is competitive with a mix of single-family homes, condos, and high-rise apartments. Honolulu, given its island location, has a limited land area and thus, high property prices, mostly dominated by condos and high-rise apartments.
Neighborhoods
Both cities offer diverse neighborhoods. In San Diego, one finds historical regions like the Gaslamp Quarter, beachfront districts like La Jolla. Honolulu offers beachfront communities like Waikiki, historic districts like Iolani Palace, and quiet residential areas like Manoa.
Houses and residents
Type
San Diego
Urban Honolulu
Houses
555,456
157,427
Average household size (people)
2.6
2.5
Median year apartment built
1980
1974
Median year house/condo built
1977
1973
Length of stay in the house since moving in
14.1 years
16.7 years
Houses occupied
521,000 (93.8%)
138,398 (87.9%)
Houses occupied by owners
251,507 (48.3%)
68,458 (49.5%)
Houses occupied by renters
269,493 (51.7%)
69,940 (50.5%)
Median rent asked for vacant for-rent units
$2,096
$1,712
Median monthly housing costs
$2,044
$1,665
Median price asked for vacant for-sale houses and condos
$957,871
$238,020
Estimated median house or condo value
$768,800
$781,600
Median numbers of rooms
4.6
3.8
Median house price - detached houses
Over $1,000,000
Over $1,000,000
Median house price - in 2-unit structures
Over $1,000,000
$940,827
Median house price - in 3-to-4-unit structures
$529,375
$766,061
Median house price - in 5 or more unit structures
$543,091
$539,250
Median house price - mobile homes
$134,064
Over $1,000,000
Median house price - Townhouses or other attached units
$696,014
Over $1,000,000
Median house price - All housing units
$941,291
$941,281
Median house age
42
47
Renting percentage
51.7%
56.2%
House value disparities
23.6%
27%
Household income disparities
42.3%
45%
Median household income for houses/condes with a mortgage
$138,584
$117,430
Median household income for apartments without a mortgage
$97,588
$69,945
Housing units without a mortgage
2,803 (1.6%)
1,696 (4.1%)
Housing units with both a second mortgage and home equity loan
12,495 (6.9%)
6,219 (15.1%)
Housing units with a mortgage
177,643 (98.4%)
39,383 (95.9%)
Housing units with a home equity loan
694 (0.4%)
319 (0.8%)
Housing units with a second mortgage
16,654 (9.2%)
7,901 (19.2%)
House/condo owner moved in on average (years ago)
11
14
House/condo renter moved in on average (years ago)
1
3
Housing units lacking complete kitchen facilities
0.8%
2.6%
Housing units lacking complete plumbing facilities
0.3%
0.8%
Housing units in structures
Housing units in structures
San Diego
Urban Honolulu
One, detached
43.4%
26.2%
One, attached
9.9%
7.2%
Two
1.9%
2.4%
3 or 4
6.0%
3.3%
5 to 9
9.3%
5.2%
10 to 19
7.4%
6.2%
20 to 49
6.3%
11.4%
50 or more
14.6%
38.0%
Mobile homes
1.0%
0.1%
Median real estate property taxes paid for housing units
Self-employed workers in own not incorporated business
39,709
10,949
State government workers
29,438
19,544
Unpaid family workers
808
446
Industries and Occupations
In San Diego, the primary industries are defense/military, tourism, international trade, and research. For Honolulu, the tourism industry is the key driver, followed by military defense and agriculture.
Both cities have high-quality healthcare. San Diego is home to world-renowned institutions like the UC San Diego Health, while Honolulu boasts the highly-rated Queen's Medical Center.
Health (county statistics)
Type
San Diego
Urban Honolulu
General health status score of residents in this county from 1 (poor) to 5 (excellent)
Both cities have a developed infrastructure, but San Diego, being on the mainland, has more robust connections in terms of roads, railways, airports, and public utilities. Honolulu, being an island city, has limitations but offers well-maintained airports, roads, and public utilities with unique aspects such as ferry services.
Infrastructure
Type
San Diego
Urban Honolulu
TV stations
13
15
Culture and Food
San Diego's cultural and food scenes are vibrant, influenced by its Mexican heritage. Honolulu offers a unique blend of Polynesian, Asian, and American cultures, translating into a rich culinary scene and diverse cultural traditions.
Sports Teams
San Diego is passionate about sports with NBA’s San Diego Clippers and NFL's Chargers as major draws. In Honolulu, the University of Hawaii's teams hold residents' attention, as there are no major professional sports teams.


 San Diego, CA and
  Urban Honolulu, HI : 2,608.3 miles