San Diego, California, and St. Louis, Missouri, offer unique and contrasting living experiences in the United States. From climate differences to divergent cultural experiences, each city has aspects that may appeal to different individuals' preferences. San Diego is a city characterized by its beautiful coastal scenery, a strong economy and a diverse cultural scene. St. Louis, on the other hand, is known for its historic architecture, thriving local culture and lower cost of living. Both cities offer remarkable experiences for residents and tourists alike but provide different lifestyles.
Distance between
San Diego, CA and
St. Louis, MO : 1,556.3 miles
San Diego's population is larger by 371%. Its population has grown by 158,211 people (12.9%) since 2000. The population of St. Louis has decreased by 54,879 people (15.8%) during that time.
Crime rates in both San Diego and St. Louis are a crucial factor to consider. San Diego enjoys a relatively lower crime rate, making it one of the safer big cities in the US. Conversely, St. Louis has been grappling with higher crime rates, especially violent crimes, affecting residents' safety. It is worth noting that safety can vary by neighborhood in both cities, and an active community-policing initiative is in place in both cities to mitigate these issues.
City-data.com crime index counts serious crimes and violent crime more heavily. It adjusts for the number of visitors and daily workers commuting into cities. (higher means more crime, U.S. average = 301.1)
City-data.com crime index counts serious crimes and violent crime more heavily. It adjusts for the number of visitors and daily workers commuting into cities. (higher means more crime, U.S. average = 301.1)
Sex Offenders
According to our data, there are 1,386 registered sex offenders living in San Diego and 2,536 registered sex offenders living in . The ratio of residents to sex offenders in San Diego is 1,015 to 1; the ratio in St. Louis is 123 to 1. The number of registered sex offenders compared to the number of residents is a lot smaller in San Diego than in St. Louis.
Cost of Living
Cost of living is a major point of difference between the two cities. Living in San Diego is significantly more expensive, with high housing costs being the primary driver. Conversely, St. Louis has a substantially lower cost of living, with affordable housing options contributing to this affordability.
Income Tax
On income tax, California has several tax rates ranging from 1% to 13.3% based on income level. Missouri also operates on a progressive tax system, with tax brackets starting at 1.5% and going up to 5.4% on income. Therefore, high earners would pay a larger percentage of their income tax in San Diego than in St. Louis.
Property Tax
Property taxes are a significant factor in both cities, but you will pay less in St. Louis. The average property tax rate in San Diego County is around 0.76%, while in St. Louis, the average rate is approximately 1% but properties are generally less expensive.
Sales Tax
The total sales tax in San Diego is higher than in St. Louis due to California's higher state tax. California's state sales tax is 7.25%, with San Diego adding a district tax to total 8.75%. Missouri's state sales tax is 4.225%, with St. Louis adding local taxes for a total of 8.679%.
Income
Type
San Diego
St. Louis
Estimated median household income
$93,042
$49,965
Estimated per capita income
$48,380
$33,810
Cost of living index (U.S. average is 100)
126.4
96.5
If you make $50,000 in St. Louis, you will have to make $65,492 in San Diego to maintain the same standard of living.
Geographical Conditions
San Diego enjoys stunning coastal views, beautiful beaches, and is close to mountain and desert landscapes. Contrastingly, St. Louis is in the heartland of America, featuring a blend of plains and low mountains known as foothills. It has beautiful parks and proximity to rivers, providing an array of outdoor activities.
Both cities pride themselves on their education systems, but in different ways. San Diego is home to prestigious universities like the University of California, San Diego and San Diego State University. St. Louis also has renowned educational institutions, including Washington University in St. Louis and St. Louis University. Each city offers excellent public and private K-12 schools.
San Diego's economy is diversified, with significant sectors including biotechnology, healthcare, international trade, military defense, and tourism. In contrast, St. Louis' economy depends more on service industries, manufacturing, and trade. Both cities have a relatively stable job market, though job growth in San Diego is faster due to its ties with the tech industry.
Biggest Employers
San Diego's largest employers are the federal government due to its military bases, followed by the University of California, San Diego, and healthcare providers such as Sharp Healthcare. On the other hand, St. Louis' largest employers include BJC HealthCare, Washington University, and Boeing Defense, Space & Security.
There were 539 building permits issued in San Diego in 2012 (88 more than in 2011) compared to 146 building permits issued in St. Louis in 2012 (105 more than in 2011).
In San Diego (San Diego County), 52.6% voted for Democrats and 45.0% for Republicans in 2012 Presidential Election. In St. Louis (St. Louis city), 82.4% voted for Democrats and 15.9% for Republicans.
Elections
Type
Democrats
Republicans
Other
Year
San Diego
St. Louis
San Diego
St. Louis
San Diego
St. Louis
2020
60.3%
82.4%
37.5%
16.1%
2.1%
1.6%
2016
56.3%
79.0%
36.6%
15.8%
7.1%
5.2%
2012
52.6%
82.4%
45.0%
15.9%
2.4%
1.6%
2008
54.2%
83.8%
44.0%
15.5%
1.8%
0.7%
2004
46.7%
80.4%
52.9%
19.2%
0.4%
0.3%
2000
45.8%
77.5%
49.8%
19.9%
4.5%
2.6%
1996
44.1%
74.8%
45.6%
18.1%
10.3%
7.1%
Breakdown of population affiliated with a religious congregation
Type
Adherents
Congregations
Religion
San Diego
St. Louis
San Diego
St. Louis
CATHOLIC CHURCH
25.9%
15.4%
6.7%
9.5%
SOUTHERN BAPTIST CONVENTION
1.1%
2.5%
12.0%
9.0%
MUSLIM ESTIMATE
0.7%
1.1%
1.1%
2.4%
SEVENTH DAY ADVENTIST CHURCH
0.5%
0.3%
2.0%
0.5%
EPISCOPAL CHURCH
0.4%
0.5%
2.0%
1.5%
EVANGELICAL LUTHERAN CHURCH IN AMERICA
0.4%
0.2%
2.0%
1.0%
LUTHERAN CHURCH
0.4%
2.2%
2.2%
6.1%
AMERICAN BAPTIST CHURCHES IN THE USA
0.1%
1.8%
1.5%
2.4%
Weather
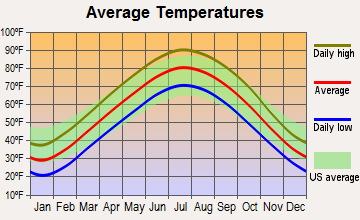
San Diego boasts near-perfect weather year-round, with mild winters and warm, sunny summers making it ideal for outdoor activities. On the other hand, St. Louis experiences a wider range of weather extremes, with hot, humid summers and chilly winters. St. Louis also experiences a fair share of tornadoes annually due to its Midwest location.
Weather and climate
Type
San Diego
St. Louis
Temperature - Average
64.4°F
56.5°F
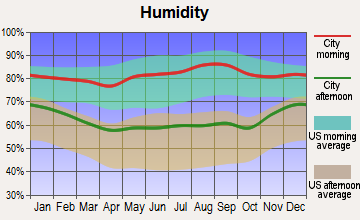
Humidity - Average morning or afternoon humidity
74%
74.8%
Humidity - Differences between morning and afternoon humidity
22%
32%
Humidity - Maximum monthly morning or afternoon humidity
80%
85%
Humidity - Minimum monthly morning or afternoon humidity
58%
53%
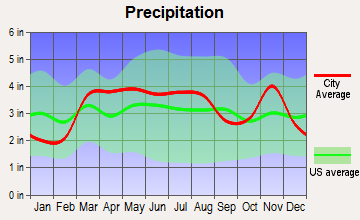
Precipitation - Yearly average
11 in
39 in
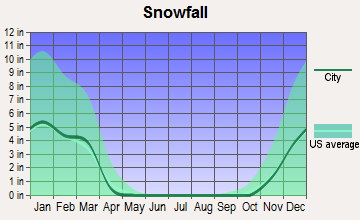
Snowfall - Yearly average
0 in
37.2 in
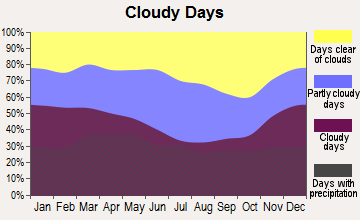
Clouds - Number of days clear of clouds
24.3%
16.7%
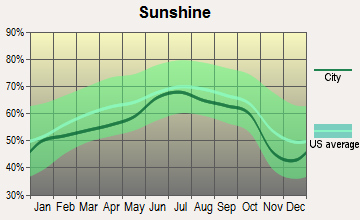
Sunshine amount - Average
74.8%
62.2%
Sunshine amount - Differences during a year
19%
30%
Sunshine amount - Maximum monthly
75%
71%
Sunshine amount - Minimum monthly
56%
41%
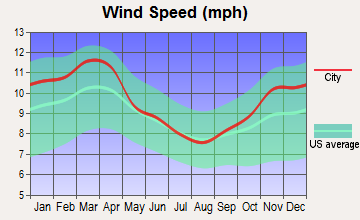
Wind speed - Average
6.9 mph
9.8 mph
Average climate in San Diego, California
Average climate in St. Louis, Missouri
Air pollution
Type
AQI
CO
NO2
OZONE
PB
PM10
PM25
SO2
Year
San Diego
St. Louis
San Diego
St. Louis
San Diego
St. Louis
San Diego
St. Louis
San Diego
St. Louis
San Diego
St. Louis
San Diego
St. Louis
San Diego
St. Louis
2018
101
101
0.53
0.26
11.2
10.7
32.6
27.5
0.007
N/A
N/A
19.7
10.5
9.8
0.1
0.8
2017
115
90
0.63
0.25
12.7
10.4
32.7
28.5
0.007
N/A
N/A
16.2
10.8
8.0
0.1
1.4
2016
105
96
0.46
0.29
13.0
11.1
30.4
25.8
0.006
N/A
N/A
15.5
11.4
8.5
0.1
1.2
2015
111
97
0.43
0.28
13.2
11.8
29.9
22.2
0.005
N/A
N/A
16.6
11.9
10.5
0.1
1.6
2014
105
97
0.44
0.27
11.6
12.2
31.1
25.5
0.007
N/A
N/A
17.8
11.1
10.5
0.1
1.8
2013
138
92
0.50
0.27
12.4
12.2
27.4
26.2
0.019
N/A
N/A
16.3
12.3
10.6
0.2
2.1
2012
110
114
0.53
0.27
12.7
14.4
28.0
27.9
0.019
N/A
N/A
17.5
13.6
10.2
0.2
2.3
2011
122
107
0.51
0.27
13.5
13.2
29.0
27.0
0.034
N/A
N/A
17.3
14.0
12.4
1.5
2.7
2010
109
110
0.52
0.31
14.0
12.8
29.3
23.1
0.019
N/A
N/A
16.2
13.9
12.9
1.0
3.3
2009
121
101
0.64
0.31
15.6
12.5
26.9
22.2
0.014
0.039
N/A
21.6
15.1
12.4
2.7
2.8
2008
127
98
0.71
0.32
16.1
12.9
28.4
22.9
N/A
0.054
67.3
32.4
N/A
12.8
2.6
2.6
2007
157
125
0.71
0.37
16.4
14.1
28.0
24.3
0.012
0.055
64.6
38.8
N/A
14.6
2.8
2.9
2006
123
109
0.81
0.38
18.9
15.2
27.1
23.3
0.056
0.044
64.8
38.2
N/A
14.7
3.4
3.1
2005
112
110
0.90
0.39
19.2
16.3
24.4
24.4
0.049
0.056
N/A
41.4
N/A
N/A
3.7
4.1
2004
120
92
0.93
0.49
18.4
20.0
25.9
19.6
0.055
0.013
N/A
38.3
N/A
N/A
4.6
3.7
2003
124
106
0.88
0.49
19.4
19.6
25.4
21.7
0.049
0.044
N/A
37.8
N/A
N/A
3.8
3.7
2002
125
117
0.86
0.56
20.9
21.7
25.9
21.1
0.039
0.022
N/A
45.4
N/A
N/A
3.6
4.4
2001
132
100
0.93
0.57
20.4
22.4
26.5
20.4
0.048
0.057
N/A
46.6
N/A
N/A
3.4
5.0
2000
134
98
1.02
0.78
22.3
23.8
23.8
20.6
0.054
0.057
N/A
N/A
N/A
N/A
3.6
5.5
Natural disasters
Type
San Diego
St. Louis
Tornado activity compared to U.S. average
6.7%
182.4%
Earthquake activity compared to U.S. average
5,835%
413.3%
Natural disasters compared to U.S. average
39%
0%
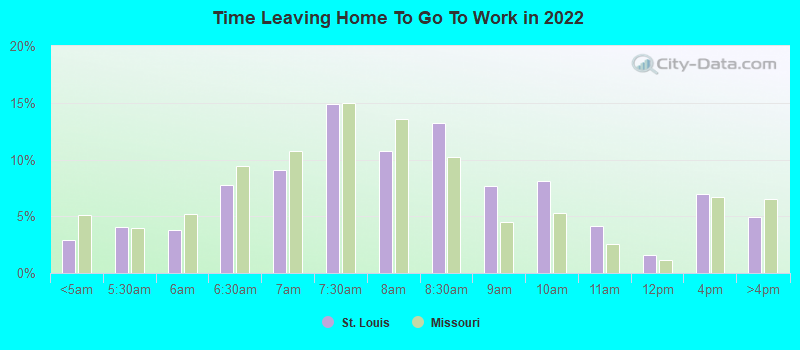
Transportation
Both San Diego and St. Louis have well-established public transportation systems. San Diego’s transportation includes the San Diego Trolley light rail system, buses, and ferry services. St. Louis provides MetroLink light rail service and extensive bus coverage. However, due to extensive spread, a car is often essential in both cities for daily commuting.
Transport
Type
San Diego
St. Louis
Amtrak stations
1
1
Amtrak stations nearby
2
2
FAA registered aircraft
852
0
FAA registered aircraft manufacturers and dealers
33
0
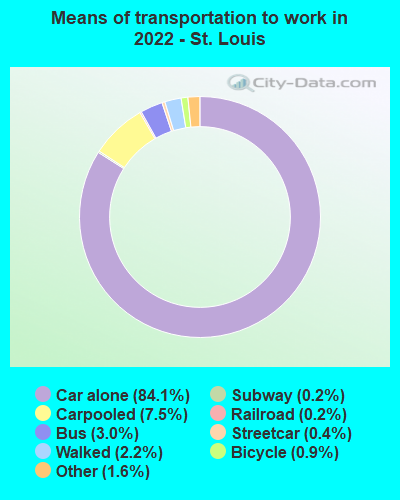
Means of transportation to work
Type
San Diego
St. Louis
Bicycle
0.6%
0.5%
Bus
2%
3.7%
Carpooled
9.4%
7.5%
Car alone
81.7%
83.9%
Ferryboat
0.1%
0%
Motorcycle
0.3%
0.1%
Railroad
0.5%
0.3%
Streetcar
0%
0.2%
Subway
0.1%
0.3%
Taxicab
0.1%
0.3%
Walked
3.6%
2.5%
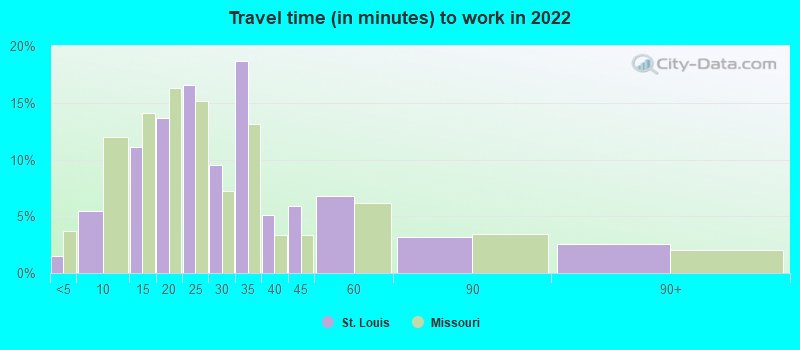
Average travel time to work
Type
San Diego
St. Louis
Average
27.4 min
29.4 min
Other means
22.7 min
22.9 min
Public transportation
45.7 min
42.8 min
Private vehicle occupancy
Type
San Diego
St. Louis
Average
1.2
1.1
Drove alone
89.5%
91.6%
In 2 person carpool
7.6%
6.5%
In 3 person carpool
1.8%
1%
In 4 person carpool
0.4%
0.1%
In 5-6 person carpool
0.5%
0.1%
In 7+ person carpool
0.2%
0.7%
How many people usually rode to work in the car, truck or van.
Real Estate
Real estate in San Diego is significantly more expensive, with both rental and buying prices above the national average. Conversely, St. Louis offers more affordable housing options, with real estate prices well below the national average. This affordability combined with historic charm makes it appealing to newcomers and investors.
Neighborhoods
San Diego is known for its appealing seaside neighborhoods and suburban communities. La Jolla and Mission Beach are popular for their luxury homes and proximity to the sea. In St. Louis, historic neighborhoods like Central West End and Lafayette Square are favored for their walkable streets and charming older homes.
Houses and residents
Type
San Diego
St. Louis
Houses
555,456
173,493
Average household size (people)
2.6
2.2
Median year apartment built
1980
1943
Length of stay in the house since moving in
14.1 years
14.2 years
Houses occupied
521,000 (93.8%)
139,736 (80.5%)
Houses occupied by owners
251,507 (48.3%)
63,653 (45.6%)
Houses occupied by renters
269,493 (51.7%)
76,083 (54.4%)
Median rent asked for vacant for-rent units
$2,096
$923.98
Median monthly housing costs
$2,044
$883
Median price asked for vacant for-sale houses and condos
$957,871
$56,913
Estimated median house or condo value
$768,800
$170,800
Median numbers of rooms
4.6
4.8
Median number of rooms in apartments
3.7
4
Median number of rooms in houses and condos
5.9
5.9
Median house price - detached houses
Over $1,000,000
$196,007
Median house price - in 2-unit structures
Over $1,000,000
$166,673
Median house price - in 3-to-4-unit structures
$529,375
$155,363
Median house price - in 5 or more unit structures
$543,091
$260,843
Median house price - mobile homes
$134,064
$35,054
Median house price - Townhouses or other attached units
$696,014
$272,667
Median house price - All housing units
$941,291
$200,041
Median house age
42
2,021
Renting percentage
51.7%
54.6%
Housing density (houses/condos per square mile)
1,712.6
2,801.7
House value disparities
23.6%
38.7%
Household income disparities
42.3%
48.3%
Median household income for houses/condes with a mortgage
$138,584
$87,762
Median household income for apartments without a mortgage
$97,588
$55,824
Housing units without a mortgage
2,803 (1.6%)
1,236 (2.9%)
Housing units with both a second mortgage and home equity loan
12,495 (6.9%)
2,537 (6%)
Housing units with a mortgage
177,643 (98.4%)
41,018 (97.1%)
Housing units with a home equity loan
694 (0.4%)
188 (0.4%)
Housing units with a second mortgage
16,654 (9.2%)
3,349 (7.9%)
House/condo owner moved in on average (years ago)
11
10
House/condo renter moved in on average (years ago)
1
2
Housing units lacking complete kitchen facilities
0.8%
9.2%
Housing units lacking complete plumbing facilities
0.3%
5.8%
Housing units in structures
Housing units in structures
San Diego
St. Louis
One, detached
43.4%
43.2%
One, attached
9.9%
4.1%
Two
1.9%
14.2%
3 or 4
6.0%
13.5%
5 to 9
9.3%
4.9%
10 to 19
7.4%
2.2%
20 to 49
6.3%
3.8%
50 or more
14.6%
13.5%
Mobile homes
1.0%
0.5%
Median real estate property taxes paid for housing units
Self-employed workers in own not incorporated business
39,709
8,126
State government workers
29,438
2,962
Unpaid family workers
808
315
Industries and Occupations
San Diego has a robust high-tech industry, including telecommunications, biotechnology, software, and defense technology. St. Louis has a diverse employment base with growth in healthcare, financial services, and logistics. The trade, transportation, and utilities sector is also significant here.
San Diego has some top-ranked hospitals, including UC San Diego Health, Scripps La Jolla Hospitals, and Naval Medical Center. St. Louis isn’t far behind with Barnes-Jewish Hospital and St. Louis Children's Hospital that are nationally recognized. Both cities provide quality healthcare options for their residents.
Health (county statistics)
Type
San Diego
St. Louis
General health status score of residents in this county from 1 (poor) to 5 (excellent)
San Diego boasts well-developed infrastructure, with plentiful amenities and modern conventions and trade centers like the San Diego Convention Center. Its location on the Pacific coast also makes it a significant port city. In St. Louis, infrastructures such as transportation and connectivity have seen substantial improvements, and the city is a significant transportation hub in the Midwest.
HMDA - Conventional home purchase loans - Applications denied
Year
San Diego
St. Louis
1999
3,865
0
2000
2,257
0
2001
1,754
0
2002
2,118
0
2003
5,074
1,583
2004
7,646
2,101
2005
8,409
2,853
2006
7,551
3,391
2007
5,741
2,022
2008
2,876
841
2009
1,675
247
Culture and Food
San Diego's culture is heavily influenced by its coastal location and proximity to Mexico, leading to a unique Californian coastal and Hispanic heritage that is reflected in its cuisine. Seafood and Mexican cuisine dominate here. St. Louis boasts barbecue and a wide variety of ethnic cuisines. It is also home to several cultural institutions, including art museums, zoo, and the St. Louis Symphony Orchestra.
Sports Teams
In sports, San Diego is home to the San Diego Padres (MLB) and previously the Chargers (NFL). St. Louis, known as a passionate sports city, boasts the St. Louis Cardinals (MLB) and the Blues (NHL). Both cities offer robust sports communities for both spectators and participants.


 San Diego, CA
 St. Louis, MO