San Diego, CA, and South Coast, CA both offer distinct living experiences. Each city has unique charms, safety characteristics, educational opportunities, and economic considerations. With a temperate climate, diverse careers, quality healthcare, and a vibrant culture, both cities appeal to both tourists and potential residents. Yet, each city carries distinct factors across different factors like crime rates, tax rates, main industries, and more.
In terms of safety, San Diego is considered relatively safe for a city of its size, with a lower crime rate than the national average. Neighbourhoods such as La Jolla and Del Mar have particularly low crime rates. South Coast, in contrast, experiences higher crime rates, particularly in areas like Santa Ana and Anaheim. Nonetheless, many of its neighbourhoods, like Newport Beach and Laguna Beach, are considered safe.
Cost of Living
Living in San Diego is relatively more expensive than in South Coast, primarily due to housing costs. South Coast has a slightly less expensive cost of living, though it is still higher than the national average. Both areas have high healthcare and transportation costs relative to the rest of the country.
Income Tax
Income taxes in both San Diego and South Coast are based on the state’s tax system. California has a progressive income tax system ranging from 1% to 13.3%, depending on your income level.
Property Tax
Property tax in San Diego is approximately 0.76%, which is lower than the state average of 0.77%. South Coast's property tax rate is similar at around 0.72%, but can vary slightly depending on the specific local rates.
Sales Tax
San Diego has a higher sales tax than South Coast, standing currently at 7.75%. South Coast's sales tax is generally lower, but varies depending on the specific area, staying around 7.75%.
Income
Type
San Diego
South Coast
Estimated median household income
$93,042
$112,870
Estimated per capita income
$48,380
$68,453
Cost of living index (U.S. average is 100)
126.4
96.8
If you make $50,000 in South Coast, you will have to make $65,289 in San Diego to maintain the same standard of living.
Geographical Conditions
San Diego benefits from its coastal location with numerous beaches, bays, and hiking-friendly mountain ranges. South Coast's geography is similar, with sandy coastlines, rolling hills, and beautiful landscapes providing plenty of beaches and outdoor recreational activities.
Geographical information
Type
San Diego
South Coast
Land area
324.3 sq. miles
101 sq. miles
Population density
4,259.7 people per sq. mile
2,953.2 people per sq. mile
Relative area comparison
San Diego, CA South Coast, CA
Education
San Diego has an extensive education network, with several esteemed institutions like University of California, San Diego, and San Diego State University. In South Coast, the education system is well-regarded, with many top-rated schools and colleges, including University of California, Irvine. Both regions have diverse options for primary through tertiary education.
San Diego has a robust economy with major industries being military, tourism, international trade, and manufacturing. South Coast's economy relies heavily on sectors like healthcare, technology, and real estate. Both offer a wide range of occupational opportunities, though job opportunities could vary depending on the specific industry.
Biggest Employers
San Diego's largest employers are the US Navy, UC San Diego, and Sharp Healthcare. In South Coast, top employers include Boeing, UC Irvine, and Disneyland Resort. These employers play a significant role in driving both regions' economies.
In San Diego (San Diego County), 52.6% voted for Democrats and 45.0% for Republicans in 2012 Presidential Election. In South Coast (Orange County), 45.8% voted for Democrats and 52.0% for Republicans.
Elections
Type
Democrats
Republicans
Other
Year
San Diego
South Coast
San Diego
South Coast
San Diego
South Coast
2020
60.3%
53.6%
37.5%
44.6%
2.1%
1.8%
2016
56.3%
50.9%
36.6%
42.4%
7.1%
6.7%
2012
52.6%
45.8%
45.0%
52.0%
2.4%
2.3%
2008
54.2%
47.8%
44.0%
50.3%
1.8%
1.9%
2004
46.7%
39.3%
52.9%
60.2%
0.4%
0.5%
2000
45.8%
40.4%
49.8%
55.9%
4.5%
3.7%
1996
44.1%
37.9%
45.6%
51.7%
10.3%
10.5%
Breakdown of population affiliated with a religious congregation
Type
Adherents
Congregations
Religion
San Diego
South Coast
San Diego
South Coast
CATHOLIC CHURCH
25.9%
26.5%
6.7%
4.4%
SOUTHERN BAPTIST CONVENTION
1.1%
2.3%
12.0%
8.8%
MUSLIM ESTIMATE
0.7%
0.8%
1.1%
1.3%
SEVENTH DAY ADVENTIST CHURCH
0.5%
0.4%
2.0%
1.3%
EPISCOPAL CHURCH
0.4%
0.4%
2.0%
1.4%
EVANGELICAL LUTHERAN CHURCH IN AMERICA
0.4%
0.4%
2.0%
2.3%
LUTHERAN CHURCH
0.4%
0.6%
2.2%
2.0%
REFORMED CHURCH IN AMERICA
0.0%
0.3%
0.1%
0.2%
Weather
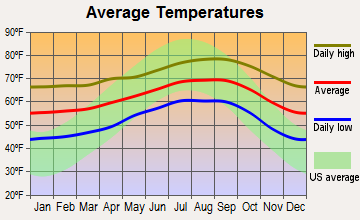
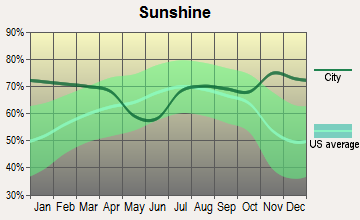
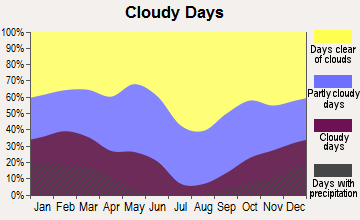
Both San Diego and South Coast boast mild, Mediterranean-style climates that attract many visitors and residents. San Diego is known for its year-round sunny weather, while South Coast experiences similar weather with slightly more rainfall. Both areas get cool in the winter months, but don't see snow.
Weather and climate
Type
San Diego
South Coast
Temperature - Average
64.4°F
62.1°F
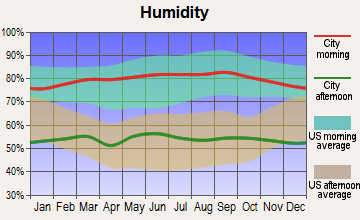
Humidity - Average morning or afternoon humidity
74%
69.1%
Humidity - Differences between morning and afternoon humidity
22%
24.6%
Humidity - Maximum monthly morning or afternoon humidity
80%
77%
Humidity - Minimum monthly morning or afternoon humidity
58%
52.4%
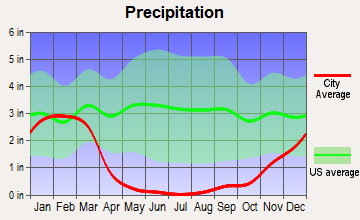
Precipitation - Yearly average
11 in
13.4 in
Snowfall - Yearly average
0 in
0 in
Clouds - Number of days clear of clouds
24.3%
26.7%
Sunshine amount - Average
74.8%
77.6%
Sunshine amount - Differences during a year
19%
20.5%
Sunshine amount - Maximum monthly
75%
81.9%
Sunshine amount - Minimum monthly
56%
61.4%
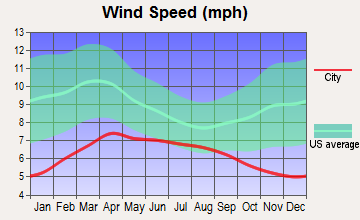
Wind speed - Average
6.9 mph
5.5 mph
Average climate in San Diego, California
Average climate in South Coast, California
Air pollution
Type
AQI
CO
NO2
OZONE
PB
PM10
PM25
SO2
Year
San Diego
South Coast
San Diego
South Coast
San Diego
South Coast
San Diego
South Coast
San Diego
San Diego
South Coast
San Diego
South Coast
San Diego
South Coast
2018
101
105
0.53
0.18
11.2
8.6
32.6
34.0
0.007
N/A
N/A
22.7
10.5
7.0
0.1
N/A
2017
115
111
0.63
0.21
12.7
8.4
32.7
34.7
0.007
N/A
N/A
23.0
10.8
11.3
0.1
N/A
2016
105
105
0.46
0.14
13.0
9.6
30.4
33.8
0.006
N/A
N/A
21.9
11.4
9.8
0.1
0.1
2015
111
111
0.43
0.10
13.2
10.5
29.9
32.9
0.005
N/A
N/A
19.4
11.9
10.5
0.1
0.1
2014
105
100
0.44
0.11
11.6
9.8
31.1
31.3
0.007
N/A
N/A
25.4
11.1
11.8
0.1
0.3
2013
138
97
0.50
0.17
12.4
10.6
27.4
30.0
0.019
N/A
N/A
24.5
12.3
10.3
0.2
0.2
2012
110
101
0.53
0.26
12.7
10.1
28.0
29.9
0.019
N/A
N/A
21.5
13.6
10.5
0.2
0.1
2011
122
113
0.51
0.15
13.5
10.2
29.0
30.3
0.034
N/A
N/A
24.0
14.0
10.9
1.5
0.3
2010
109
101
0.52
0.21
14.0
10.9
29.3
30.6
0.019
N/A
N/A
23.3
13.9
11.4
1.0
0.6
2009
121
120
0.64
0.15
15.6
13.0
26.9
31.5
0.014
N/A
N/A
27.3
15.1
12.4
2.7
1.1
2008
127
131
0.71
0.26
16.1
13.2
28.4
32.0
N/A
N/A
67.3
38.8
N/A
9.4
2.6
1.1
2007
157
110
0.71
0.24
16.4
13.7
28.0
30.6
0.012
N/A
64.6
N/A
N/A
N/A
2.8
0.8
2006
123
112
0.81
0.30
18.9
14.8
27.1
30.6
0.056
N/A
64.8
N/A
N/A
N/A
3.4
1.3
2005
112
109
0.90
0.28
19.2
13.7
24.4
29.9
0.049
N/A
N/A
N/A
N/A
N/A
3.7
1.3
2004
120
130
0.93
0.29
18.4
15.5
25.9
32.5
0.055
N/A
N/A
N/A
N/A
N/A
4.6
1.6
2003
124
132
0.88
0.38
19.4
18.2
25.4
31.3
0.049
N/A
N/A
N/A
N/A
N/A
3.8
1.1
2002
125
129
0.86
0.40
20.9
17.7
25.9
28.4
0.039
N/A
N/A
N/A
N/A
N/A
3.6
1.6
2001
132
137
0.93
0.52
20.4
18.5
26.5
27.8
0.048
N/A
N/A
N/A
N/A
N/A
3.4
1.4
2000
134
140
1.02
0.52
22.3
21.2
23.8
24.5
0.054
N/A
N/A
N/A
N/A
N/A
3.6
1.9
Natural disasters
Type
San Diego
South Coast
Tornado activity compared to U.S. average
6.7%
17.1%
Earthquake activity compared to U.S. average
5,835%
6,728.5%
Natural disasters compared to U.S. average
39%
32%
Transportation
San Diego has an efficient public transportation system including buses, shuttles, and trolleys. However, owning a vehicle might still be necessary as the city is large and spread out. South Coast is well-equipped with transit systems, but like San Diego, a car could be beneficial for greater mobility.
Transport
Type
San Diego
South Coast
Amtrak stations
1
0
Amtrak stations nearby
2
3
FAA registered aircraft
852
0
FAA registered aircraft manufacturers and dealers
33
0
Means of transportation to work
Type
San Diego
South Coast
Bicycle
0.6%
0.3%
Bus
2%
1%
Carpooled
9.4%
10.5%
Car alone
81.7%
79.2%
Ferryboat
0.1%
0%
Motorcycle
0.3%
0.2%
Railroad
0.5%
0.4%
Walked
3.6%
1.7%
Average travel time to work
Type
San Diego
South Coast
Average
27.4 min
27.9 min
Real Estate
San Diego's real estate market is high, with a wide variety of housing options. Renting and buying can be expensive, especially in sought-after neighborhoods. South Coast has a diverse housing market, from luxury beachfront properties to more affordable inland homes, but it is generally less expensive than San Diego.
Neighborhoods
San Diego has a diverse range of neighborhoods, from the seaside charm of La Jolla to the historic Gaslamp Quarter downtown. South Coast includes desirable locations like the cultural hub of Irvine and beachfront Newport. Each area has unique appeal, depending on individual preferences.
Houses and residents
Type
San Diego
South Coast
Houses
555,456
124,031
Average household size (people)
2.6
2.5
Houses occupied
521,000 (93.8%)
117,093 (94.4%)
Houses occupied by owners
251,507 (48.3%)
81,601 (69.7%)
Houses occupied by renters
269,493 (51.7%)
35,492 (30.3%)
Median rent asked for vacant for-rent units
$2,096
$2,718
Median price asked for vacant for-sale houses and condos
$957,871
$1,099,558
Estimated median house or condo value
$768,800
Over $1,000,000
Median number of rooms in apartments
3.7
3.9
Median number of rooms in houses and condos
5.9
5.1
Renting percentage
51.7%
33.8%
Housing density (houses/condos per square mile)
1,712.6
1,227.5
Household income disparities
42.3%
38.1%
Housing units without a mortgage
2,803 (1.6%)
10,715 (16.4%)
Housing units with both a second mortgage and home equity loan
12,495 (6.9%)
248 (0.4%)
Housing units with a mortgage
177,643 (98.4%)
54,674 (83.6%)
Housing units with a home equity loan
694 (0.4%)
5,859 (9%)
Housing units with a second mortgage
16,654 (9.2%)
7,560 (11.6%)
Housing units lacking complete kitchen facilities
0.8%
0.8%
Housing units lacking complete plumbing facilities
Self-employed workers in own not incorporated business
39,709
17,244
State government workers
29,438
4,403
Unpaid family workers
808
640
Industries and Occupations
San Diego is home to large military and defense companies, as well as biotech and healthcare firms. Tourism is also a primary industry. South Coast features an array of industries, including information technology, finance, and entertainment. Professionals in these industries often find a wealth of opportunities in these respective areas.
San Diego and South Coast both offer reputable healthcare systems. San Diego hosts renowned healthcare institutions like the UC San Diego Health. South Coast, too, is home to quality healthcare resources, such as the UC Irvine Health system. Both locations advocate healthy lifestyle, thanks to easily accessible outdoor activities.
Health (county statistics)
Type
San Diego
South Coast
General health status score of residents in this county from 1 (poor) to 5 (excellent)
San Diego has a well-developed infrastructure with highways, airports, seaports, and public transit systems. In South Coast, the infrastructure is also well-established, with a convenient freeway system and numerous airports. Both areas provide a range of amenities for residents and tourists alike.
Infrastructure
Type
San Diego
South Coast
TV stations
13
1
Nuclear power plants nearby
0
2
Culture and Food
San Diego offers a diverse cultural scene with a vibrant nightlife, music, theater, and world-renowned craft beer industry. Known for its Mexican and seafood cuisine, it's a food lover’s paradise. South Coast also features a rich culture with beach-centric lifestyles and diverse culinary scene, heavily influenced by Asian and International cuisines.
Sports Teams
San Diego hosts the Padres (MLB) and the Gulls (AHL). South Coast does not have any major league sports teams, but sports enthusiast can catch games in nearby LA. Both areas offer numerous opportunities for recreational sports and outdoor activities due to their coastal locations.
 San Diego, CA
 South Coast, CA