San Diego and Santa Ana are two prominent cities in California, each offering a distinct living experience. In considering aspects like crime, safety, cost of living, education, and the economy, one can see stark contrasts between the cities. These differences also extend to each city's infrastructure, industries, neighborhoods, transportation, and overall quality of life. Understandably, prospective residents and tourists may want to weigh their options and consider which city aligns more with their lifestyle and needs.
Distance between
San Diego, CA and
Santa Ana, CA : 78.8 miles
San Diego's population is larger by 347%. Its population has grown by 158,211 people (12.9%) since 2000. The population of Santa Ana has decreased by 28,536 people (8.4%) during that time.
When it comes to crime and safety, San Diego has lower crime rates compared to Santa Ana. According to FBI crime report data, San Diego's crime rate is marginally lower than the national average, making it safer for both residents and tourists. Conversely, Santa Ana's crime rates are significantly higher, with both property and violent crimes exceeding the national average. This distinction makes safety a critical factor for people considering a move to either city.
City-data.com crime index counts serious crimes and violent crime more heavily. It adjusts for the number of visitors and daily workers commuting into cities. (higher means more crime, U.S. average = 301.1)
City-data.com crime index counts serious crimes and violent crime more heavily. It adjusts for the number of visitors and daily workers commuting into cities. (higher means more crime, U.S. average = 301.1)
Sex Offenders
According to our data, there are 1,386 registered sex offenders living in San Diego and 425 registered sex offenders living in . The ratio of residents to sex offenders in San Diego is 1,015 to 1; the ratio in Santa Ana is 786 to 1. The number of registered sex offenders compared to the number of residents is a smaller in San Diego than in Santa Ana.
Cost of Living
Understandably, the cost of living in Southern California is higher than the national average, but there are substantial differences between San Diego and Santa Ana. San Diego is considered significantly more expensive, particularly in terms of housing, which could deter potential residents. Contrastingly, Santa Ana is cheaper, with a lower housing index, although still pricier than many other U.S. cities to reside.
Income Tax
Both cities fall under California's progressive income tax system, with rates ranging from 1% to 13.3% based on income levels. This means residents in both San Diego and Santa Ana will face the same income tax rates.
Property Tax
In terms of property tax, both cities share California's average property tax rate of 0.76%. However, given that home values tend to be higher in San Diego, homeowners in San Diego may end up paying more in property taxes than those in Santa Ana.
Sales Tax
California's state-wide sales tax rate is 7.25%. However, with additional city and county taxes, San Diego's total sales tax is 7.75%, while Santa Ana's is higher at 9.25%.
Income
Type
San Diego
Santa Ana
Estimated median household income
$93,042
$80,265
Estimated per capita income
$48,380
$26,691
Cost of living index (U.S. average is 100)
126.4
88.6
If you make $50,000 in Santa Ana, you will have to make $71,332 in San Diego to maintain the same standard of living.
Geographical Conditions
San Diego's stunning geography, with its miles of coastline, beautiful beaches, and nearby mountains, makes it popular among outdoor enthusiasts. Santa Ana, while landlocked, is close to the Santa Ana Mountains and the Pacific coastline, offering some outdoor adventure opportunities.
When considering education, both cities offer a range of options. San Diego has several highly ranked public and private schools, along with major universities like San Diego State University and University of California, San Diego. Santa Ana also houses prestigious public schools and Santa Ana College. However, San Diego's slightly better rated schools and renowned universities make it a more desirable choice among families with children or those seeking higher education opportunities.
Economically, San Diego and Santa Ana have different strongholds. San Diego has a diverse economy with strength in sectors like healthcare, education, and defense. Santa Ana, on the other hand, leans heavier on service industries and retail, with a booming arts scene contributing to the local economy. It’s worth noting, that both cities have similar median household incomes, but job growth is slightly higher in San Diego.
Biggest Employers
San Diego's biggest employers are largely in the healthcare and education sectors, with UC San Diego Health, Sharp Healthcare, and San Diego Unified School District leading the pack. Santa Ana's largest employers include the County of Orange, Ingram Micro, and Tenet Healthcare, reflecting the city's focus on the service and manufacturing industries.
There were 539 building permits issued in San Diego in 2012 (88 more than in 2011) compared to 231 building permits issued in Santa Ana in 2012 (189 more than in 2011).
In San Diego (San Diego County), 52.6% voted for Democrats and 45.0% for Republicans in 2012 Presidential Election. In Santa Ana (Orange County), 45.8% voted for Democrats and 52.0% for Republicans.
Elections
Type
Democrats
Republicans
Other
Year
San Diego
Santa Ana
San Diego
Santa Ana
San Diego
Santa Ana
2020
60.3%
53.6%
37.5%
44.6%
2.1%
1.8%
2016
56.3%
50.9%
36.6%
42.4%
7.1%
6.7%
2012
52.6%
45.8%
45.0%
52.0%
2.4%
2.3%
2008
54.2%
47.8%
44.0%
50.3%
1.8%
1.9%
2004
46.7%
39.3%
52.9%
60.2%
0.4%
0.5%
2000
45.8%
40.4%
49.8%
55.9%
4.5%
3.7%
1996
44.1%
37.9%
45.6%
51.7%
10.3%
10.5%
Breakdown of population affiliated with a religious congregation
Type
Adherents
Congregations
Religion
San Diego
Santa Ana
San Diego
Santa Ana
CATHOLIC CHURCH
25.9%
26.5%
6.7%
4.4%
SOUTHERN BAPTIST CONVENTION
1.1%
2.3%
12.0%
8.8%
MUSLIM ESTIMATE
0.7%
0.8%
1.1%
1.3%
SEVENTH DAY ADVENTIST CHURCH
0.5%
0.4%
2.0%
1.3%
EPISCOPAL CHURCH
0.4%
0.4%
2.0%
1.4%
EVANGELICAL LUTHERAN CHURCH IN AMERICA
0.4%
0.4%
2.0%
2.3%
LUTHERAN CHURCH
0.4%
0.6%
2.2%
2.0%
REFORMED CHURCH IN AMERICA
0.0%
0.3%
0.1%
0.2%
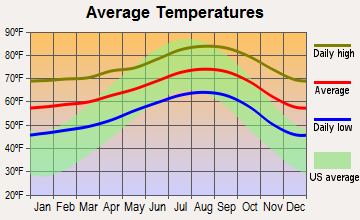
Weather
Both cities boast pleasant Mediterranean climates, making them ideal for people who love outdoor activities. San Diego enjoys slightly more moderate temperatures year-round, with milder summers and warmer winters. Santa Ana, on the other hand, experiences a hotter summer and slightly cooler winter. For tourists, both cities offer typically sunny and dry conditions, perfect for sightseeing and outdoor adventures.
Weather and climate
Type
San Diego
Santa Ana
Temperature - Average
64.4°F
65.4°F
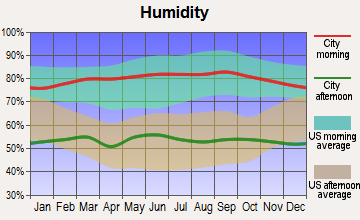
Humidity - Average morning or afternoon humidity
74%
69.9%
Humidity - Differences between morning and afternoon humidity
22%
26.2%
Humidity - Maximum monthly morning or afternoon humidity
80%
78.3%
Humidity - Minimum monthly morning or afternoon humidity
58%
52%
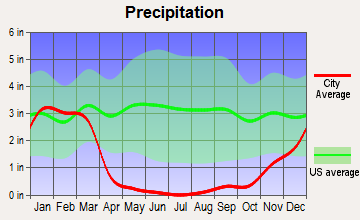
Precipitation - Yearly average
11 in
13.8 in
Snowfall - Yearly average
0 in
0 in
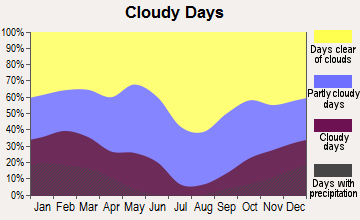
Clouds - Number of days clear of clouds
24.3%
26.5%
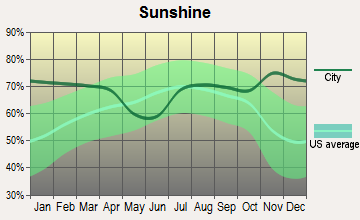
Sunshine amount - Average
74.8%
78.4%
Sunshine amount - Differences during a year
19%
21.9%
Sunshine amount - Maximum monthly
75%
84.8%
Sunshine amount - Minimum monthly
56%
62.9%
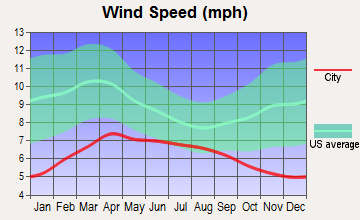
Wind speed - Average
6.9 mph
5.9 mph
Average climate in San Diego, California
Average climate in Santa Ana, California
Air pollution
Type
AQI
CO
NO2
OZONE
PB
PM10
PM25
SO2
Year
San Diego
Santa Ana
San Diego
Santa Ana
San Diego
Santa Ana
San Diego
Santa Ana
San Diego
Santa Ana
San Diego
Santa Ana
San Diego
Santa Ana
San Diego
Santa Ana
2018
101
124
0.53
0.34
11.2
14.2
32.6
27.0
0.007
N/A
N/A
27.5
10.5
12.3
0.1
0.7
2017
115
129
0.63
0.35
12.7
13.9
32.7
29.1
0.007
N/A
N/A
26.7
10.8
13.6
0.1
0.5
2016
105
107
0.46
0.35
13.0
12.6
30.4
29.2
0.006
N/A
N/A
24.1
11.4
12.7
0.1
0.2
2015
111
128
0.43
0.32
13.2
13.4
29.9
29.6
0.005
N/A
N/A
25.0
11.9
14.7
0.1
0.2
2014
105
127
0.44
0.29
11.6
13.2
31.1
28.6
0.007
N/A
N/A
26.7
11.1
15.9
0.1
0.4
2013
138
123
0.50
0.34
12.4
13.9
27.4
27.6
0.019
0.003
N/A
28.8
12.3
14.0
0.2
0.3
2012
110
115
0.53
0.31
12.7
12.9
28.0
26.7
0.019
0.004
N/A
27.5
13.6
14.5
0.2
0.1
2011
122
118
0.51
0.31
13.5
14.8
29.0
27.1
0.034
0.006
N/A
27.5
14.0
15.9
1.5
0.7
2010
109
107
0.52
0.34
14.0
14.4
29.3
26.5
0.019
0.011
N/A
23.5
13.9
14.6
1.0
0.6
2009
121
133
0.64
0.35
15.6
16.0
26.9
27.7
0.014
0.010
N/A
24.4
15.1
14.9
2.7
1.1
2008
127
138
0.71
0.38
16.1
17.1
28.4
28.2
N/A
0.010
67.3
30.1
N/A
21.6
2.6
1.1
2007
157
121
0.71
0.36
16.4
17.0
28.0
27.1
0.012
0.012
64.6
N/A
N/A
N/A
2.8
0.8
2006
123
120
0.81
0.40
18.9
17.7
27.1
26.6
0.056
0.007
64.8
N/A
N/A
N/A
3.4
1.3
2005
112
119
0.90
0.40
19.2
18.2
24.4
28.3
0.049
0.013
N/A
N/A
N/A
N/A
3.7
1.3
2004
120
128
0.93
0.50
18.4
19.4
25.9
31.2
0.055
0.014
N/A
N/A
N/A
N/A
4.6
1.6
2003
124
139
0.88
0.64
19.4
22.3
25.4
28.3
0.049
0.029
N/A
N/A
N/A
N/A
3.8
1.1
2002
125
122
0.86
0.66
20.9
22.3
25.9
25.1
0.039
0.019
N/A
N/A
N/A
N/A
3.6
1.7
2001
132
120
0.93
0.76
20.4
22.6
26.5
25.1
0.048
0.036
N/A
N/A
N/A
N/A
3.4
1.5
2000
134
127
1.02
0.80
22.3
25.7
23.8
23.7
0.054
0.028
N/A
N/A
N/A
N/A
3.6
1.9
Natural disasters
Type
San Diego
Santa Ana
Tornado activity compared to U.S. average
6.7%
19.1%
Earthquake activity compared to U.S. average
5,835%
6,931.4%
Natural disasters compared to U.S. average
39%
32%
Transportation
Both cities offer numerous transportation options. San Diego's extensive public transportation network, including buses, trolleys, and commuter trains, makes commuting easy. Santa Ana also offers robust bus services and the Metrolink for regional commuting. Both cities suffer from traffic congestion, though it seems to be more of an issue in San Diego because of its larger size and population.
Transport
Type
San Diego
Santa Ana
Amtrak stations
1
1
Amtrak stations nearby
2
3
FAA registered aircraft
852
150
FAA registered aircraft manufacturers and dealers
33
15
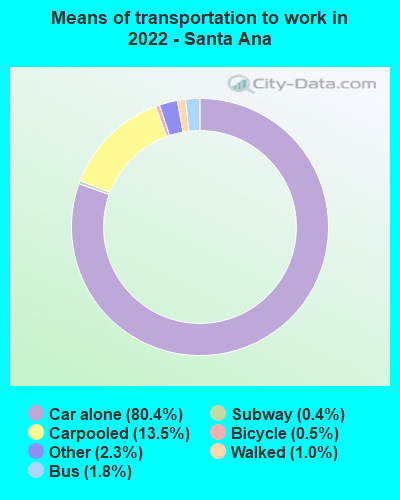
Means of transportation to work
Type
San Diego
Santa Ana
Bicycle
0.6%
0.2%
Bus
2%
0.9%
Carpooled
9.4%
12%
Car alone
81.7%
83.6%
Ferryboat
0.1%
0%
Motorcycle
0.3%
0.1%
Railroad
0.5%
0.1%
Walked
3.6%
1.4%
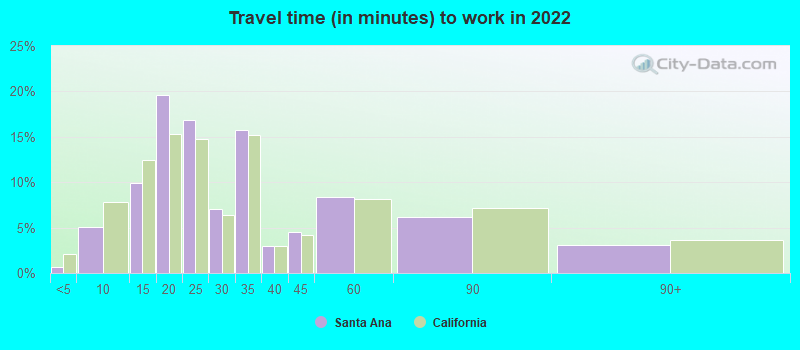
Average travel time to work
Type
San Diego
Santa Ana
Average
27.4 min
30.4 min
Other means
22.7 min
25.5 min
Public transportation
45.7 min
48.1 min
Private vehicle occupancy
Type
San Diego
Santa Ana
Average
1.2
1.2
Drove alone
89.5%
84.6%
In 2 person carpool
7.6%
11.7%
In 3 person carpool
1.8%
2.7%
In 4 person carpool
0.4%
0.6%
In 5-6 person carpool
0.5%
0.4%
In 7+ person carpool
0.2%
0%
How many people usually rode to work in the car, truck or van.
Real Estate
Real estate tends to be pricier in San Diego, with median home values significantly above the national average. In contrast, Santa Ana's real estate values are more affordable, yet still higher than the national average. Renters may also find more affordable options in Santa Ana.
Neighborhoods
San Diego's neighborhoods range from beachfront communities like La Jolla to hip urban areas like North Park, offering a wide variety of living options. Santa Ana's neighborhoods, like the historic and artsy Downtown Santa Ana, offer a unique charm that appeals to a young and vibrant crowd.
Houses and residents
Type
San Diego
Santa Ana
Houses
555,456
80,604
Average household size (people)
2.6
4.4
Median year apartment built
1980
1974
Median year house/condo built
1977
1962
Length of stay in the house since moving in
14.1 years
15.9 years
Houses occupied
521,000 (93.8%)
78,674 (97.6%)
Houses occupied by owners
251,507 (48.3%)
35,317 (44.9%)
Houses occupied by renters
269,493 (51.7%)
43,357 (55.1%)
Median rent asked for vacant for-rent units
$2,096
$1,407
Median monthly housing costs
$2,044
$1,836
Median price asked for vacant for-sale houses and condos
$957,871
$976,981
Estimated median house or condo value
$768,800
$623,000
Median numbers of rooms
4.6
4.5
Median number of rooms in apartments
3.7
3.9
Median number of rooms in houses and condos
5.9
5.6
Median house price - detached houses
Over $1,000,000
$724,856
Median house price - in 2-unit structures
Over $1,000,000
$512,474
Median house price - in 3-to-4-unit structures
$529,375
$351,406
Median house price - in 5 or more unit structures
$543,091
$406,926
Median house price - mobile homes
$134,064
$125,004
Median house price - Townhouses or other attached units
$696,014
$492,339
Median house price - All housing units
$941,291
$648,392
Median house age
42
53
Renting percentage
51.7%
52.5%
Housing density (houses/condos per square mile)
1,712.6
2,969.6
House value disparities
23.6%
21.7%
Household income disparities
42.3%
40.4%
Median household income for houses/condes with a mortgage
$138,584
$120,617
Median household income for apartments without a mortgage
$97,588
$74,449
Housing units without a mortgage
2,803 (1.6%)
318 (1.2%)
Housing units with both a second mortgage and home equity loan
12,495 (6.9%)
1,175 (4.6%)
Housing units with a mortgage
177,643 (98.4%)
25,378 (98.8%)
Housing units with a home equity loan
694 (0.4%)
23 (0.1%)
Housing units with a second mortgage
16,654 (9.2%)
1,438 (5.6%)
House/condo owner moved in on average (years ago)
11
14
House/condo renter moved in on average (years ago)
1
5
Housing units lacking complete kitchen facilities
0.8%
3.3%
Housing units in structures
Housing units in structures
San Diego
Santa Ana
One, detached
43.4%
46.4%
One, attached
9.9%
5.8%
Two
1.9%
3.6%
3 or 4
6.0%
7.3%
5 to 9
9.3%
5.7%
10 to 19
7.4%
8.8%
20 to 49
6.3%
6.3%
50 or more
14.6%
11.0%
Mobile homes
1.0%
4.9%
Median real estate property taxes paid for housing units
Self-employed workers in own not incorporated business
39,709
13,591
State government workers
29,438
3,716
Unpaid family workers
808
355
Industries and Occupations
San Diego is home to diverse industries, with major sectors being healthcare, biotech, defense, tourism, and education. In contrast, Santa Ana's economy relies on service sectors, retail trade, manufacturing, and an emerging arts scene. Popular occupations in San Diego are mainly focused on management, healthcare, and education, while in Santa Ana, sales, office, and administrative support roles are more prevalent.
Healthcare in San Diego is of a high standard, with leading institutions like UC San Diego Health and Sharp Healthcare. Conversely, Santa Ana residents rely on the larger Orange County for major healthcare services, with CHOC Children's and UC Irvine Health being top providers.
Health (county statistics)
Type
San Diego
Santa Ana
General health status score of residents in this county from 1 (poor) to 5 (excellent)
In terms of infrastructure, both cities are well developed. San Diego is considerably larger, spreading over a vast area with a well-established network of highways and transit systems. Santa Ana, though more compact, still offers easy connectivity through its well-planned city layout.
Infrastructure
Type
San Diego
Santa Ana
Hospitals
26
9
TV stations
13
2
Bank branches located here
255
31
Bank institutions located here
40
13
Main business address for public companies
92
15
Drinking water stations with no reported violations in the past
5
0
Drinking water stations with reported violations in the past
HMDA - Conventional home purchase loans - Applications denied
Year
San Diego
Santa Ana
1999
3,865
955
2000
2,257
834
2001
1,754
725
2002
2,118
933
2003
5,074
1,222
2004
7,646
1,657
2005
8,409
2,302
2006
7,551
2,615
2007
5,741
1,456
2008
2,876
694
2009
1,675
399
Culture and Food
San Diego is renowned for its diverse food scene, including famed Mexican cuisine, fresh seafood, and craft beer. The city also boasts a vibrant arts scene and numerous cultural festivals. Santa Ana, on the other hand, is known for its thriving Hispanic culture, with its authentic Mexican food scene and the popular Artwalk Festival.
Sports Teams
Sports enthusiasts would find more joy in San Diego, home to professional sports teams like the San Diego Padres (MLB) and San Diego Gulls (AHL). Santa Ana doesn't have any major league sports teams, focusing more on local community sports.


 San Diego, CA
 Santa Ana, CA