#### Overview
San Diego, California, and East Seattle, Washington, are two distinct regions with unique strengths and qualities that make them appealing for relocation or tourism. San Diego is known for its year-round sunshine, stunning coastline, and robust economy, while East Seattle is acclaimed for its lush greenery, tech-driven economy, and thriving cultural scene. However, each city exhibits different characteristics concerning crime and safety, weather, cost of living, education, work and economy, infrastructure, and a range of other essential factors. This comparative guide provides detailed insights into the considerations for relocation or visitation to these cities.
#### Crime/Safety
San Diego is known for having a moderate crime rate, lower than in many other major cities in California. Neighborhoods like La Jolla and Del Mar rank as some of the safest parts of the city. Conversely, East Seattle, generally has a slightly higher crime rate than the national average, although crime rates vary by neighborhood.
#### Weather
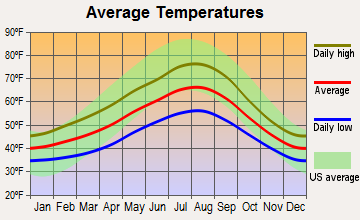
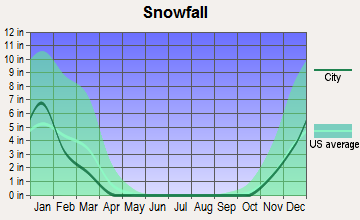
San Diego is renowned for its year-round sunny weather, with mild winters and warm summers. Average temperatures range from the 60s to 70s, making it an attractive destination for people who value consistent, pleasant weather. East Seattle, on the other hand, experiences more variation, with wet, cool winters and warm, dry summers—making it ideal for those who prefer experiencing all four seasons.
#### Cost of Living
The cost of living in San Diego is higher than the U.S. average, reflecting the higher cost of housing and the appeal of the area. East Seattle, too, has a high cost of living, driven largely by housing and transportation costs—particularly for those looking to live near the city center or join the burgeoning tech scene.
#### Education
Both San Diego and East Seattle boast strong education systems. In San Diego, there is a mix of high-performing public, charter, and private schools, along with several universities. In East Seattle, the education system also stands out, with highly rated schools like Interlake Senior High School and nationally recognized universities such as the University of Washington.
#### Work and Economy
San Diego's economy is quite diverse, boasting strengths in health care, biotech, and military sectors along with a thriving tourism industry. Conversely, East Seattle's economy is heavily influenced by the tech industry: Microsoft and Amazon are headquartered in the nearby area, providing a multitude of jobs.
#### Infrastructure
San Diego's infrastructure is well-planned, allowing easy access to highways and public transportation options like trolleys and buses. Water supply and internet connectivity are reliable, making daily life comfortable. East Seattle has an excellent transportation infrastructure, including light rail services and bike-friendly streets, and its tech-driven culture ensures top-tier internet connectivity.
#### Industries and Occupations
San Diego is known for its biotech industry, healthcare services, military defense sectors, and tourism, offering a range of career opportunities. In contrast, East Seattle is recognized as a technology hub, housing numerous software development, IT, and e-commerce companies.
#### Biggest Employers
The biggest employers in San Diego include the U.S. Navy, universities such as UC San Diego, and healthcare providers like Sharp Healthcare. East Seattle is dominated by tech giants Microsoft and Amazon, as well as businesses in retail, health care, and manufacturing.
#### Real-Estate
San Diego's real estate market is highly desirable and rapidly growing, lending to higher home prices. East Seattle's real estate market mirrors this trend, largely driven by the influx of tech employees seeking housing close to their workplaces.
#### Neighborhoods
San Diego is known for its beachfront neighborhoods like La Jolla and Coronado, as well as eclectic and cultural areas like the Gaslamp Quarter. East Seattle's neighborhoods offer a mix of waterfront luxury, urban living, and suburban comfort—with areas like Bellevue and Kirkland gaining popularity.
#### Transportation/Public Transit/Commuting
San Diego benefits from a robust public transit system encompassing bus and trolley lines. East Seattle has an extensive public transit network consisting of buses, light rail, ferries, and a well-developed biking infrastructure. Traffic congestion can be a challenge in both cities during rush hours.
#### City/State Sales Tax
California has a relatively high state sales tax, and San Diego levies an additional local sales tax. Washington State has a high sales tax as well, though East Seattle does not impose an additional local sales tax.
#### City/State Income Tax
California, including San Diego, has a progressive income tax rate. By contrast, Washington state, including East Seattle, does not impose a state income tax, which can make it more attractive to some individuals and businesses.
#### City/State Property Tax
Property tax rates in San Diego are generally lower than the national average, but because property values are high, actual taxes can be quite high. On the other hand, East Seattle homeowners pay higher than average property tax rates, largely due to the high property values in the area.
#### Culture/Food
San Diego is known for its vibrant culture and excellent food scene, with strong influences from Mexican cuisine. Major cultural events include Comic-Con International. East Seattle boasts a thriving music and arts scene and a diverse food landscape with a blend of Asian, seafood, and locally sourced cuisines.
#### Sports Teams
San Diego hosts several professional sports teams, including the San Diego Padres (MLB) and the San Diego Gulls (AHL). East Seattle residents enjoy proximity to Seattle's teams like the Seattle Seahawks (NFL), Seattle Mariners (MLB), and Seattle Sounders (MLS).
#### Geographical Conditions
San Diego's geographical conditions are marked by its beautiful sandy beaches and coastal cliffs. East Seattle is known for its picturesque landscapes, featuring lush greenery, mountains, and bodies of water such as Lake Washington and the Puget Sound.
#### Health Care
San Diego is home to many award-winning hospitals and healthcare facilities, including those specific to veterans and children. East Seattle, with organizations like the University of Washington Medical Center and Overlake Medical Center, also provides high-quality healthcare services.
#### Summary
In comparison, both San Diego and East Seattle offer unique qualities making them attractive options for both relocation and tourism. San Diego provides a sunny, beach-front lifestyle with a diverse economy and vibrant cultural scene, while East Seattle offers lush greenery, a progressive tech economy, and a rich arts and food culture. Each city has distinct considerations concerning cost of living, education, and tax rates that should be evaluated when considering relocation or visitation.
In San Diego (San Diego County), 52.6% voted for Democrats and 45.0% for Republicans in 2012 Presidential Election. In East Seattle (King County), 69.0% voted for Democrats and 28.5% for Republicans.
Elections
Type
Democrats
Republicans
Other
Year
San Diego
East Seattle
San Diego
East Seattle
San Diego
East Seattle
2020
60.3%
75.1%
37.5%
22.3%
2.1%
2.6%
2016
56.3%
70.0%
36.6%
21.1%
7.1%
8.9%
2012
52.6%
69.0%
45.0%
28.5%
2.4%
2.5%
2008
54.2%
70.2%
44.0%
28.1%
1.8%
1.7%
2004
46.7%
65.1%
52.9%
33.8%
0.4%
1.1%
2000
45.8%
60.3%
49.8%
34.5%
4.5%
5.2%
1996
44.1%
56.4%
45.6%
31.4%
10.3%
12.2%
Breakdown of population affiliated with a religious congregation
Type
Adherents
Congregations
Religion
San Diego
East Seattle
San Diego
East Seattle
CATHOLIC CHURCH
25.9%
14.4%
6.7%
4.9%
SOUTHERN BAPTIST CONVENTION
1.1%
0.3%
12.0%
3.8%
MUSLIM ESTIMATE
0.7%
0.6%
1.1%
1.4%
SEVENTH DAY ADVENTIST CHURCH
0.5%
0.6%
2.0%
2.3%
EPISCOPAL CHURCH
0.4%
0.8%
2.0%
2.4%
EVANGELICAL LUTHERAN CHURCH IN AMERICA
0.4%
1.3%
2.0%
4.7%
LUTHERAN CHURCH
0.4%
0.5%
2.2%
2.0%
AMERICAN BAPTIST CHURCHES IN THE USA
0.1%
0.6%
1.5%
2.9%
Weather and climate
Type
San Diego
East Seattle
Temperature - Average
64.4°F
52.5°F
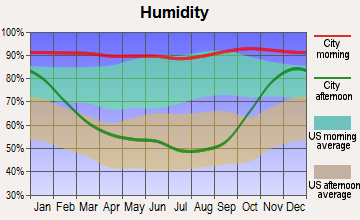
Humidity - Average morning or afternoon humidity
74%
78.5%
Humidity - Differences between morning and afternoon humidity
22%
38%
Humidity - Maximum monthly morning or afternoon humidity
80%
86%
Humidity - Minimum monthly morning or afternoon humidity
58%
48%
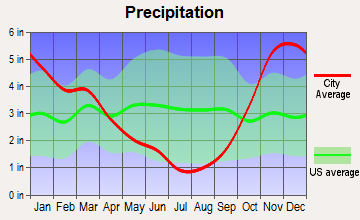
Precipitation - Yearly average
11 in
36.8 in
Snowfall - Yearly average
0 in
21.4 in
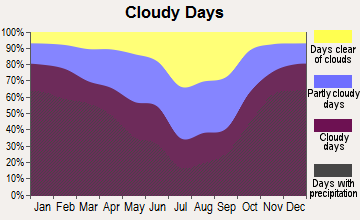
Clouds - Number of days clear of clouds
24.3%
11.7%
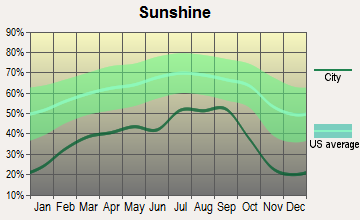
Sunshine amount - Average
74.8%
49.4%
Sunshine amount - Differences during a year
19%
44%
Sunshine amount - Maximum monthly
75%
64%
Sunshine amount - Minimum monthly
56%
20%
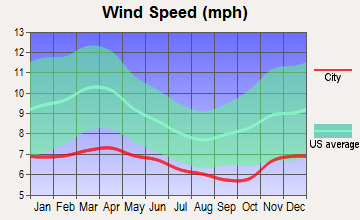
Wind speed - Average
6.9 mph
8.6 mph
Average climate in San Diego, California
Average climate in East Seattle, Washington
Air pollution
Type
AQI
CO
NO2
OZONE
PB
PM10
PM25
SO2
Year
San Diego
East Seattle
San Diego
East Seattle
San Diego
East Seattle
San Diego
East Seattle
San Diego
East Seattle
San Diego
East Seattle
San Diego
East Seattle
San Diego
East Seattle
2018
101
85
0.53
0.21
11.2
10.6
32.6
21.0
0.007
N/A
N/A
N/A
10.5
5.1
0.1
0.7
2017
115
100
0.63
0.23
12.7
11.1
32.7
21.2
0.007
N/A
N/A
N/A
10.8
4.6
0.1
0.3
2016
105
67
0.46
0.22
13.0
11.9
30.4
20.2
0.006
N/A
N/A
N/A
11.4
3.8
0.1
0.6
2015
111
88
0.43
0.23
13.2
10.8
29.9
19.4
0.005
N/A
N/A
N/A
11.9
5.6
0.1
0.8
2014
105
75
0.44
0.24
11.6
11.5
31.1
19.5
0.007
N/A
N/A
N/A
11.1
5.7
0.1
N/A
2013
138
81
0.50
0.24
12.4
N/A
27.4
17.2
0.019
N/A
N/A
N/A
12.3
5.9
0.2
0.8
2012
110
83
0.53
0.23
12.7
N/A
28.0
19.3
0.019
N/A
N/A
N/A
13.6
5.2
0.2
1.0
2011
122
73
0.51
0.24
13.5
N/A
29.0
18.6
0.034
N/A
N/A
N/A
14.0
5.2
1.5
1.1
2010
109
73
0.52
0.24
14.0
N/A
29.3
18.0
0.019
N/A
N/A
N/A
13.9
4.4
1.0
1.1
2009
121
94
0.64
0.27
15.6
N/A
26.9
18.3
0.014
N/A
N/A
N/A
15.1
6.0
2.7
1.4
2008
127
80
0.71
0.30
16.1
N/A
28.4
17.8
N/A
N/A
67.3
N/A
N/A
5.4
2.6
1.3
2007
157
85
0.71
0.30
16.4
N/A
28.0
17.7
0.012
N/A
64.6
19.0
N/A
6.4
2.8
1.5
2006
123
102
0.81
N/A
18.9
N/A
27.1
18.4
0.056
N/A
64.8
21.1
N/A
7.2
3.4
N/A
2005
112
104
0.90
0.80
19.2
18.3
24.4
N/A
0.049
N/A
N/A
22.9
N/A
7.6
3.7
3.5
2004
120
110
0.93
0.81
18.4
17.9
25.9
N/A
0.055
N/A
N/A
N/A
N/A
8.3
4.6
3.0
2003
124
100
0.88
0.85
19.4
18.5
25.4
N/A
0.049
N/A
N/A
N/A
N/A
8.3
3.8
2.4
2002
125
90
0.86
1.07
20.9
19.3
25.9
N/A
0.039
N/A
N/A
N/A
N/A
10.7
3.6
2.7
2001
132
91
0.93
1.08
20.4
20.5
26.5
N/A
0.048
0.004
N/A
N/A
N/A
11.1
3.4
3.7
2000
134
99
1.02
1.21
22.3
20.9
23.8
N/A
0.054
N/A
N/A
N/A
N/A
12.1
3.6
3.2
Natural disasters
Type
San Diego
East Seattle
Tornado activity compared to U.S. average
6.7%
5.5%
Earthquake activity compared to U.S. average
5,835%
1,403%
Natural disasters compared to U.S. average
39%
30%
Transport
Type
San Diego
East Seattle
Amtrak stations
1
0
Amtrak stations nearby
2
3
FAA registered aircraft
852
0
FAA registered aircraft manufacturers and dealers
33
0
Means of transportation to work
Type
San Diego
East Seattle
Bicycle
0.6%
0.3%
Bus
2%
5%
Carpooled
9.4%
11%
Car alone
81.7%
76.3%
Ferryboat
0.1%
0%
Motorcycle
0.3%
0.1%
Railroad
0.5%
0%
Walked
3.6%
1.7%
Average travel time to work
Type
San Diego
East Seattle
Average
27.4 min
25 min
Houses and residents
Type
San Diego
East Seattle
Houses
555,456
199,933
Average household size (people)
2.6
2.5
Houses occupied
521,000 (93.8%)
191,630 (95.8%)
Houses occupied by owners
251,507 (48.3%)
128,209 (66.9%)
Houses occupied by renters
269,493 (51.7%)
63,421 (33.1%)
Median rent asked for vacant for-rent units
$2,096
$2,281
Median price asked for vacant for-sale houses and condos
$957,871
$820,468
Estimated median house or condo value
$768,800
$877,325
Median number of rooms in apartments
3.7
3.5
Median number of rooms in houses and condos
5.9
7.8
Housing density (houses/condos per square mile)
1,712.6
920.9
Household income disparities
42.3%
34.9%
Housing units without a mortgage
2,803 (1.6%)
22,582 (20.8%)
Housing units with both a second mortgage and home equity loan
12,495 (6.9%)
352 (0.3%)
Housing units with a mortgage
177,643 (98.4%)
85,751 (79.2%)
Housing units with a home equity loan
694 (0.4%)
11,674 (10.8%)
Housing units with a second mortgage
16,654 (9.2%)
9,796 (9%)
Housing units lacking complete kitchen facilities
0.8%
0.8%
Housing units lacking complete plumbing facilities
 San Diego, CA
 East Seattle, WA