The comparison between living in San Diego, California and living in Anchorage, Alaska cannot be more contrasting. Anchorage is located in the far north with colder weather and distinct industries such as oil and fishing, while San Diego, also known as the birthplace of California, is famous for its ideal Mediterranean climate and a highly diversified economy. The standard of living in these two cities differ greatly in terms of cost, culture, education, healthcare, and more.
Distance between
San Diego, CA and
Anchorage, AK : 2,442.2 miles
San Diego's population is larger by 380%. Its population has grown by 158,211 people (12.9%) since 2000. The population of Anchorage has grown by 27,838 people (10.7%) during that time.
San Diego generally has a lower crime rate compared to Anchorage. The murder, theft, and robbery rates in Anchorage surpass that of San Diego. Anchorage also currently combats a higher rate of drug crime. As a tourist, San Diego might be a safer choice, and for potential relocations, San Diego's neighborhoods demonstrate a safer environment.
City-data.com crime index counts serious crimes and violent crime more heavily. It adjusts for the number of visitors and daily workers commuting into cities. (higher means more crime, U.S. average = 301.1)
City-data.com crime index counts serious crimes and violent crime more heavily. It adjusts for the number of visitors and daily workers commuting into cities. (higher means more crime, U.S. average = 301.1)
Sex Offenders
According to our data, there are 1,386 registered sex offenders living in San Diego and 1,368 registered sex offenders living in . The ratio of residents to sex offenders in San Diego is 1,015 to 1; the ratio in Anchorage is 218 to 1. The number of registered sex offenders compared to the number of residents is a lot smaller in San Diego than in Anchorage.
Cost of Living
The cost of living in San Diego is significantly higher than in Anchorage, especially when it comes to housing. Groceries, transportation, utilities, and healthcare also tend to be more costly in San Diego. Nevertheless, high costs are often counteracted by higher salaries and the wide range of industries in San Diego.
Income Tax
California has a progressive income tax while Alaska levies no state income tax. Hence, income tax minimizes your cost of living in Anchorage compared to San Diego.
Property Tax
Anchorage's property tax rates are higher than San Diego's, with rates varying depending on the specific area of the city. Meanwhile, Californian homeowners are protected by property tax caps.
Sales Tax
San Diego has a higher sales tax rate than Anchorage. California's state sales tax rate is 7.25%, while the total sales tax rate in San Diego can go up to 8.75%. Conversely, Anchorage does not have a sales tax.
Income
Type
San Diego
Anchorage
Estimated median household income
$93,042
$86,654
Estimated per capita income
$48,380
$43,165
Cost of living index (U.S. average is 100)
126.4
103.3
If you make $50,000 in Anchorage, you will have to make $61,181 in San Diego to maintain the same standard of living.
Geographical Conditions
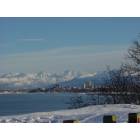
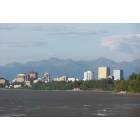
Geographically, San Diego is characterized by its beaches, bays and rolling hills, while Anchorage is defined by its rugged mountains, lush forests, and proximity to the ocean.
Both cities offer an array of educational opportunities. San Diego boasts some high-ranking school districts in the U.S. and world-class institutions like University of California, San Diego. Anchorage, despite its size, operates the largest school district in Alaska and provides a number of schooling options from Pre-K to high school.
San Diego's economy is diverse and flourishing, with key sectors like defense/military, tourism, international trade, and manufacturing. Anchorage’s economy heavily revolves around oil, gas, and transportation. Unemployment rate in San Diego has traditionally been lower compared to Anchorage.
Biggest Employers
San Diego's largest employers include the US Navy, University of California San Diego, and Qualcomm. In Anchorage, the top employers are Providence Health & Services, Walmart, and the Municipality of Anchorage.
Breakdown of population affiliated with a religious congregation
Type
Adherents
Congregations
Religion
San Diego
Anchorage
San Diego
Anchorage
CATHOLIC CHURCH
25.9%
7.9%
6.7%
3.7%
SOUTHERN BAPTIST CONVENTION
1.1%
3.1%
12.0%
10.1%
MUSLIM ESTIMATE
0.7%
0.3%
1.1%
0.9%
SEVENTH DAY ADVENTIST CHURCH
0.5%
0.6%
2.0%
2.8%
EPISCOPAL CHURCH
0.4%
0.6%
2.0%
1.5%
EVANGELICAL LUTHERAN CHURCH IN AMERICA
0.4%
1.1%
2.0%
2.8%
LUTHERAN CHURCH
0.4%
0.4%
2.2%
1.2%
AMERICAN BAPTIST CHURCHES IN THE USA
0.1%
0.5%
1.5%
1.2%
Weather
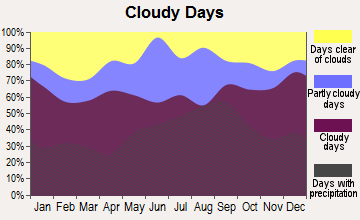
San Diego enjoys a Mediterranean climate, with mild to warm temperatures throughout the year and a very small amount of annual rainfall. On the other hand, Anchorage experiences a subarctic climate with long, cold, snowy winters and short, warm summers. San Diego's weather is more suitable for individuals who prefer a warm climate and beach-related activities, while Anchorage is for those who love snow and winter sports.
Weather and climate
Type
San Diego
Anchorage
Temperature - Average
64.4°F
34.3°F
Humidity - Average morning or afternoon humidity
74%
75%
Humidity - Differences between morning and afternoon humidity
22%
31%
Humidity - Maximum monthly morning or afternoon humidity
80%
81%
Humidity - Minimum monthly morning or afternoon humidity
58%
50%
Precipitation - Yearly average
11 in
20.1 in
Snowfall - Yearly average
0 in
146.5 in
Clouds - Number of days clear of clouds
24.3%
10.2%
Sunshine amount - Average
74.8%
46.8%
Sunshine amount - Differences during a year
19%
18%
Sunshine amount - Maximum monthly
75%
51%
Sunshine amount - Minimum monthly
56%
33%
Wind speed - Average
6.9 mph
7.5 mph
Average climate in San Diego, California
Average climate in Anchorage, Alaska
Air pollution
Type
AQI
CO
NO2
OZONE
PB
PM10
PM25
SO2
Year
San Diego
Anchorage
San Diego
Anchorage
San Diego
San Diego
Anchorage
San Diego
San Diego
Anchorage
San Diego
Anchorage
San Diego
2018
101
54
0.53
0.50
11.2
N/A
32.6
N/A
0.007
N/A
N/A
12.5
10.5
5.4
0.1
N/A
2017
115
62
0.63
N/A
12.7
N/A
32.7
N/A
0.007
N/A
N/A
13.0
10.8
5.1
0.1
N/A
2016
105
63
0.46
0.67
13.0
N/A
30.4
N/A
0.006
N/A
N/A
19.0
11.4
5.8
0.1
N/A
2015
111
61
0.43
N/A
13.2
N/A
29.9
N/A
0.005
N/A
N/A
16.8
11.9
6.3
0.1
N/A
2014
105
66
0.44
N/A
11.6
N/A
31.1
N/A
0.007
N/A
N/A
21.9
11.1
5.9
0.1
N/A
2013
138
58
0.50
N/A
12.4
N/A
27.4
N/A
0.019
N/A
N/A
15.7
12.3
5.2
0.2
N/A
2012
110
61
0.53
N/A
12.7
N/A
28.0
16.8
0.019
N/A
N/A
16.5
13.6
5.7
0.2
N/A
2011
122
55
0.51
N/A
13.5
N/A
29.0
17.3
0.034
N/A
N/A
13.4
14.0
4.7
1.5
N/A
2010
109
65
0.52
N/A
14.0
N/A
29.3
17.7
0.019
N/A
N/A
15.7
13.9
5.6
1.0
N/A
2009
121
74
0.64
N/A
15.6
N/A
26.9
N/A
0.014
N/A
N/A
17.1
15.1
6.4
2.7
N/A
2008
127
N/A
0.71
N/A
16.1
N/A
28.4
N/A
N/A
N/A
67.3
N/A
N/A
N/A
2.6
N/A
2007
157
N/A
0.71
N/A
16.4
N/A
28.0
N/A
0.012
N/A
64.6
N/A
N/A
N/A
2.8
N/A
2006
123
N/A
0.81
N/A
18.9
N/A
27.1
N/A
0.056
N/A
64.8
N/A
N/A
N/A
3.4
N/A
2005
112
N/A
0.90
N/A
19.2
N/A
24.4
N/A
0.049
N/A
N/A
N/A
N/A
N/A
3.7
N/A
2004
120
N/A
0.93
N/A
18.4
N/A
25.9
N/A
0.055
N/A
N/A
N/A
N/A
N/A
4.6
N/A
2003
124
N/A
0.88
N/A
19.4
N/A
25.4
N/A
0.049
N/A
N/A
N/A
N/A
N/A
3.8
N/A
2002
125
N/A
0.86
N/A
20.9
N/A
25.9
N/A
0.039
N/A
N/A
N/A
N/A
N/A
3.6
N/A
2001
132
N/A
0.93
N/A
20.4
N/A
26.5
N/A
0.048
N/A
N/A
N/A
N/A
N/A
3.4
N/A
2000
134
N/A
1.02
N/A
22.3
N/A
23.8
N/A
0.054
N/A
N/A
N/A
N/A
N/A
3.6
N/A
Natural disasters
Type
San Diego
Anchorage
Tornado activity compared to U.S. average
6.7%
0%
Earthquake activity compared to U.S. average
5,835%
8,330.9%
Natural disasters compared to U.S. average
39%
0%
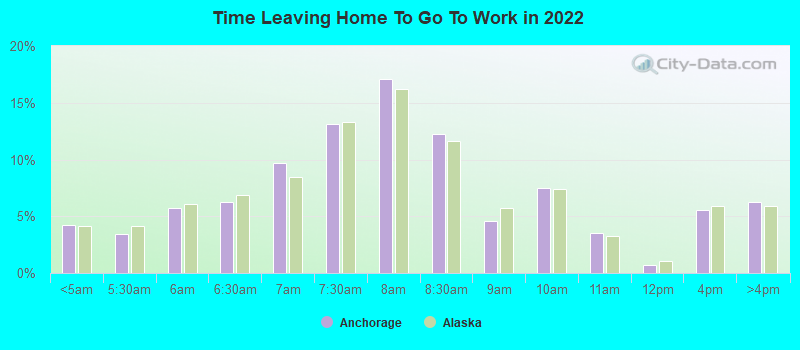
Transportation
Both cities have extensive public transportation systems. San Diego's Metropolitan Transit System serves the majority of the county, while the Alaska Railroad connects Anchorage with many interior Alaska cities.
Transport
Type
San Diego
Anchorage
Amtrak stations
1
0
Amtrak stations nearby
2
0
FAA registered aircraft
852
2
FAA registered aircraft manufacturers and dealers
33
36
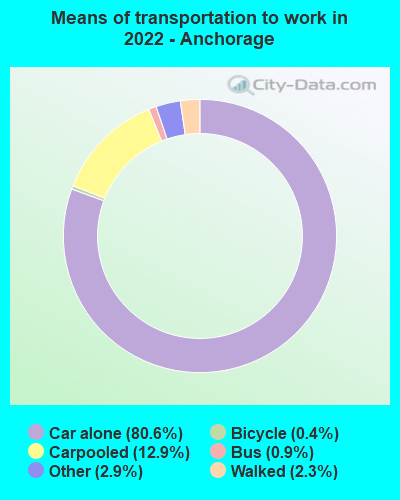
Means of transportation to work
Type
San Diego
Anchorage
Bicycle
0.6%
0.9%
Bus
2%
1.1%
Carpooled
9.4%
11.7%
Car alone
81.7%
80.2%
Ferryboat
0.1%
0.3%
Motorcycle
0.3%
0%
Railroad
0.5%
0%
Taxicab
0.1%
0.2%
Walked
3.6%
3%
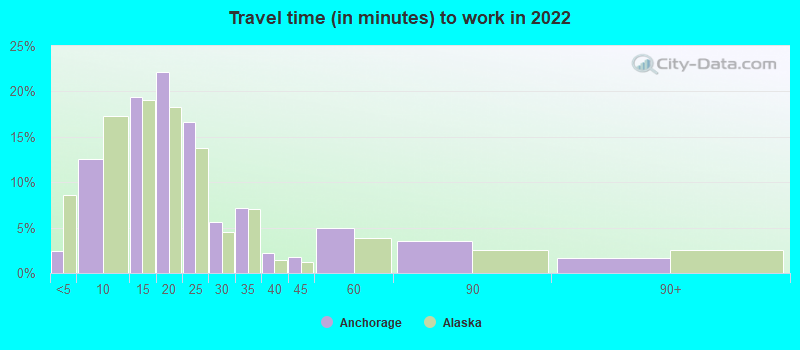
Average travel time to work
Type
San Diego
Anchorage
Average
27.4 min
23.4 min
Other means
22.7 min
20.1 min
Public transportation
45.7 min
33.1 min
Private vehicle occupancy
Type
San Diego
Anchorage
Average
1.2
1.2
Drove alone
89.5%
86.8%
In 2 person carpool
7.6%
9.8%
In 3 person carpool
1.8%
2.1%
In 4 person carpool
0.4%
0.9%
In 5-6 person carpool
0.5%
0.3%
In 7+ person carpool
0.2%
0.1%
How many people usually rode to work in the car, truck or van.
Real Estate
Real estate in San Diego is pricey with skyrocketing property values, but the market remains strong due to the constant demand. Anchorage has a more affordable housing market, but property values typically grow at a slower rate.
Neighborhoods
Both cities have their unique neighborhoods. San Diego neighborhoods like La Jolla and Encinitas are known for their beautiful beaches, while Gaslamp Quarter is famous for nightlife. Downtown Anchorage is vibrant with festivals and markets, while South Anchorage offers suburban living with great schools.
Houses and residents
Type
San Diego
Anchorage
Houses
555,456
119,808
Average household size (people)
2.6
2.6
Median year apartment built
1980
1983
Median year house/condo built
1977
1982
Length of stay in the house since moving in
14.1 years
12 years
Houses occupied
521,000 (93.8%)
109,584 (91.5%)
Houses occupied by owners
251,507 (48.3%)
69,699 (63.6%)
Houses occupied by renters
269,493 (51.7%)
39,885 (36.4%)
Median rent asked for vacant for-rent units
$2,096
$1,103
Median monthly housing costs
$2,044
$1,549
Median price asked for vacant for-sale houses and condos
$957,871
$230,450
Estimated median house or condo value
$768,800
$346,200
Median numbers of rooms
4.6
5.4
Median number of rooms in apartments
3.7
4.2
Median number of rooms in houses and condos
5.9
6.1
Median house price - detached houses
Over $1,000,000
$393,032
Median house price - in 2-unit structures
Over $1,000,000
$287,804
Median house price - in 3-to-4-unit structures
$529,375
$337,130
Median house price - in 5 or more unit structures
$543,091
$185,328
Median house price - mobile homes
$134,064
$127,974
Median house price - Townhouses or other attached units
$696,014
$267,390
Median house price - All housing units
$941,291
$350,756
Median house age
42
39
Renting percentage
51.7%
40.1%
Housing density (houses/condos per square mile)
1,712.6
70.6
House value disparities
23.6%
27.3%
Household income disparities
42.3%
41.6%
Median household income for houses/condes with a mortgage
$138,584
$121,329
Median household income for apartments without a mortgage
$97,588
$99,660
Housing units without a mortgage
2,803 (1.6%)
959 (1.9%)
Housing units with both a second mortgage and home equity loan
12,495 (6.9%)
1,726 (3.4%)
Housing units with a mortgage
177,643 (98.4%)
49,621 (98.1%)
Housing units with a home equity loan
694 (0.4%)
0 (0%)
Housing units with a second mortgage
16,654 (9.2%)
2,395 (4.7%)
House/condo owner moved in on average (years ago)
11
10
House/condo renter moved in on average (years ago)
1
1
Housing units lacking complete kitchen facilities
0.8%
1.2%
Housing units lacking complete plumbing facilities
0.3%
1.1%
Housing units in structures
Housing units in structures
San Diego
Anchorage
One, detached
43.4%
46.6%
One, attached
9.9%
15.2%
Two
1.9%
4.6%
3 or 4
6.0%
10.5%
5 to 9
9.3%
6.0%
10 to 19
7.4%
4.3%
20 to 49
6.3%
6.1%
50 or more
14.6%
2.8%
Mobile homes
1.0%
3.7%
Boats, RVs, vans, etc.
0.0%
0.1%
Median real estate property taxes paid for housing units
Self-employed workers in own not incorporated business
39,709
6,643
State government workers
29,438
12,266
Unpaid family workers
808
500
Industries and Occupations
San Diego’s leading industries are military and defense, tourism, international trade, and research. In Anchorage, the major industries are oil and gas, military, and transportation. The major professions thereby inherently differ as well.
Both cities provide excellent healthcare but San Diego has a higher number of reputed healthcare facilities. Anchorage, while it has fewer options, still houses some top-notch hospitals and clinics.
Health (county statistics)
Type
San Diego
Anchorage
General health status score of residents in this county from 1 (poor) to 5 (excellent)
Infrastructure in Anchorage is robust to withstand extreme weather conditions. San Diego has state-of-the-art infrastructure to support its population and industries, including extensive roads, airports, and public transportation systems. However, San Diego’s infrastructure can be susceptible to natural disasters such as earthquakes and wildfires.
Infrastructure
Type
San Diego
Anchorage
Hospitals
26
7
TV stations
13
27
Arenas or stadiums
4
1
Bank branches located here
255
29
Bank institutions located here
40
4
Main business address for public companies
92
6
Drinking water stations with no reported violations in the past
5
51
Drinking water stations with reported violations in the past
HMDA - Conventional home purchase loans - Applications denied
Year
San Diego
Anchorage
1999
3,865
436
2000
2,257
282
2001
1,754
239
2002
2,118
322
2003
5,074
393
2004
7,646
638
2005
8,409
1,011
2006
7,551
1,008
2007
5,741
648
2008
2,876
286
2009
1,675
293
Culture and Food
San Diego is renowned for its diverse cultural scene and famous Mexican-inspired cuisine. Anchorage, on the other hand, has a unique blend of native and contemporary culture, with seafood being a major part of the diet.
Sports Teams
Sports fans will find a more vibrant scene in San Diego with their MLB and NFL teams. Anchorage, while lacking in major professional sports, does host the Iditarod Trail Sled Dog Race and offers many sporting activities, such as skiing and dog mushing.


 San Diego, CA
 Anchorage, AK