San Antonio, Texas, and Tampa, Florida, are two vibrant U.S. cities with unique appeals. While San Antonio offers a historic charm with its mix of Mexican and Texan cultures, Tampa is a waterfront city with a tropical vibe, and a rich Cuban influence that flavors its culture. The comparison spans across various factors including crime and safety, weather, cost of living, and more. This comprehensive comparison aims to provide a guide to both potential residents looking to relocate and tourists who want to experience the vibrant culture and amenities these cities provide.
Distance between
San Antonio, TX and
Tampa, FL : 977.0 miles
San Antonio's population is larger by 275%. Its population has grown by 307,207 people (26.8%) since 2000. The population of Tampa has grown by 83,603 people (27.6%) during that time.
In terms of safety, both cities have areas of concern and relatively safer neighborhoods. Tampa's overall crime rates are slightly lower when compared to San Antonio. However, it's worth noting that, like every city, crime rates can vary considerably from one neighborhood to another. Therefore, potential residents and tourists should do some research about specific neighborhoods in both cities before making a decision.
City-data.com crime index counts serious crimes and violent crime more heavily. It adjusts for the number of visitors and daily workers commuting into cities. (higher means more crime, U.S. average = 301.1)
City-data.com crime index counts serious crimes and violent crime more heavily. It adjusts for the number of visitors and daily workers commuting into cities. (higher means more crime, U.S. average = 301.1)
Sex Offenders
According to our data, there are 3,802 registered sex offenders living in San Antonio and 1,345 registered sex offenders living in . The ratio of residents to sex offenders in San Antonio is 393 to 1; the ratio in Tampa is 280 to 1. The number of registered sex offenders compared to the number of residents is a smaller in San Antonio than in Tampa.
Cost of Living
When it comes to affordability, San Antonio generally has a lower cost of living compared to Tampa. This is particularly noticeable when it comes to housing. Both cities, however, offer a high quality of life with an affordable cost of living compared to many other U.S. cities.
Income Tax
Neither San Antonio, Texas, nor Tampa, Florida, have a state income tax. This can be a significant incentive for residents, especially those with higher incomes.
Property Tax
While neither city has a state income tax, both cities have fairly high property taxes, with Texas generally having higher rates than Florida. San Antonio's rates tend to be higher than Tampa's, which could be an important consideration for potential home buyers.
Sales Tax
Florida doesn’t have a state income tax, which makes Tampa appealing when it comes to overall tax burden. San Antonio in Texas, likewise, does not levy a state income tax. The sales tax in San Antonio, however, is 8.25%, slightly higher than Tampa's 7%.
Income
Type
San Antonio
Tampa
Estimated median household income
$54,923
$63,404
Estimated per capita income
$28,860
$43,517
Cost of living index (U.S. average is 100)
87.7
99.8
If you make $50,000 in San Antonio, you will have to make $56,899 in Tampa to maintain the same standard of living.
Geographical Conditions
San Antonio is located in south-central Texas and is known for its rolling hills and the scenic River Walk. Tampa is on the west coast of Florida and is a waterfront city with a number of beautiful beaches and a river running through the city.
Both cities have a number of good quality education institutions. Tampa's school system, however, is slightly better rated than San Antonio's. Tampa also home to a few more higher education institutions, including The University of Tampa and the University of South Florida.
Both cities have diverse economies, with thriving sectors. San Antonio's economy is largely driven by the military, healthcare, government services, financial services, oil and gas, and tourism. In contrast, Tampa's economy is more focused on technology, healthcare, finance, retail, and tourism.
Biggest Employers
In San Antonio, the biggest employers are H-E-B, USAA, and the City of San Antonio. In Tampa, the biggest employers include BayCare Health System, Publix Supermarkets, and Tampa General Hospital. Both cities also have a significant number of employment opportunities in the public sector.
There were 6,567 building permits issued in San Antonio in 2012 (4973 more than in 2011) compared to 1,312 building permits issued in Tampa in 2012 (722 more than in 2011).
In San Antonio (Bexar County), 51.6% voted for Democrats and 47.1% for Republicans in 2012 Presidential Election. In Tampa (Hillsborough County), 53.0% voted for Democrats and 46.3% for Republicans.
Elections
Type
Democrats
Republicans
Other
Year
San Antonio
Tampa
San Antonio
Tampa
San Antonio
Tampa
2020
58.3%
52.9%
40.1%
46.0%
1.5%
1.1%
2016
54.2%
51.2%
40.8%
44.4%
5.0%
4.5%
2012
51.6%
53.0%
47.1%
46.3%
1.4%
0.6%
2008
52.3%
53.4%
46.7%
46.2%
1.0%
0.4%
2004
44.5%
46.4%
55.0%
53.2%
0.6%
0.4%
2000
44.9%
47.2%
52.3%
50.4%
2.7%
2.4%
1996
49.7%
46.8%
44.6%
44.3%
5.7%
8.9%
Breakdown of population affiliated with a religious congregation
Type
Adherents
Congregations
Religion
San Antonio
Tampa
San Antonio
Tampa
CATHOLIC CHURCH
30.8%
10.7%
8.6%
2.8%
SOUTHERN BAPTIST CONVENTION
6.8%
8.3%
23.5%
19.4%
MUSLIM ESTIMATE
1.2%
1.7%
0.8%
1.1%
LUTHERAN CHURCH
0.7%
0.3%
1.0%
1.1%
EPISCOPAL CHURCH
0.6%
0.5%
1.6%
1.4%
EVANGELICAL LUTHERAN CHURCH IN AMERICA
0.6%
0.5%
2.2%
1.2%
SEVENTH DAY ADVENTIST CHURCH
0.2%
0.5%
1.3%
2.2%
Weather
If you are a fan of a warm climate, Tampa might be the place for you. Tampa boasts a tropical climate with hot, wet summers and warm, dry winters. On the other hand, San Antonio has a humid subtropical climate, with hot summers and mild winters.
Weather and climate
Type
San Antonio
Tampa
Temperature - Average
68.7°F
73.1°F
Humidity - Average morning or afternoon humidity
74.9%
77.6%
Humidity - Differences between morning and afternoon humidity
37%
38%
Humidity - Maximum monthly morning or afternoon humidity
87%
89%
Humidity - Minimum monthly morning or afternoon humidity
50%
51%
Precipitation - Yearly average
32.2 in
45.6 in
Snowfall - Yearly average
1.2 in
0 in
Clouds - Number of days clear of clouds
17.5%
16.9%
Sunshine amount - Average
62.4%
74.8%
Sunshine amount - Differences during a year
24%
18%
Sunshine amount - Maximum monthly
72%
80%
Sunshine amount - Minimum monthly
48%
62%
Wind speed - Average
8.9 mph
7.4 mph
Average climate in San Antonio, Texas
Average climate in Tampa, Florida
Air pollution
Type
AQI
CO
NO2
OZONE
PB
PM10
PM25
SO2
Year
San Antonio
Tampa
San Antonio
Tampa
San Antonio
Tampa
San Antonio
Tampa
Tampa
San Antonio
Tampa
San Antonio
Tampa
San Antonio
Tampa
2018
83
68
N/A
0.16
4.9
N/A
25.6
27.7
N/A
N/A
N/A
18.9
8.0
7.9
0.2
1.1
2017
85
79
N/A
0.17
5.1
N/A
26.9
28.4
N/A
N/A
N/A
20.5
8.4
8.8
1.7
0.6
2016
79
71
N/A
0.17
5.2
N/A
25.7
30.8
N/A
N/A
N/A
20.2
8.2
7.9
0.8
0.8
2015
76
74
N/A
0.15
4.7
N/A
25.4
28.7
N/A
N/A
N/A
19.0
9.2
10.0
0.7
2.2
2014
84
74
N/A
0.16
5.5
N/A
27.3
28.0
N/A
N/A
N/A
20.0
9.5
8.4
0.6
1.6
2013
79
68
N/A
0.16
4.1
N/A
28.2
27.7
N/A
N/A
N/A
20.3
9.0
9.3
0.7
1.4
2012
77
85
N/A
0.17
4.5
N/A
27.5
28.0
N/A
N/A
18.1
21.0
9.2
9.7
N/A
1.0
2011
85
83
N/A
0.18
4.6
N/A
29.2
29.2
N/A
N/A
18.9
20.8
9.9
10.1
N/A
1.2
2010
75
84
0.21
0.25
7.2
N/A
25.8
29.8
N/A
N/A
17.1
21.8
9.2
9.9
N/A
1.3
2009
74
77
0.23
0.27
8.3
N/A
25.7
27.4
N/A
N/A
19.5
21.2
9.8
10.1
0.4
1.5
2008
84
86
0.26
0.18
9.3
4.0
26.8
27.5
N/A
N/A
19.8
23.3
10.1
10.2
0.5
2.4
2007
83
102
0.49
0.31
9.3
5.4
26.3
28.8
N/A
N/A
23.4
26.0
10.3
12.0
N/A
3.3
2006
86
99
0.51
0.42
9.7
6.9
32.7
29.5
N/A
N/A
24.8
25.8
9.8
11.6
N/A
3.0
2005
86
99
0.53
0.45
10.7
6.7
30.8
27.9
N/A
N/A
22.3
25.0
10.1
13.2
N/A
3.0
2004
76
92
0.48
0.40
10.4
7.2
29.6
26.5
0.004
N/A
22.4
25.0
N/A
12.5
N/A
3.2
2003
77
94
0.57
0.42
10.3
N/A
28.5
23.8
0.004
N/A
26.7
23.9
N/A
11.7
N/A
4.4
2002
88
84
0.52
0.38
11.2
N/A
30.3
24.5
0.006
N/A
N/A
24.2
N/A
11.5
N/A
4.9
2001
78
100
0.57
0.44
11.9
N/A
29.3
26.2
0.012
N/A
N/A
24.9
N/A
12.1
N/A
4.7
2000
82
98
0.52
0.48
11.7
N/A
29.6
29.3
0.020
N/A
N/A
26.3
N/A
N/A
N/A
5.1
Natural disasters
Type
San Antonio
Tampa
Tornado activity compared to U.S. average
91.5%
152.6%
Earthquake activity compared to U.S. average
73.7%
11.1%
Natural disasters compared to U.S. average
21%
25%
Transportation
For public transit, both cities offer bus services, though Tampa also has a streetcar system and a bike sharing program. Commuting times tend to be slightly better in San Antonio compared to Tampa, though, as always, this can depend heavily on specific neighborhoods and traffic conditions.
Transport
Type
San Antonio
Tampa
Amtrak stations
1
1
Amtrak stations nearby
1
3
FAA registered aircraft
987
541
FAA registered aircraft manufacturers and dealers
29
78
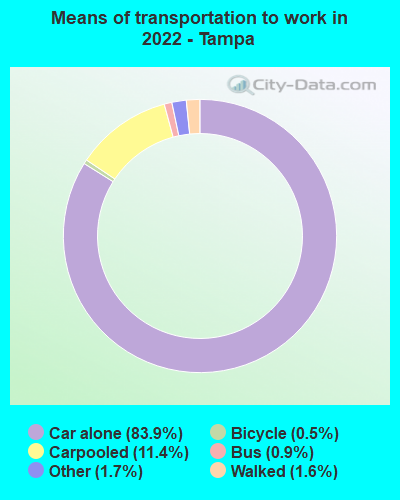
Means of transportation to work
Type
San Antonio
Tampa
Bicycle
0.2%
0.4%
Bus
1.6%
1.1%
Carpooled
12.9%
8.5%
Car alone
81.9%
87%
Motorcycle
0.1%
0.2%
Railroad
0%
0.2%
Taxicab
0.1%
0.1%
Walked
1.6%
1.3%
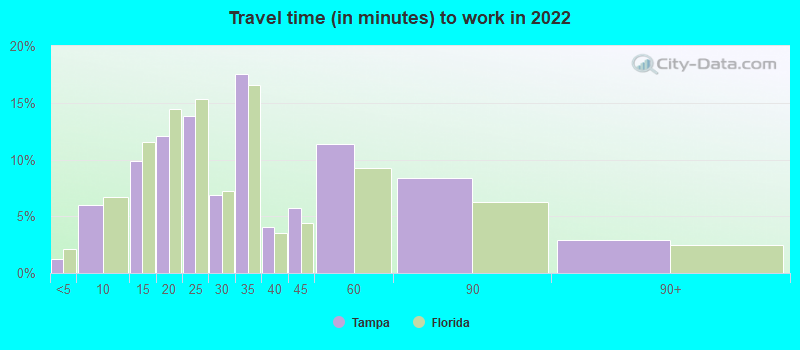
Average travel time to work
Type
San Antonio
Tampa
Average
27 min
31.4 min
Other means
23.4 min
23.2 min
Public transportation
43.5 min
45.3 min
Private vehicle occupancy
Type
San Antonio
Tampa
Average
1.2
1.1
Drove alone
84.6%
90.8%
In 2 person carpool
10.4%
6.1%
In 3 person carpool
3.3%
1.7%
In 4 person carpool
1%
0.8%
In 5-6 person carpool
0.6%
0.4%
How many people usually rode to work in the car, truck or van.
Real Estate
In terms of real estate, Tampa is generally more expensive than San Antonio. However, this also means that homes in Tampa tend to appreciate in value more quickly compared to those in San Antonio. Both cities offer a variety of housing options, from condos to single-family homes.
Neighborhoods
San Antonio's neighborhoods like Alamo Heights and Terrell Hills are known for its historic charm, while Tampa's neighborhoods like Hyde Park and Davis Islands are known for their beautiful waterfront views. Both cities offer diverse neighborhood options from bustling urban environments to quieter suburban areas.
Houses and residents
Type
San Antonio
Tampa
Houses
603,670
172,886
Average household size (people)
2.7
2.4
Median year apartment built
1987
1988
Median year house/condo built
1981
1977
Length of stay in the house since moving in
14.3 years
12.5 years
Houses occupied
549,245 (91%)
159,925 (92.5%)
Houses occupied by owners
290,123 (52.8%)
84,660 (52.9%)
Houses occupied by renters
259,122 (47.2%)
75,265 (47.1%)
Median rent asked for vacant for-rent units
$1,143
$1,369
Median monthly housing costs
$1,101
$1,326
Median price asked for vacant for-sale houses and condos
$189,213
$380,334
Estimated median house or condo value
$197,600
$336,200
Median numbers of rooms
5.1
4.9
Median number of rooms in apartments
4
3.9
Median number of rooms in houses and condos
6.2
6
Median house price - detached houses
$238,319
$477,728
Median house price - in 2-unit structures
$407,491
$191,392
Median house price - in 3-to-4-unit structures
$120,363
$249,678
Median house price - in 5 or more unit structures
$163,867
$443,026
Median house price - mobile homes
$105,850
$95,765
Median house price - Townhouses or other attached units
$188,542
$499,254
Median house price - All housing units
$234,615
$470,393
Median house age
37
38
Renting percentage
43.5%
48.3%
Housing density (houses/condos per square mile)
1,481.2
1,542.7
House value disparities
33.6%
34.7%
Household income disparities
44.7%
48.9%
Median household income for houses/condes with a mortgage
$87,382
$107,575
Median household income for apartments without a mortgage
$60,785
$66,260
Housing units without a mortgage
5,815 (3.5%)
1,024 (1.9%)
Housing units with both a second mortgage and home equity loan
6,350 (3.8%)
4,974 (9.2%)
Housing units with a mortgage
160,674 (96.5%)
53,063 (98.1%)
Housing units with a home equity loan
129 (0.1%)
110 (0.2%)
Housing units with a second mortgage
7,761 (4.7%)
5,716 (10.6%)
House/condo owner moved in on average (years ago)
13
8
House/condo renter moved in on average (years ago)
1
1
Housing units lacking complete kitchen facilities
2.1%
1.2%
Housing units lacking complete plumbing facilities
1.3%
0.9%
Housing units in structures
Housing units in structures
San Antonio
Tampa
One, detached
60.4%
54.3%
One, attached
2.7%
7.1%
Two
2.2%
2.0%
3 or 4
4.9%
4.5%
5 to 9
7.8%
4.8%
10 to 19
8.5%
5.5%
20 to 49
5.4%
5.5%
50 or more
6.6%
15.1%
Mobile homes
1.5%
1.0%
Median real estate property taxes paid for housing units
Self-employed workers in own not incorporated business
46,328
10,160
State government workers
29,486
6,101
Unpaid family workers
657
602
Industries and Occupations
San Antonio's primary industries include military, health care, government civil service, financial services, oil and gas, and tourism. Tampa's primary industries, on the other hand, include retail trade, health care, professional and business services, and tourism.
Both cities have numerous health care facilities and hospitals. San Antonio’s healthcare system includes the San Antonio Military Medical Center, the largest military health care facility in the U.S. In Tampa, the healthcare system includes the highly rated Tampa General Hospital.
Health (county statistics)
Type
San Antonio
Tampa
General health status score of residents in this county from 1 (poor) to 5 (excellent)
In terms of infrastructure, both cities have modern amenities, though Tampa is known for its excellent water views and San Antonio is reputed for its well-planned city layout. Both cities have international airports, and a network of highways connecting them to other parts of the country.
Infrastructure
Type
San Antonio
Tampa
Hospitals
130
19
TV stations
30
26
Arenas or stadiums
2
3
Bank branches located here
333
205
Bank institutions located here
41
45
Main business address for public companies
23
24
Drinking water stations with no reported violations in the past
7
58
Drinking water stations with reported violations in the past
HMDA - Conventional home purchase loans - Applications denied
Year
San Antonio
Tampa
1999
6,847
1,627
2000
2,930
1,292
2001
2,383
1,001
2002
2,313
968
2003
3,759
1,390
2004
5,180
2,093
2005
6,554
3,515
2006
6,983
4,460
2007
4,562
2,950
2008
1,781
1,075
2009
847
415
Culture and Food
Both cities boast rich and diverse cultures which are reflected in their unique culinary scenes. San Antonio has a strong Mexican heritage that is reflected in its food, with Tex-Mex cuisine being extremely popular. On the other hand, Tampa's Cuban influence is evident in its culinary offering, with Cuban sandwiches and fresh seafood being local favorites.
Sports Teams
Both cities are home to major sports teams. Tampa has the Buccaneers (NFL), Lightning (NHL), and the Rays (MLB). San Antonio, however, has one major sports team, the San Antonio Spurs (NBA).


 San Antonio, TX
 Tampa, FL