Choosing between San Antonio, TX, and South Aurora, CO, involves contrasting diverse facets ranging from costs of living, weather, crime/safety, to cultural experiences. Both cities offer unique advantages with San Antonio being recognized for its diverse culture, bustling economy, and warm climate while South Aurora stands out for its safer neighborhoods, excellent education system, and premium healthcare. Inevitably, the choice of city depends on one's personal preferences, lifestyle, and career goals.
San Antonio has a higher crime rate than South Aurora making safety a concern for those considering relocating or visiting. Although the city is upscaling its security tactics, South Aurora continues to rank notably lower in crime levels. It's important to consider personal safety when selecting a city for permanent residence or even for tourists who are looking to explore the city.
Cost of Living
The cost of living in San Antonio is notably lower than in South Aurora. Everything from housing, food, to transportation is less expensive in San Antonio, making it an attractive choice for those who are budget conscious. South Aurora, however, stands out for its high living standards, which is typically associated with a higher cost of living.
Income Tax
There's no state income tax in Texas, making it profitable, especially for high-income earners in San Antonio. In contrast, Colorado has a flat income tax rate of 4.63%, applicable to residents in South Aurora.
Property Tax
The property tax rate in San Antonio is higher than in South Aurora. This is due to the high demand for public services and amenities in the larger San Antonio.
Sales Tax
The combined state and local sales taxes for San Antonio is 8.25%, while South Aurora comes at a higher rate at 8.5%. This small difference might be negligible for some people but worth consideration for budget-conscious individuals.
Income
Type
San Antonio
South Aurora
Estimated median household income
$54,923
$80,212
Estimated per capita income
$28,860
$39,129
Cost of living index (U.S. average is 100)
87.7
110.1
If you make $50,000 in San Antonio, you will have to make $62,771 in South Aurora to maintain the same standard of living.
Geographical Conditions
San Antonio is known for its flat to gently rolling terrain, with the Texas Hill Country to the north. South Aurora, located near the Rocky Mountains, offers beautiful views, ample outdoor activities, and a higher elevation.
Geographical information
Type
San Antonio
South Aurora
Land area
407.6 sq. miles
78.4 sq. miles
Population density
3,562.3 people per sq. mile
4,199.1 people per sq. mile
Relative area comparison
San Antonio, TX South Aurora, CO
Education
South Aurora has an edge in education with its excellent public and private educational institutions. Cherry Creek School District in South Aurora ranks among the highest in Colorado. San Antonio, however, has a larger cluster of universities and colleges, providing diverse tertiary education options for residents and students from outside the city.
San Antonio boasts a thriving economy with strong sectors in healthcare, education, and government. The city's job market is growing, in part due to the presence of several Fortune 500 companies. Comparatively, South Aurora's economy is smaller but has robust industries in healthcare, retail, and education.
Biggest Employers
The military and government are some of the prominent employers in San Antonio with other large contributors being H-E-B Supermarkets and USAA. On the other hand, South Aurora's largest employers include The University of Colorado Health, Cherry Creek Schools, and The City of Aurora.
In San Antonio (Bexar County), 51.6% voted for Democrats and 47.1% for Republicans in 2012 Presidential Election. In South Aurora (Arapahoe County), 54.4% voted for Democrats and 44.4% for Republicans.
Elections
Type
Democrats
Republicans
Other
Year
San Antonio
South Aurora
San Antonio
South Aurora
San Antonio
South Aurora
2020
58.3%
61.3%
40.1%
36.6%
1.5%
2.1%
2016
54.2%
53.1%
40.8%
38.9%
5.0%
8.1%
2012
51.6%
54.4%
47.1%
44.4%
1.4%
1.3%
2008
52.3%
56.0%
46.7%
43.0%
1.0%
1.0%
2004
44.5%
47.6%
55.0%
51.6%
0.6%
0.8%
2000
44.9%
43.6%
52.3%
51.6%
2.7%
4.8%
1996
49.7%
41.9%
44.6%
50.8%
5.7%
7.3%
Breakdown of population affiliated with a religious congregation
Type
Adherents
Congregations
Religion
San Antonio
South Aurora
San Antonio
South Aurora
CATHOLIC CHURCH
30.8%
12.1%
8.6%
4.3%
SOUTHERN BAPTIST CONVENTION
6.8%
1.6%
23.5%
9.9%
MUSLIM ESTIMATE
1.2%
1.9%
0.8%
1.0%
LUTHERAN CHURCH
0.7%
1.0%
1.0%
2.6%
EPISCOPAL CHURCH
0.6%
0.4%
1.6%
1.7%
EVANGELICAL LUTHERAN CHURCH IN AMERICA
0.6%
2.0%
2.2%
4.3%
EVANGELICAL PRESBYTERIAN CHURCH
0.0%
0.6%
0.1%
2.6%
VINEYARD USA
0.0%
0.5%
0.2%
0.3%
Weather
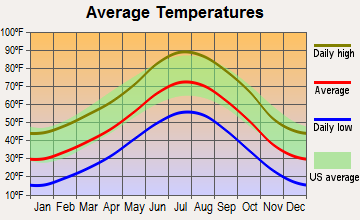
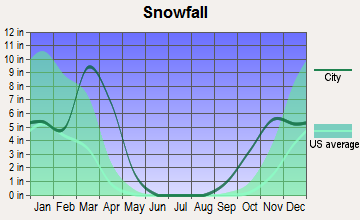
Weather is a stark contrasting factor between the two cities. San Antonio has a humid subtropical climate with hot summers and mild winters. In contrast, South Aurora has a semi-arid continental climate, experiencing a chance of snow during winter and comfortable temperatures during summer. Depending on personal preference, one might enjoy the sunny summers of San Antonio or the snow-capped winters in South Aurora.
Weather and climate
Type
San Antonio
South Aurora
Temperature - Average
68.7°F
49.9°F
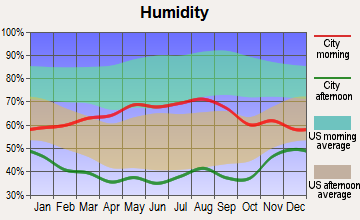
Humidity - Average morning or afternoon humidity
74.9%
50.6%
Humidity - Differences between morning and afternoon humidity
37%
20%
Humidity - Maximum monthly morning or afternoon humidity
87%
55%
Humidity - Minimum monthly morning or afternoon humidity
50%
35%
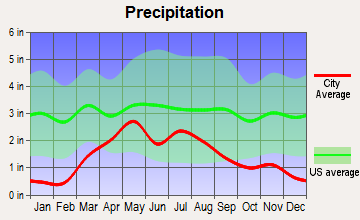
Precipitation - Yearly average
32.2 in
17.6 in
Snowfall - Yearly average
1.2 in
114 in
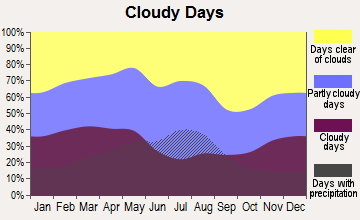
Clouds - Number of days clear of clouds
17.5%
19.2%
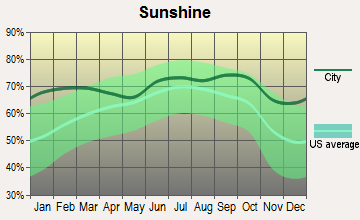
Sunshine amount - Average
62.4%
75.6%
Sunshine amount - Differences during a year
24%
10%
Sunshine amount - Maximum monthly
72%
74%
Sunshine amount - Minimum monthly
48%
64%
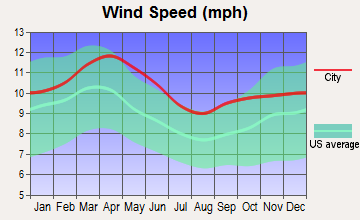
Wind speed - Average
8.9 mph
8.6 mph
Average climate in San Antonio, Texas
Average climate in South Aurora, Colorado
Air pollution
Type
AQI
CO
NO2
OZONE
PB
PM10
PM25
SO2
Year
San Antonio
South Aurora
San Antonio
South Aurora
San Antonio
South Aurora
San Antonio
South Aurora
South Aurora
San Antonio
South Aurora
San Antonio
South Aurora
San Antonio
South Aurora
2018
83
99
N/A
0.37
4.9
21.6
25.6
31.9
N/A
N/A
N/A
29.2
8.0
8.5
0.2
0.7
2017
85
95
N/A
0.37
5.1
22.0
26.9
31.8
N/A
N/A
N/A
22.0
8.4
8.4
1.7
0.9
2016
79
90
N/A
0.43
5.2
24.0
25.7
31.3
N/A
N/A
N/A
22.6
8.2
8.1
0.8
1.0
2015
76
101
N/A
0.44
4.7
23.0
25.4
30.2
N/A
N/A
N/A
20.6
9.2
9.6
0.7
1.1
2014
84
94
N/A
0.43
5.5
22.0
27.3
30.3
N/A
N/A
N/A
22.7
9.5
10.1
0.6
1.3
2013
79
84
N/A
0.39
4.1
19.7
28.2
30.7
N/A
N/A
N/A
22.0
9.0
N/A
0.7
1.4
2012
77
90
N/A
0.34
4.5
18.9
27.5
31.4
N/A
N/A
18.1
24.3
9.2
N/A
N/A
1.2
2011
85
91
N/A
0.34
4.6
18.1
29.2
31.5
N/A
N/A
18.9
23.8
9.9
N/A
N/A
1.5
2010
75
81
0.21
0.41
7.2
16.3
25.8
29.3
N/A
N/A
17.1
26.6
9.2
N/A
N/A
1.0
2009
74
79
0.23
0.37
8.3
14.1
25.7
27.3
0.005
N/A
19.5
22.6
9.8
N/A
0.4
1.3
2008
84
85
0.26
0.41
9.3
17.3
26.8
29.1
0.008
N/A
19.8
25.5
10.1
N/A
0.5
1.6
2007
83
96
0.49
0.41
9.3
20.6
26.3
25.7
0.007
N/A
23.4
28.9
10.3
N/A
N/A
1.2
2006
86
89
0.51
0.50
9.7
19.0
32.7
25.4
0.026
N/A
24.8
28.0
9.8
N/A
N/A
1.4
2005
86
86
0.53
0.57
10.7
21.3
30.8
22.7
0.106
N/A
22.3
29.6
10.1
N/A
N/A
1.5
2004
76
82
0.48
0.61
10.4
21.2
29.6
21.6
0.035
N/A
22.4
28.6
N/A
N/A
N/A
1.8
2003
77
106
0.57
0.61
10.3
21.2
28.5
23.4
0.038
N/A
26.7
32.6
N/A
N/A
N/A
1.9
2002
88
86
0.52
0.64
11.2
19.2
30.3
23.0
0.027
N/A
N/A
35.7
N/A
N/A
N/A
2.5
2001
78
95
0.57
0.79
11.9
23.8
29.3
20.8
0.029
N/A
N/A
32.6
N/A
N/A
N/A
2.6
2000
82
93
0.52
0.77
11.7
13.7
29.6
21.7
0.032
N/A
N/A
12.2
N/A
N/A
N/A
2.1
Natural disasters
Type
San Antonio
South Aurora
Tornado activity compared to U.S. average
91.5%
137.7%
Earthquake activity compared to U.S. average
73.7%
797.1%
Natural disasters compared to U.S. average
21%
10%
Transportation
San Antonio has a more extensive transit system due to its larger size, including buses, bikes, and taxis. South Aurora, being part of the Denver metropolitan area, also has a well-connected public transportation system with buses and light rail, making it easy to navigate the city and suburbs.
Transport
Type
San Antonio
South Aurora
Amtrak stations
1
0
Amtrak stations nearby
1
2
FAA registered aircraft
987
0
FAA registered aircraft manufacturers and dealers
29
0
Means of transportation to work
Type
San Antonio
South Aurora
Bicycle
0.2%
0.2%
Bus
1.6%
3.5%
Carpooled
12.9%
12%
Car alone
81.9%
78.6%
Motorcycle
0.1%
0.1%
Walked
1.6%
1.3%
Average travel time to work
Type
San Antonio
South Aurora
Average
27 min
27.5 min
Real Estate
Real estate in San Antonio is cheaper compared to South Aurora. There's also more variety to choose from due to San Antonio's larger size. Despite higher prices, South Aurora offers high-quality housing in safe, family-oriented neighborhoods.
Neighborhoods
San Antonio's neighborhoods offer cultural diversity, vibrancy, and a sense of community. They range from historic districts to upscale suburban communities. South Aurora neighbourhoods are family-friendly with a quieter, suburban atmosphere.
Houses and residents
Type
San Antonio
South Aurora
Houses
603,670
119,373
Average household size (people)
2.7
2.6
Houses occupied
549,245 (91%)
115,977 (97.2%)
Houses occupied by owners
290,123 (52.8%)
76,163 (65.7%)
Houses occupied by renters
259,122 (47.2%)
39,814 (34.3%)
Median rent asked for vacant for-rent units
$1,143
$1,519
Median price asked for vacant for-sale houses and condos
$189,213
$836,561
Estimated median house or condo value
$197,600
$439,151
Median number of rooms in apartments
4
3.9
Median number of rooms in houses and condos
6.2
7.2
Renting percentage
43.5%
38.4%
Housing density (houses/condos per square mile)
1,481.2
1,522.9
Household income disparities
44.7%
40.8%
Housing units without a mortgage
5,815 (3.5%)
6,903 (10.6%)
Housing units with both a second mortgage and home equity loan
6,350 (3.8%)
358 (0.6%)
Housing units with a mortgage
160,674 (96.5%)
57,942 (89.4%)
Housing units with a home equity loan
129 (0.1%)
5,373 (8.3%)
Housing units with a second mortgage
7,761 (4.7%)
10,116 (15.6%)
Housing units lacking complete kitchen facilities
2.1%
0.4%
Housing units lacking complete plumbing facilities
Self-employed workers in own not incorporated business
46,328
8,665
State government workers
29,486
4,200
Unpaid family workers
657
351
Industries and Occupations
San Antonio's diverse economy is reflected in its industries with healthcare, education, and public administration leading. In South Aurora, occupations are centered around health care and social assistance, retail trade, and educational services.
Both cities provide excellent healthcare facilities. However, South Aurora edges out with some of the top-rated hospitals in the state and nation, including the University of Colorado Hospital and Children's Hospital Colorado.
Health (county statistics)
Type
San Antonio
South Aurora
General health status score of residents in this county from 1 (poor) to 5 (excellent)
Both cities offer good infrastructure, but San Antonio has a more established system due to its size and economic activity. South Aurora's infrastructure is also well developed as it's part of the Denver Metropolitan Area.
Infrastructure
Type
San Antonio
South Aurora
TV stations
30
14
Culture and Food
San Antonio is renowned for its rich cultural heritage and Tex-Mex cuisine. The city's events like the Alamo re-enactments and Fiesta San Antonio attracts visitors year-round. South Aurora's culture scene is smaller but growing, with a variety of delicious food and drinks ranging from craft beers to farm-to-table cuisine.
Sports Teams
Sports fans will enjoy both San Antonio and South Aurora. San Antonio is home to the NBA's Spurs, while South Aurora residents generally support Denver-based teams like the Broncos (NFL), Nuggets (NBA), Rockies (MLB), and Avalanche (NHL).
 San Antonio, TX
 South Aurora, CO