San Antonio, TX vs Atlanta, GA - Advanced U.S. city comparison tool

San Antonio, TX vs Atlanta, GA

San Antonio, Texas, and Atlanta, Georgia, are two lively cities with distinctive characters, making them attractive destinations to relocate to or visit. Here, we will compare these two cities considering crime/safety, weather, cost of living, education, economy, infrastructure, industries and occupations, real-estate, neighborhoods, public transit, taxes, culture and food, sports teams, geographical conditions, and healthcare.
 
 
Distance between San Antonio, TX and Atlanta, GA : 881.0 miles

San Antonio's population is larger by 192%. Its population has grown by 307,207 people (26.8%) since 2000. The population of Atlanta has grown by 79,987 people (19.2%) during that time.

Population
Type San Antonio Atlanta
Population 1,451,853 496,461
Female / male percentage 50.7% / 49.3%
50.7%
49.3%
50.9% / 49.1%
50.9%
49.1%
Racial makeup - percentage
Ethnicity San AntonioAtlanta
Hispanic 66.4% 5.8%
White Non-Hispanic 22.1% 39.2%
Black 5.8% 44.1%
Asian 2.7% 5.3%
Two or more 2.3% 5.0%
American Indian 0.1% 0.3%
Pacific Islander 0.1% 0.1%
Racial makeup - absolute values
Ethnicity San AntonioAtlanta
Hispanic 963,897 28,976
White Non-Hispanic 321,468 194,428
Black 84,366 218,831
Asian 39,158 26,141
Two or more 33,711 24,937
Pacific Islander 2,089 318
American Indian 1,614 1,397

Crime and Safety

San Antonio's crime rates are slightly higher than the national average, but it really depends on the neighborhood as downtown tends to be safer. Atlanta has similar levels of crime, with pockets of high and low rates. It's worth researching specific neighborhoods in both cities to understand crime rates and precautions more accurately. Tourists generally feel safe in the popular regions of both cities.

Crime by year per 100,000 residents
Type City-data.com crime indexRobberies per 100,000Murders per 100,000Rapes per 100,000Assaults per 100,000Burglaries per 100,000Theft per 100,000Auto theft per 100,000Arson per 100,000
Year San AntonioAtlantaSan AntonioAtlantaSan AntonioAtlantaSan AntonioAtlantaSan AntonioAtlantaSan AntonioAtlantaSan AntonioAtlantaSan AntonioAtlantaSan AntonioAtlanta
2020 398.9 140.2 137.5 53.1 8.3 11.4 75.5 7.9 514.2 188.0 503.4 95.4 2,679.8 836.7 443.7 215.9 15.0 1.7
2019 437.8 342.5 126.0 152.4 6.7 13.8 104.5 34.5 471.1 398.9 524.1 428.3 3,301.1 2,359.2 499.0 468.1 11.6 10.4
2018 395.1 469.0 114.8 221.5 7.0 17.7 87.4 49.4 417.5 480.1 592.3 621.2 3,005.9 3,366.4 395.6 666.8 12.1 18.1
2017 456.4 520.8 151.1 293.6 8.2 16.4 83.5 58.6 464.7 567.2 770.8 704.3 3,622.6 3,387.2 451.4 685.0 13.6 15.4
2016 475.4 591.8 148.9 438.0 9.9 23.5 79.4 28.8 479.3 593.3 816.4 933.4 3,891.4 3,470.3 482.6 844.9 16.9 10.6
2015 427.5 612.9 135.7 429.3 6.4 20.2 71.7 36.6 373.4 633.5 794.8 1,028.8 3,812.8 3,549.1 422.0 921.4 17.8 10.8
2014 441.2 656.0 124.4 512.6 7.2 20.5 75.4 33.2 332.3 661.1 864.1 1,203.9 4,053.9 3,631.0 499.8 912.5 20.9 16.5
2013 458.7 667.0 156.6 523.9 5.1 18.4 47.4 23.3 421.6 657.4 1,060.9 1,316.6 4,184.2 3,804.3 469.9 982.7 22.5 15.7
2012 441.7 728.6 135.1 520.8 6.4 19.0 39.8 25.9 321.8 813.4 1,135.3 1,416.8 4,393.3 3,938.3 461.3 1,178.4 17.8 23.6
2011 440.6 786.4 131.7 550.6 6.6 20.7 36.3 34.8 344.7 826.7 1,131.4 1,762.3 4,400.4 4,059.4 434.8 1,262.2 15.4 28.4
2010 499.1 776.4 177.8 514.8 6.0 22.1 35.2 21.2 416.5 810.7 1,303.4 1,908.6 4,926.5 4,224.0 426.2 1,200.7 24.6 22.6
2009 497.5 659.4 195.3 492.9 7.2 14.5 45.7 24.4 322.7 618.4 1,322.0 1,648.0 4,926.3 3,528.8 422.4 1,035.6 30.3 28.4
2008 552.6 786.9 203.0 620.6 8.6 19.7 31.4 23.6 474.8 724.9 1,399.3 1,874.1 5,228.6 4,221.1 592.4 1,217.6 38.6 27.6
2007 489.6 862.6 185.7 719.3 9.3 25.9 48.2 29.8 313.2 848.8 1,271.9 1,781.5 4,607.0 4,092.8 510.6 1,411.7 34.9 31.2
2006 479.7 793.0 179.6 609.1 9.2 22.6 39.8 35.2 388.7 886.8 1,132.2 1,523.5 4,440.5 3,901.2 512.0 1,210.0 37.5 36.0
2005 391.3 625.3 171.4 664.3 6.8 20.9 47.2 51.8 411.8 937.9 1,143.2 1,543.7 4,826.5 4,410.1 475.3 1,336.5 33.7 46.0
2004 400.6 677.6 172.2 724.5 7.6 25.8 54.8 62.1 400.6 1,029.4 1,191.8 1,563.9 4,928.1 4,813.9 458.8 1,338.4 38.5 48.1
2003 399.0 768.5 169.9 858.6 7.0 34.3 44.3 65.2 376.8 1,011.5 1,205.4 1,871.0 5,126.9 5,319.9 511.4 1,678.5 44.5 38.3

City-data.com crime index counts serious crimes and violent crime more heavily. It adjusts for the number of visitors and daily workers commuting into cities. (higher means more crime, U.S. average = 301.1)


Crime per year
Type City-data.com crime indexRobberiesMurdersRapesAssaultsBurglariesTheftAuto theftArson
Year San AntonioAtlantaSan AntonioAtlantaSan AntonioAtlantaSan AntonioAtlantaSan AntonioAtlantaSan AntonioAtlantaSan AntonioAtlantaSan AntonioAtlantaSan AntonioAtlanta
2019 437.8 342.5 1,965 773 105 70 1,630 175 7,346 2,024 8,172 2,173 51,469 11,970 7,781 2,375 181 53
2018 395.1 469.0 1,767 1,099 107 88 1,346 245 6,427 2,382 9,118 3,082 46,271 16,701 6,089 3,308 186 90
2017 456.4 520.8 2,298 1,413 124 79 1,270 282 7,067 2,730 11,722 3,390 55,090 16,304 6,864 3,297 207 74
2016 475.4 591.8 2,232 2,070 149 111 1,190 136 7,183 2,804 12,235 4,411 58,318 16,400 7,233 3,993 254 50
2015 427.5 612.9 1,986 1,995 94 94 1,049 170 5,465 2,944 11,632 4,781 55,803 16,493 6,176 4,282 261 50
2014 441.2 656.0 1,777 2,329 103 93 1,077 151 4,747 3,004 12,344 5,470 57,908 16,498 7,140 4,146 298 75
2013 458.7 667.0 2,192 2,363 72 83 663 105 5,901 2,965 14,850 5,938 58,567 17,158 6,577 4,432 315 71
2012 441.7 728.6 1,864 2,276 89 83 549 113 4,441 3,555 15,668 6,192 60,633 17,212 6,367 5,150 245 103
2011 440.6 786.4 1,785 2,343 89 88 492 148 4,672 3,518 15,334 7,499 59,641 17,274 5,893 5,371 209 121
2010 499.1 776.4 2,360 2,162 79 93 467 89 5,528 3,405 17,301 8,016 65,395 17,741 5,657 5,043 327 95
2009 497.5 659.4 2,683 2,725 99 80 628 135 4,434 3,419 18,164 9,112 67,684 19,511 5,803 5,726 416 157
2008 552.6 786.9 2,743 3,308 116 105 424 126 6,416 3,864 18,908 9,989 70,651 22,499 8,005 6,490 521 147
2007 489.6 862.6 2,445 3,577 122 129 635 148 4,125 4,221 16,750 8,859 60,669 20,353 6,724 7,020 459 155
2006 479.7 793.0 2,321 2,959 119 110 514 171 5,023 4,308 14,629 7,401 57,377 18,952 6,615 5,878 484 175
2005 391.3 625.3 2,154 2,861 86 90 593 223 5,174 4,039 14,365 6,648 60,649 18,993 5,973 5,756 424 198
2004 400.6 677.6 2,127 3,116 94 111 677 267 4,948 4,427 14,720 6,726 60,868 20,703 5,667 5,756 476 207
2003 399.0 768.5 2,060 3,701 85 148 537 281 4,570 4,360 14,619 8,065 62,179 22,931 6,202 7,235 540 165

City-data.com crime index counts serious crimes and violent crime more heavily. It adjusts for the number of visitors and daily workers commuting into cities. (higher means more crime, U.S. average = 301.1)

Sex Offenders

According to our data, there are 3,802 registered sex offenders living in San Antonio and 1,974 registered sex offenders living in .
The ratio of residents to sex offenders in San Antonio is 393 to 1; the ratio in Atlanta is 239 to 1.
The number of registered sex offenders compared to the number of residents is a smaller in San Antonio than in Atlanta.

Cost of Living

The cost of living in San Antonio is generally lower than in Atlanta, which can be appealing to relocators. Categories like housing, groceries, healthcare, and transportation contribute to this difference. Atlanta, as a larger city with a broader economy, can be a bit pricier, though it still compares well to other major US cities.

Income Tax

Texas, including San Antonio, does not have a state income tax, which can be a significant financial factor for relocation. Georgia, including Atlanta, does levy a state income tax with rates ranging from 1% to 6%.

Property Tax

San Antonio has a higher property tax rate than Atlanta. However, home prices in San Antonio are often lower, so overall payments may be comparable between the two cities.

Sales Tax

Texas has a state sales tax of 6.25%, but local taxes in San Antonio can bring it up to 8.25%. Georgia's state sales tax is 4%, but with local taxes in Atlanta, it can be as high as 8.9%.
Income
Type San Antonio Atlanta
Estimated median household income $54,923 $74,107
Estimated per capita income $28,860 $55,051
Cost of living index (U.S. average is 100) 87.7 104.3

If you make $50,000 in San Antonio, you will have to make $59,464 in Atlanta to maintain the same standard of living.

Geographical Conditions

San Antonio is located in south-central Texas with a varied landscape featuring hills, rivers, and coastal plains. Atlanta is situated in the foothills of the Appalachian Mountains, providing a diverse natural backdrop.
Geographical information
Type San Antonio Atlanta
Land area 407.6 sq. miles 131.7 sq. miles
Population density 3,562.3 people per sq. mile 3,768.3 people per sq. mile
Relative area comparison
San Antonio, TX Atlanta, GA
First ancestry reported - percentage
Ancestry San AntonioAtlanta
German 2.9% 2.5%
Irish 1.7% 2.6%
English 1.6% 4.5%
Italian 0.6% 1.2%
Polish 0.4% 0.6%
French 0.3% 0.7%
Scotch-Irish 0.3% 0.8%
Scottish 0.3% 0.6%
Dutch 0.1% 0.2%
Norwegian 0.1% 0.2%
Russian 0.1% 0.4%
Greek 0.0% 0.3%
Population origin - absolute values
Ancestry San AntonioAtlanta
German 27,787 7,328
Irish 15,975 7,650
English 15,429 13,247
Italian 6,027 3,570
Polish 3,706 1,761
French 3,128 2,079
Scottish 2,905 1,744
Scotch-Irish 2,557 2,506
Norwegian 1,176 731
Dutch 1,089 626
Arab 982 82
Russian 950 1,197
Czech 873 101
Swedish 740 505
French Canadian 690 474
Portuguese 638 384
Welsh 596 567
Hungarian 443 189
Greek 434 813
Danish 343 108
Foreign born residents - absolute values
Type Count
Region San AntonioAtlanta
All 211,380 40,642
Africa 5,275 4,139
Asia 37,127 16,803
Europe 7,886 6,889
Latin America 155,191 11,824
North America 1,425 1,511
Oceania 528 305
Foreign born residents - percentage
Type Percentage
Region San AntonioAtlanta
All 14.5% 8.2%
Africa 0.4% 0.8%
Asia 2.5% 3.4%
Europe 0.5% 1.4%
Latin America 10.6% 2.4%
North America 0.1% 0.3%

Education

Both cities are home to highly rated public and private schools, though Atlanta boasts Emory University and the Georgia Institute of Technology. San Antonio also offers excellent options in advanced education with the University of Texas at San Antonio and other institutions.
School enrollment
Type San Antonio Atlanta
Nursery, preschool 21,297 (5.7%) 6,595 (5.3%)
Kindergarten 19,263 (5.2%) 4,430 (3.6%)
Grade 1 to 4 80,911 (21.7%) 20,135 (16.2%)
Grade 5 to 8 77,401 (20.8%) 18,050 (14.6%)
Grade 9 to 12 81,405 (21.9%) 17,029 (13.7%)
College undergrad 73,408 (19.7%) 43,336 (34.9%)
Graduate or professional 18,390 (4.9%) 14,471 (11.7%)
Students in private schools - absolute values
Type Count
Grade San AntonioAtlanta
Grades 1 to 8 (elementary and middle school) 15,798 9,516
Grades 9 to 12 (high school) 6,486 3,007
Undergraduate colleges 16,895 7,107
Students in private schools - percentage
Type Percentage
Grade San AntonioAtlanta
Grades 1 to 8 (elementary and middle school) 10.0% 24.9%
Grades 9 to 12 (high school) 8.0% 17.7%
Undergraduate colleges 23.0% 16.4%
Educational attainment
Type San Antonio Atlanta
Less than high school 16.6% 7.3%
High school or equiv. 25.3% 14.5%
Less than 1 year of college 7.3% 3.3%
1 or more years of college 14.7% 9.8%
Associate degree 7.9% 5.3%
Bachelor's degree 17.4% 34.1%
Master's degree 7.3% 15.9%
Profess. school degree 2.2% 6.3%
Doctorate degree 1.4% 3.5%
Education level (25-year-olds and older)
Type San Antonio Atlanta
Bachelor's degree or higher 28.3% 59.8%
Graduate or professional degree 10.9% 25.8%
High school or higher 83.4% 92.7%

Work and Economy

San Antonio's economy is driven by sectors like healthcare, tourism, and military/defense while Atlanta stands out in sectors like film, television, and IT. Well-established Fortune 500 companies like UPS, Home Depot, and Delta Air Lines are based in Atlanta, contributing to the viability of the city's job market.

Biggest Employers

In San Antonio, the biggest employers are H-E-B, the city government, and USAA. On the other side, The Home Depot, Delta Air Lines, and Coca-Cola are headquartered in Atlanta, employing thousands.
Employment and residency - absolute values
Kind San AntonioAtlanta
Work and live in this city 428,926 106,145
Work and live in this county 643,655 209,772
Workers who work outside the city they live in 715,720 310,329
Workers who work outside the county they live in 33,919 48,664
Working at home 102,316 99,940
Not working at home 575,258 158,496
Daytime population change due to commuting 67,989 259,957
Employment and residency - percentage
Kind San AntonioAtlanta
Work and live in this city 87.3% 59.3%
Work and live in this county 95.0% 81.2%
Workers who work outside the city they live in 12.7% 40.7%
Workers who work outside the county they live in 5.0% 18.8%
Working at home 15.1% 38.7%
Not working at home 84.9% 61.3%
Daytime population change due to commuting 5.9% 62.4%
Geographical mobility: all
Type all
Mobility San AntonioAtlanta
Same house 1 year ago 83.6% 76.8%
Moved from abroad 0.6% 0.6%
Moved within same county 11.2% 9.6%
Moved from different state 1.9% 5.8%
Moved within same state 2.7% 7.2%
Geographical mobility: Asian
Type Asian
Mobility San AntonioAtlanta
Same house 1 year ago 83.7% 54.2%
Moved from abroad 1.1% 5.3%
Moved within same county 5.1% 14.8%
Moved from different state 6.6% 10.6%
Moved within same state 3.5% 15.1%
Geographical mobility: Black
Type Black
Mobility San AntonioAtlanta
Same house 1 year ago 78.7% 80.2%
Moved from abroad 0.2% 0.1%
Moved within same county 13.9% 7.4%
Moved from different state 2.2% 4.9%
Moved within same state 5.0% 7.4%
Geographical mobility: White
Type White
Mobility San AntonioAtlanta
Same house 1 year ago 81.5% 75.3%
Moved from abroad 0.8% 0.3%
Moved within same county 11.4% 11.7%
Moved from different state 2.8% 5.7%
Moved within same state 3.6% 7.1%
Building permits
Type Average valueCount
City San AntonioAtlantaSan AntonioAtlanta
1997 $60,500 $99,900 4,323 308
1998 $69,900 $105,000 5,752 449
1999 $68,900 $110,700 5,892 760
2000 $72,700 $116,000 5,570 803
2001 $73,200 $122,200 6,281 781
2002 $68,300 $125,900 6,454 759
2003 $129,500 $129,300 6,105 980
2004 $131,300 $134,200 7,431 1,356
2005 $144,500 $144,300 8,266 1,564
2006 $155,100 $154,800 7,266 1,842
2007 $166,500 $166,000 4,253 1,247
2008 $174,900 $173,200 2,665 502
2009 $178,000 $179,400 2,836 169
2010 $176,100 $175,800 2,337 83
2011 $179,700 $182,200 1,594 227
2012 $185,200 $195,400 1,896 359
2013 $177,200 $201,500 2,102 473
2014 $214,100 $213,300 2,270 545
2015 $208,100 $224,200 2,217 760
2016 $205,700 $227,900 2,152 855
2017 $200,100 $230,500 2,489 922
2018 $197,900 $235,200 3,266 1,184
2019 $237,200 $236,800 3,890 728
2020 $234,300 $233,100 4,275 373
2021 $237,500 $240,200 6,567 855

There were 6,567 building permits issued in San Antonio in 2012 (4973 more than in 2011) compared to 855 building permits issued in Atlanta in 2012 (628 more than in 2011).

In San Antonio (Bexar County), 51.6% voted for Democrats and 47.1% for Republicans in 2012 Presidential Election. In Atlanta (Fulton County), 64.3% voted for Democrats and 34.5% for Republicans.

Elections
Type DemocratsRepublicansOther
Year San AntonioAtlantaSan AntonioAtlantaSan AntonioAtlanta
2020 58.3% 72.6% 40.1% 26.2% 1.5% 1.2%
2016 54.2% 67.8% 40.8% 26.9% 5.0% 5.3%
2012 51.6% 64.3% 47.1% 34.5% 1.4% 1.2%
2008 52.3% 67.2% 46.7% 32.2% 1.0% 0.6%
2004 44.5% 59.4% 55.0% 40.0% 0.6% 0.7%
2000 44.9% 57.9% 52.3% 39.9% 2.7% 2.2%
1996 49.7% 58.9% 44.6% 36.9% 5.7% 4.1%
Breakdown of population affiliated with a religious congregation
Type AdherentsCongregations
Religion San AntonioAtlantaSan AntonioAtlanta
CATHOLIC CHURCH 30.8% 9.9% 8.6% 2.4%
SOUTHERN BAPTIST CONVENTION 6.8% 7.9% 23.5% 14.7%
MUSLIM ESTIMATE 1.2% 1.4% 0.8% 1.7%
LUTHERAN CHURCH 0.7% 0.1% 1.0% 0.7%
EPISCOPAL CHURCH 0.6% 2.1% 1.6% 2.1%
EVANGELICAL LUTHERAN CHURCH IN AMERICA 0.6% 0.6% 2.2% 1.5%
AMERICAN BAPTIST CHURCHES IN THE USA 0.2% 0.8% 0.3% 1.1%
SEVENTH DAY ADVENTIST CHURCH 0.2% 1.2% 1.3% 1.5%

Weather

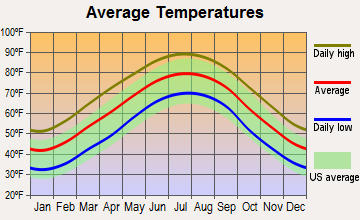
San Antonio experiences a semi-tropical climate with mild winters and hot, humid summers. It rarely sees snow and experiences a lower rainfall than many other US cities. Atlanta, on the other hand, enjoys a humid subtropical climate with all four seasons. Winters can get chilly, but snowfall is infrequent. Hot, humid summers in both cities share common ground.
Weather and climate
Type San Antonio Atlanta
Temperature - Average 68.7°F 61.7°F
Humidity - Average morning or afternoon humidity 74.9% 73.9%
Humidity - Differences between morning and afternoon humidity 37% 38%
Humidity - Maximum monthly morning or afternoon humidity 87% 87%
Humidity - Minimum monthly morning or afternoon humidity 50% 49%
Precipitation - Yearly average 32.2 in 51.4 in
Snowfall - Yearly average 1.2 in 4 in
Clouds - Number of days clear of clouds 17.5% 18.3%
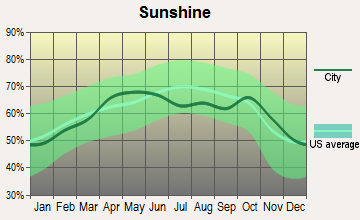
Sunshine amount - Average 62.4% 65.6%
Sunshine amount - Differences during a year 24% 17%
Sunshine amount - Maximum monthly 72% 67%
Sunshine amount - Minimum monthly 48% 50%
Wind speed - Average 8.9 mph 9 mph

Average climate in San Antonio, Texas

Chicago, Illinois average temperatures Chicago, Illinois average precipitation Chicago, Illinois humidity Chicago, Illinois wind speed Chicago, Illinois snowfall Chicago, Illinois sunshine Chicago, Illinois clear and cloudy days
 

Average climate in Atlanta, Georgia

Chicago, Illinois average temperatures Chicago, Illinois average precipitation Chicago, Illinois humidity Chicago, Illinois wind speed Chicago, Illinois snowfall Chicago, Illinois sunshine Chicago, Illinois clear and cloudy days
 

Air pollution
Type AQICONO2OZONEPBPM10PM25SO2
Year San AntonioAtlantaSan AntonioAtlantaSan AntonioAtlantaSan AntonioAtlantaAtlanta San AntonioAtlantaSan AntonioAtlantaSan AntonioAtlanta
2018 83 84 N/A 0.27 4.9 N/A 25.6 24.7 N/A N/A N/A 17.5 8.0 10.6 0.2 0.8
2017 85 87 N/A 0.31 5.1 N/A 26.9 24.7 N/A N/A N/A 17.5 8.4 11.3 1.7 1.2
2016 79 105 N/A 0.31 5.2 N/A 25.7 25.9 N/A N/A N/A 17.2 8.2 11.1 0.8 1.0
2015 76 91 N/A 0.31 4.7 N/A 25.4 23.9 N/A N/A N/A 17.6 9.2 10.2 0.7 0.9
2014 84 88 N/A 0.31 5.5 N/A 27.3 24.0 N/A N/A N/A 18.4 9.5 9.1 0.6 1.1
2013 79 88 N/A 0.30 4.1 N/A 28.2 23.7 N/A N/A N/A 18.0 9.0 8.7 0.7 1.0
2012 77 109 N/A 0.33 4.5 N/A 27.5 26.2 N/A N/A 18.1 19.5 9.2 9.8 N/A 1.1
2011 85 98 N/A 0.33 4.6 N/A 29.2 27.5 N/A N/A 18.9 21.2 9.9 12.0 N/A 1.7
2010 75 102 0.21 0.35 7.2 N/A 25.8 25.8 N/A N/A 17.1 18.5 9.2 12.5 N/A 1.9
2009 74 96 0.23 N/A 8.3 N/A 25.7 25.2 N/A N/A 19.5 18.5 9.8 13.8 0.4 1.7
2008 84 99 0.26 0.53 9.3 15.3 26.8 31.2 0.003 N/A 19.8 22.5 10.1 16.3 0.5 2.5
2007 83 124 0.49 0.45 9.3 17.0 26.3 33.1 0.003 N/A 23.4 29.4 10.3 18.1 N/A 2.7
2006 86 129 0.51 0.58 9.7 17.9 32.7 31.3 0.003 N/A 24.8 22.9 9.8 19.7 N/A 3.4
2005 86 123 0.53 0.55 10.7 17.2 30.8 29.0 0.005 N/A 22.3 25.5 10.1 15.8 N/A 3.2
2004 76 118 0.48 0.54 10.4 16.9 29.6 28.8 0.004 N/A 22.4 22.9 N/A 14.6 N/A 2.8
2003 77 112 0.57 0.56 10.3 16.4 28.5 26.7 0.004 N/A 26.7 22.2 N/A 15.4 N/A 3.0
2002 88 120 0.52 0.60 11.2 19.4 30.3 27.9 N/A N/A N/A 23.2 N/A 13.1 N/A 3.0
2001 78 117 0.57 0.69 11.9 23.3 29.3 27.2 N/A N/A N/A 27.0 N/A N/A N/A 3.1
2000 82 132 0.52 0.50 11.7 22.9 29.6 31.2 N/A N/A N/A 28.4 N/A N/A N/A 3.2
Natural disasters
Type San Antonio Atlanta
Tornado activity compared to U.S. average 91.5% 159.5%
Earthquake activity compared to U.S. average 73.7% 153.4%
Natural disasters compared to U.S. average 21% 15%

Transportation

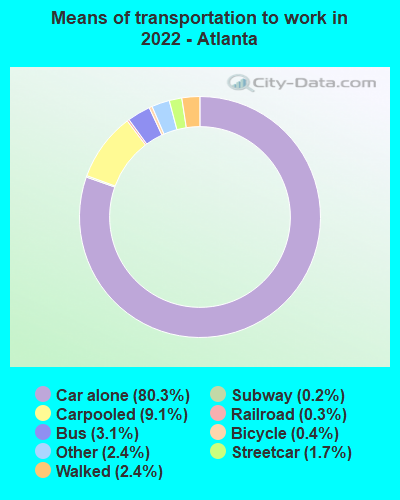
Public transportation is more amply provided in Atlanta with its MARTA system. San Antonio depends more on vehicular transport but is enhancing its VIA system.
Transport
Type San Antonio Atlanta
Amtrak stations 1 1
Amtrak stations nearby 1 1
FAA registered aircraft 987 1
FAA registered aircraft manufacturers and dealers 29 28
Means of transportation to work
Type San Antonio Atlanta
Bicycle 0.2% 0.5%
Bus 1.6% 2.1%
Carpooled 12.9% 7.6%
Car alone 81.9% 84%
Motorcycle 0.1% 0.1%
Railroad 0% 0.2%
Streetcar 0% 1.1%
Subway 0% 0.4%
Taxicab 0.1% 0.3%
Walked 1.6% 1.9%
Means of transportation to work
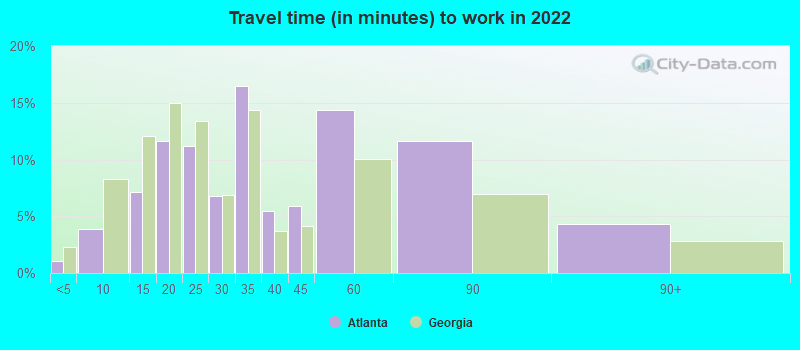
Average travel time to work
Type San Antonio Atlanta
Average 27 min 34.9 min
Other means 23.4 min 24.4 min
Public transportation 43.5 min 47.8 min
Travel time to work
Time leaving to work
Travel time to work
Time leaving to work
Private vehicle occupancy
Type San Antonio Atlanta
Average 1.2 1.1
Drove alone 84.6% 92.5%
In 2 person carpool 10.4% 6.7%
In 3 person carpool 3.3% 0.6%
In 4 person carpool 1% 0.3%
In 5-6 person carpool 0.6% 0%

How many people usually rode to work in the car, truck or van.

Real Estate

Real estate in San Antonio is generally more affordable than in Atlanta, offering a lower median home price. Additionally, San Antonio's property tax rate is higher than Atlanta's, which needs to be considered.

Neighborhoods

Both cities feature diverse neighborhoods catering to various lifestyles. San Antonio's Alamo Heights and Stone Oak are sought after, while Atlanta's Buckhead and Midtown are trendy areas.
Houses and residents
Type San Antonio Atlanta
Houses 603,670 253,355
Average household size (people) 2.7 2.1
Median year apartment built 1987 1996
Median year house/condo built 1981 1976
Length of stay in the house since moving in 14.3 years 12.2 years
Houses occupied 549,245 (91%) 232,720 (91.9%)
Houses occupied by owners 290,123 (52.8%) 113,092 (48.6%)
Houses occupied by renters 259,122 (47.2%) 119,628 (51.4%)
Median rent asked for vacant for-rent units $1,143 $1,226
Median monthly housing costs $1,101 $1,504
Median price asked for vacant for-sale houses and condos $189,213 $325,147
Estimated median house or condo value $197,600 $375,500
Median numbers of rooms 5.1 4.5
Median number of rooms in apartments 4 3.5
Median number of rooms in houses and condos 6.2 6.2
Median house price - detached houses $238,319 $585,854
Median house price - in 2-unit structures $407,491 $359,451
Median house price - in 3-to-4-unit structures $120,363 $453,504
Median house price - in 5 or more unit structures $163,867 $356,868
Median house price - mobile homes $105,850 $149,278
Median house price - Townhouses or other attached units $188,542 $383,334
Median house price - All housing units $234,615 $508,525
Median house age 37 34
Renting percentage 43.5% 55.1%
Housing density (houses/condos per square mile) 1,481.2 1,923
House value disparities 33.6% 36.3%
Household income disparities 44.7% 47.8%
Median household income for houses/condes with a mortgage $87,382 $123,344
Median household income for apartments without a mortgage $60,785 $75,939
Housing units without a mortgage 5,815 (3.5%) 1,022 (1.3%)
Housing units with both a second mortgage and home equity loan 6,350 (3.8%) 5,566 (7%)
Housing units with a mortgage 160,674 (96.5%) 78,250 (98.7%)
Housing units with a home equity loan 129 (0.1%) 58 (0.1%)
Housing units with a second mortgage 7,761 (4.7%) 7,203 (9.1%)
House/condo owner moved in on average (years ago) 13 7
House/condo renter moved in on average (years ago) 1 1
Housing units lacking complete kitchen facilities 2.1% 2%
Housing units lacking complete plumbing facilities 1.3% 1.5%
Housing units in structures
Housing units in structures San AntonioAtlanta
One, detached 60.4% 37.5%
One, attached 2.7% 6.6%
Two 2.2% 2.4%
3 or 4 4.9% 3.9%
5 to 9 7.8% 5.9%
10 to 19 8.5% 5.7%
20 to 49 5.4% 6.8%
50 or more 6.6% 30.7%
Mobile homes 1.5% 0.5%
Median real estate property taxes paid for housing units
Type San Antonio Atlanta
With mortgages $4,486 (2%) $3,727 (1%)
With no mortgages $2,691 (1.6%) $2,824 (0.8%)
Marital status
Type San Antonio Atlanta
Divorced 11.6% 10.4%
Never married 37.4% 52.4%
Now married 43.6% 32%
Separated 2.6% 1.6%
Widowed 4.8% 3.6%
Class of workers - percentage
Class of Workers San AntonioAtlanta
Employee of private company 68.4% 64.7%
Local government workers 7.5% 4.5%
Private not-for-profit wage and salary workers 6.9% 10.5%
Self-employed workers in own not incorporated business 6.8% 6.0%
State government workers 4.3% 5.1%
Federal government workers 3.2% 2.7%
Self-employed in own incorporated business 2.7% 6.3%
Unpaid family workers 0.1% 0.2%
Class of workers - absolute values
Class of Workers San AntonioAtlanta
Employee of private company 464,438 170,124
Federal government workers 21,964 7,109
Local government workers 50,959 11,854
Private not-for-profit wage and salary workers 46,650 27,725
Self-employed in own incorporated business 18,647 16,553
Self-employed workers in own not incorporated business 46,328 15,892
State government workers 29,486 13,288
Unpaid family workers 657 550

Industries and Occupations

Tourism, manufacturing, and healthcare are key industries in San Antonio, providing many job opportunities. Atlanta is a significant business hub featuring media, logistics, professional and business services, and information technology.
Most common male industries
Industry San AntonioAtlanta
Construction 16.5% 4.8%
Retail trade 10.3% 8.4%
Accommodation and food services 8.3% 4.2%
Professional, scientific, and technical services 7.9% 22.7%
Transportation and warehousing 7.5% 6.5%
Manufacturing 7.1% 6.1%
Health care and social assistance 6.6% 7.5%
Finance and insurance 6.0% 7.1%
Educational services 6.0% 7.5%
Administrative and support and waste management services 5.5% 5.4%
Other services, except public administration 5.0% 3.2%
Public administration 4.1% 4.9%
Wholesale trade 2.6% 2.8%
Information 1.7% 3.1%
Real estate and rental and leasing 1.4% 4.0%
Arts, entertainment, and recreation 1.4% 1.1%
Mining, quarrying, and oil and gas extraction 0.8% 0.2%
Utilities 0.8% 0.3%
Agriculture, forestry, fishing and hunting 0.5% 0.2%
Most common female industries
Industry San AntonioAtlanta
Health care and social assistance 21.2% 15.0%
Educational services 15.0% 14.6%
Accommodation and food services 11.7% 5.9%
Retail trade 10.0% 6.9%
Finance and insurance 8.1% 5.0%
Administrative and support and waste management services 5.2% 4.1%
Professional, scientific, and technical services 5.2% 14.1%
Other services, except public administration 5.1% 3.9%
Manufacturing 4.3% 6.8%
Public administration 3.8% 5.4%
Transportation and warehousing 2.4% 5.4%
Arts, entertainment, and recreation 1.7% 2.6%
Construction 1.6% 1.2%
Real estate and rental and leasing 1.6% 2.9%
Wholesale trade 1.2% 1.9%
Information 0.8% 3.8%
Management of companies and enterprises 0.3% 0.0%
Agriculture, forestry, fishing and hunting 0.3% 0.1%
Mining, quarrying, and oil and gas extraction 0.2% 0.0%
Utilities 0.2% 0.5%
Most common male occupations
Occupation San AntonioAtlanta
Construction and extraction occupations 13.5% 2.6%
Management occupations 9.3% 16.9%
Sales and related occupations 9.0% 10.8%
Installation, maintenance, and repair occupations 6.6% 1.5%
Office and administrative support occupations 6.5% 4.0%
Food preparation and serving related occupations 6.4% 2.4%
Transportation occupations 6.1% 3.1%
Computer and mathematical occupations 5.5% 7.5%
Material moving occupations 5.4% 4.8%
Production occupations 4.7% 2.0%
Building and grounds cleaning and maintenance occupations 4.3% 3.1%
Business and financial operations occupations 3.6% 10.5%
Educational instruction, and library occupations 3.5% 4.7%
Health diagnosing and treating practitioners and other technical occupations 2.4% 3.6%
Architecture and engineering occupations 2.3% 4.5%
Personal care and service occupations 1.5% 1.1%
Healthcare support occupations 1.4% 0.6%
Community and social service occupations 1.4% 1.3%
Firefighting and prevention, and other protective service workers including supervisors 1.3% 1.7%
Legal occupations 1.2% 4.4%
Most common female occupations
Occupation San AntonioAtlanta
Office and administrative support occupations 18.9% 12.0%
Sales and related occupations 11.0% 7.4%
Management occupations 9.2% 15.8%
Educational instruction, and library occupations 9.2% 8.2%
Food preparation and serving related occupations 8.6% 4.0%
Healthcare support occupations 7.2% 2.2%
Business and financial operations occupations 5.8% 9.5%
Health diagnosing and treating practitioners and other technical occupations 5.1% 5.6%
Building and grounds cleaning and maintenance occupations 4.2% 3.4%
Personal care and service occupations 3.0% 3.3%
Production occupations 2.8% 1.1%
Health technologists and technicians 2.6% 2.3%
Community and social service occupations 2.4% 2.8%
Arts, design, entertainment, sports, and media occupations 2.2% 5.5%
Computer and mathematical occupations 1.5% 2.7%
Material moving occupations 1.4% 1.6%
Life, physical, and social science occupations 0.9% 2.2%
Legal occupations 0.9% 3.3%
Transportation occupations 0.8% 2.3%
Firefighting and prevention, and other protective service workers including supervisors 0.6% 1.6%
Food environment data per 10,000 residents
Food environment statistics San AntonioAtlanta
Number of convenience stores (no gas) 3.1 3.0
Number of convenience stores (with gas) 1.1 0.6
Number of full-service restaurants 6.8 11.1
Number of grocery stores 1.0 1.9
Number of supercenters and club stores 0.1 0.1
Food environment - absolute values
Food environment statistics San AntonioAtlanta
Number of convenience stores (no gas) 487 298
Number of convenience stores (with gas) 181 59
Number of full-service restaurants 1,073 1,102
Number of grocery stores 162 190
Number of supercenters and club stores 19 7
Obesity and diabetes
Food environment statistics rate San AntonioAtlanta
Adult diabetes rate 8.3% 8.6%
Adult obesity rate 26.3% 23.2%
Low-income preschool obesity rate 16.8% 15.1%

Health Care

Both cities offer excellent healthcare facilities. San Antonio is known for its military medical centers, and Atlanta is home to the Centers for Disease Control and Prevention and numerous renowned hospitals.
Health (county statistics)
Type San Antonio Atlanta
General health status score of residents in this county from 1 (poor) to 5 (excellent) 3.4 3.5
Average weight of females (lbs) 162.7 lbs 164.4 lbs
Average weight of males (lbs) 199.1 lbs 196.9 lbs
Residents visited a dentist within the past year 65.4% 66.6%
Residents exercised in the past month 71.2% 72.9%
Adult residents drank alcohol in the past 30 days 53.6% 52.3%
Residents smoked 100+ cigarettes in their lives 37.5% 36.6%

Fatal vehicle accidents per 100,000 residents
Type Total count per 100,000Drunk per 100,000Fatal count per 100,000Pedestrian count per 100,000Person count per 100,000Vehicle count per 100,000
Year San AntonioAtlantaSan AntonioAtlantaSan AntonioAtlantaSan AntonioAtlantaSan AntonioAtlantaSan AntonioAtlanta
2021 12.8 18.7 0.0 0.0 13.8 19.5 5.0 6.4 26.2 41.3 19.8 27.6
2020 10.2 12.6 3.3 1.8 10.9 15.6 4.4 4.6 22.8 32.8 16.5 23.0
2019 9.9 15.8 2.9 2.2 10.0 16.8 4.3 5.5 22.2 37.5 14.9 26.8
2018 9.5 11.8 2.4 2.4 9.7 12.4 3.5 4.6 21.7 23.1 14.9 17.2
2017 9.6 9.6 2.9 0.8 9.8 10.0 3.3 4.5 23.1 32.5 14.6 16.1
2016 12.4 12.9 3.0 2.1 13.4 13.8 5.1 5.2 26.4 26.5 18.9 19.4
2015 9.9 10.9 3.2 2.8 10.6 11.7 3.6 3.4 21.4 24.8 15.0 17.5
2014 9.7 9.6 3.1 2.6 10.5 10.1 4.0 3.9 20.5 18.2 14.1 13.6
2013 10.9 10.7 4.0 2.2 12.0 11.2 4.1 4.9 24.6 25.0 15.8 17.4
2012 9.0 8.3 2.7 2.5 10.0 8.8 3.4 1.8 19.9 20.1 14.4 14.9
2011 8.6 7.4 3.9 1.2 8.9 7.9 2.4 3.0 18.7 16.2 12.6 11.6
2010 8.4 9.0 4.3 2.6 9.2 9.8 2.6 3.6 18.6 18.8 12.7 14.3
2009 8.9 7.9 3.9 2.2 9.3 8.3 2.5 2.4 21.8 20.5 14.3 12.0
2008 8.3 9.9 4.2 1.3 8.8 10.8 1.9 3.7 22.0 25.3 13.5 15.4
2007 7.8 11.2 3.2 3.8 9.0 12.9 1.7 2.9 19.9 38.7 11.9 16.0
2006 9.0 11.8 1.7 3.2 9.6 11.8 2.5 2.2 23.8 29.1 13.7 18.7
2005 10.1 11.6 2.4 3.1 11.3 12.6 3.5 2.1 29.6 37.3 16.8 22.4
2004 11.0 14.3 4.0 6.0 13.2 14.9 3.4 3.8 30.9 36.7 17.1 24.5
2003 9.9 14.0 2.4 3.9 11.0 15.3 2.5 6.1 28.2 39.6 15.4 19.9
2002 11.3 14.4 2.4 5.2 12.3 15.8 2.8 5.0 31.7 42.4 17.6 23.5
2001 7.7 13.9 1.4 4.4 8.6 15.8 2.5 4.9 21.2 44.1 11.8 21.6
2000 10.2 14.6 2.9 6.2 11.7 16.1 3.2 4.8 29.8 45.4 14.6 23.5
1999 9.2 14.7 3.6 3.2 9.8 15.7 3.1 6.0 24.3 41.8 13.4 20.4
1998 10.7 17.9 3.4 4.0 11.5 18.4 3.7 6.5 29.6 50.4 15.8 27.0
1997 10.0 15.0 3.0 4.7 10.5 15.7 3.4 6.5 27.8 42.1 16.4 21.9
1996 10.8 17.5 4.0 5.7 12.2 19.0 2.8 4.7 28.7 48.4 15.8 26.7
1995 10.8 12.2 3.8 4.0 11.7 13.0 3.8 6.2 30.5 34.2 16.3 18.0
1994 9.7 17.4 3.1 4.7 10.7 18.4 3.4 7.7 27.0 48.5 13.6 28.4
1993 10.5 12.3 4.5 2.0 10.9 12.5 2.9 4.8 28.3 32.4 14.7 17.3
1992 8.9 16.4 4.7 4.0 9.5 16.9 2.9 7.3 25.8 38.4 13.6 22.8
1991 9.0 12.5 4.4 4.1 9.4 13.5 2.7 5.6 26.1 37.4 13.9 19.8
1990 8.8 18.5 4.3 5.8 9.1 19.0 0.0 0.0 19.3 46.9 12.0 26.6
1989 13.0 19.4 7.1 6.0 14.1 20.6 0.0 0.0 33.4 45.1 19.8 26.9
1988 12.5 16.5 6.1 5.2 14.1 17.2 0.0 0.0 34.7 42.7 18.1 24.2
1987 13.4 18.8 4.7 4.2 14.1 19.3 0.0 0.0 38.7 45.1 19.5 27.8
1986 16.9 18.9 4.8 5.9 18.0 19.7 0.0 0.0 45.2 45.5 24.4 27.3
1985 15.7 19.3 2.3 4.6 17.3 21.0 0.0 0.0 42.7 43.7 24.0 23.9
1984 17.0 19.1 4.8 8.0 19.0 19.6 0.0 0.0 37.7 45.6 22.1 26.7
1983 14.4 16.1 4.0 3.4 16.2 16.8 0.0 0.0 34.2 49.3 20.1 24.3
1982 16.7 14.8 3.9 3.8 18.4 15.0 0.0 0.0 36.5 32.2 21.8 20.5
1981 17.7 20.4 2.4 7.3 19.2 22.3 0.0 0.0 40.1 49.3 21.6 29.6
1980 18.4 18.1 2.2 4.9 20.1 18.8 0.0 0.0 42.8 46.4 25.1 27.3
1979 15.5 16.2 2.8 2.8 16.7 17.4 0.0 0.0 35.3 37.0 21.4 20.4
1978 15.9 18.0 3.0 4.1 17.0 19.1 0.0 0.0 33.4 41.2 19.4 24.1
1977 18.9 11.7 4.8 3.6 20.2 11.9 0.0 0.0 50.0 30.3 26.7 15.7
1976 12.4 14.6 0.3 1.5 14.2 15.2 0.0 0.0 31.5 37.5 16.5 20.1
1975 12.6 14.3 0.3 1.5 14.4 15.0 0.0 0.0 32.1 37.0 16.8 19.8

Fatal vehicle accidents
Type Total countDrunkFatal countPedestrian countPerson countVehicle count
Year San AntonioAtlantaSan AntonioAtlantaSan AntonioAtlantaSan AntonioAtlantaSan AntonioAtlantaSan AntonioAtlanta
1975 91 66 2 7 104 69 0 0 231 170 121 91
1976 91 66 2 7 104 69 0 0 231 170 121 91
1977 141 52 36 16 151 53 0 0 373 135 199 70
1978 121 79 23 18 129 84 0 0 254 181 147 106
1979 120 70 22 12 129 75 0 0 273 160 165 88
1980 145 77 17 21 158 80 0 0 336 197 197 116
1981 142 86 19 31 154 94 0 0 321 208 173 125
1982 136 62 32 16 150 63 0 0 298 135 178 86
1983 120 67 33 14 135 70 0 0 284 205 167 101
1984 144 79 41 33 161 81 0 0 319 188 187 110
1985 135 79 20 19 149 86 0 0 368 179 207 98
1986 148 77 42 24 158 80 0 0 396 185 214 111
1987 119 76 42 17 126 78 0 0 345 182 174 112
1988 113 66 55 21 128 69 0 0 314 171 164 97
1989 120 77 65 24 130 82 0 0 308 179 182 107
1990 88 73 43 23 91 75 0 0 193 185 120 105
1991 91 49 45 16 95 53 27 22 264 147 141 78
1992 92 65 49 16 98 67 30 29 266 152 140 90
1993 110 49 47 8 115 50 31 19 297 129 154 69
1994 104 70 33 19 115 74 36 31 289 195 146 114
1995 117 49 41 16 127 52 41 25 331 137 177 72
1996 119 70 44 23 134 76 31 19 316 194 174 107
1997 112 60 33 19 117 63 38 26 311 169 184 88
1998 121 72 38 16 130 74 42 26 336 203 179 109
1999 106 59 41 13 112 63 36 24 279 168 154 82
2000 117 61 33 26 134 67 37 20 341 189 167 98
2001 91 60 16 19 101 68 29 21 249 190 139 93
2002 135 64 29 23 148 70 34 22 380 188 211 104
2003 120 64 29 18 134 70 31 28 343 181 188 91
2004 136 67 49 28 163 70 42 18 383 172 212 115
2005 127 56 30 15 142 61 44 10 373 180 211 108
2006 116 59 22 16 124 59 32 11 307 145 177 93
2007 103 58 43 20 119 67 23 15 263 201 158 83
2008 112 53 57 7 119 58 26 20 297 136 182 83
2009 122 43 53 12 128 45 34 13 299 111 196 65
2010 111 38 57 11 122 41 34 15 247 79 168 60
2011 117 32 53 5 121 34 32 13 254 70 172 50
2012 124 37 38 11 138 39 47 8 275 89 199 66
2013 154 48 56 10 169 50 58 22 347 112 222 78
2014 139 44 45 12 151 46 57 18 295 83 203 62
2015 145 51 47 13 155 55 52 16 313 116 219 82
2016 184 62 44 10 199 66 76 25 393 127 282 93
2017 145 47 44 4 148 49 50 22 349 160 221 79
2018 145 59 37 12 149 62 54 23 332 115 228 86
2019 153 80 45 11 155 85 67 28 343 190 230 136
2020 147 63 47 9 157 78 63 23 328 164 237 115
2021 186 93 0 0 200 97 73 32 381 205 288 137
Police full-time law enforcement employees
Year San AntonioAtlanta
2021 2,982 2,095
2020 3,087 2,015
2019 3,362 2,090
2018 2,991 1,987
2017 2,929 2,087
2016 2,819 2,140
2015 2,708 2,218
2014 2,895 2,209
2013 2,889 2,294
2012 2,883 2,165
2011 3,002 2,069
2010 2,949 1,973
2009 2,809 1,881
2008 2,819 1,963
2007 2,773 2,177
2006 2,516 2,182
2005 2,482 2,260
2004 2,479 2,102
2003 2,504 2,049
Police full-time law enforcement employees (per 1,000 residents)
Year San AntonioAtlanta
2021 1.9 4.0
2020 2.0 3.9
2019 2.2 4.1
2018 1.9 4.0
2017 1.9 4.3
2016 1.9 4.5
2015 1.9 4.8
2014 2.0 4.9
2013 2.1 5.1
2012 2.1 5.0
2011 2.2 4.9
2010 2.2 4.7
2009 2.0 3.4
2008 2.1 3.7
2007 2.1 4.4
2006 1.9 4.5
2005 2.0 5.2
2004 2.0 4.9
2003 2.1 4.8
Local government: full-time employees
Job San AntonioAtlanta
Airports 407 621
Financial administration 597 262
Firefighters 1,791 886
Fire - other 110 130
Gas supply 313 0
Health 486 0
Judicial and legal 205 341
Local libraries 313 0
Natural resources 111 0
Other and unallocable 697 145
Other government administration 297 511
Parks and recreation 1,079 432
Police - other 636 652
Police protection - officers 2,549 1,487
Sewerage 470 1,024
Solid waste management 672 489
Streets and highways 587 288
Totals for government 16,101 7,890
Water supply 1,352 206
Welfare 337 39
Local government: part-time employees
Job San AntonioAtlanta
Airports 4 0
Health 14 0
Judicial and legal 8 3
Local libraries 199 0
Other and unallocable 10 9
Other government administration 6 52
Parks and recreation 39 11
Police - other 233 11
Sewerage 1 0
Solid waste management 0 10
Streets and highways 0 2
Totals for government 565 103
Water supply 22 0
Welfare 22 0
Place of birth - Foreign born
Residents San AntonioAtlanta
All residents 14.6% 8.4%
American Indian / Alaska Native residents 31.2% 22.4%
Asian residents 68.6% 50.5%
Black or African American residents 7.0% 2.2%
Native Hawaiian / Pacific Islander residents 8.7% 24.1%
Other race residents 21.1% 35.2%
Two or more races residents 15.8% 16.4%
White residents 5.8% 5.3%
White alone, not Hispanic / Latino residents 4.9% 5.4%
Place of birth - Native, outside of US
Residents San AntonioAtlanta
All residents 2.6% 1.4%
American Indian / Alaska Native residents 0.5% 0.0%
Asian residents 1.7% 2.5%
Black or African American residents 1.9% 0.4%
Native Hawaiian / Pacific Islander residents 46.0% 22.5%
Other race residents 3.2% 2.2%
Two or more races residents 2.8% 7.2%
White residents 2.3% 1.4%
White alone, not Hispanic / Latino residents 2.2% 1.6%
Place of birth - Born in state of residence
Residents San AntonioAtlanta
All residents 65.4% 46.6%
American Indian / Alaska Native residents 58.0% 21.4%
Asian residents 20.6% 16.0%
Black or African American residents 56.6% 59.9%
Native Hawaiian / Pacific Islander residents 18.3% 14.2%
Other race residents 66.3% 28.0%
Two or more races residents 70.4% 36.8%
White residents 64.8% 39.2%
White alone, not Hispanic / Latino residents 50.0% 37.9%
Place of birth - Born in other state
Residents San AntonioAtlanta
All residents 17.4% 43.5%
American Indian / Alaska Native residents 10.3% 56.1%
Asian residents 9.1% 31.0%
Black or African American residents 34.4% 37.5%
Native Hawaiian / Pacific Islander residents 27.1% 39.3%
Other race residents 9.4% 34.6%
Two or more races residents 11.0% 39.6%
White residents 27.2% 54.1%
White alone, not Hispanic / Latino residents 42.8% 55.1%
English speakers (speaking English at home)
Type San Antonio Atlanta
Born in the United States residents 82.3% 94.1%
Foreign born residents 10.3% 32.6%
Native, born elsewhere residents 49.8% 72.6%
Total residents 58.3% 89.3%
Mechanisms of homicide
Mechanism San AntonioAtlanta
Homicides from 2000 to 2006 787 941
Cut / Pierce 113 83
Firearm 458 678
Suffocation 38 25
Mechanisms of homicide per 1,000,000 residents
Mechanism San AntonioAtlanta
Homicides from 2000 to 2006 76.7 151.5
Cut / Pierce 11.0 13.4
Firearm 44.6 109.2
Suffocation 3.7 4.0
Mechanisms of suicide per 1,000,000 residents
Mechanism San AntonioAtlanta
Suicides from 2000 to 2006 100.2 85.8
Fall 0 3.4
Firearm 51.5 44.0
Poisoning 18.6 14.5
Suffocation 22.5 18.5

Infrastructure

San Antonio has been developing its infrastructure, particularly in transit and downtown revitalization. Atlanta, known for housing one of the world's busiest airports, has well-established infrastructure, which includes impressive roads, bridges, and mass transit systems.
Infrastructure
Type San Antonio Atlanta
Hospitals 130 46
TV stations 30 22
Arenas or stadiums 2 6
Bank branches located here 333 235
Bank institutions located here 41 41
Main business address for public companies 23 85
Drinking water stations with no reported violations in the past 7 5
Drinking water stations with reported violations in the past 32 24

Schools

School facilities
Type San Antonio Atlanta
Private elementary/middle schools 43 38
Private high schools 28 27
Public elementary/middle schools 367 110
Public high schools 110 39
Colleges/Universities 49 40
HMDA - Conventional home purchase loans - Applications denied
Year San AntonioAtlanta
1999 6,847 1,775
2000 2,930 1,902
2001 2,383 1,552
2002 2,313 1,683
2003 3,759 3,212
2004 5,180 4,962
2005 6,554 9,078
2006 6,983 10,866
2007 4,562 6,626
2008 1,781 2,140
2009 847 731

Culture and Food

San Antonio offers a blend of Mexican and Texan cultures, reflected in its food. The city is famous for its River Walk, filled with restaurants and shops. Atlanta is known for its southern hospitality and cuisine, with popular dishes like peach cobbler and fried chicken.

Sports Teams

Sports lovers will find plenty to cheer in both cities. San Antonio is home to the NBA's San Antonio Spurs, while Atlanta hosts the NBA's Hawks, the NFL's Falcons, and MLB's Braves.