Living in San Antonio, Texas provides a different experience than residing in Anchorage, Alaska. Both cities have unique attributes that can be appealing for both locals and tourists. San Antonio provides warmer weather, a vibrant food scene, and a lower cost of living, while Anchorage boasts stunning natural scenery, a thriving fishing industry, and days that can have 24 hours of daylight. Comparatively, San Antonio offers a stronger economic base with notable health-care and tourism sectors, while Anchorage presents more considerable opportunities in oil, fishing, and logistics.
Distance between
San Antonio, TX and
Anchorage, AK : 3,184.6 miles
San Antonio's population is larger by 404%. Its population has grown by 307,207 people (26.8%) since 2000. The population of Anchorage has grown by 27,838 people (10.7%) during that time.
Both San Antonio and Anchorage have crime rates higher than the national average, with Anchorage having a significantly higher property crime rate. However, it's crucial to keep in mind that crime varies greatly by neighborhood in both cities. Visitors and potential residents should thoroughly research areas of interest to consider local crime rates.
City-data.com crime index counts serious crimes and violent crime more heavily. It adjusts for the number of visitors and daily workers commuting into cities. (higher means more crime, U.S. average = 301.1)
City-data.com crime index counts serious crimes and violent crime more heavily. It adjusts for the number of visitors and daily workers commuting into cities. (higher means more crime, U.S. average = 301.1)
Sex Offenders
According to our data, there are 3,802 registered sex offenders living in San Antonio and 1,368 registered sex offenders living in . The ratio of residents to sex offenders in San Antonio is 393 to 1; the ratio in Anchorage is 218 to 1. The number of registered sex offenders compared to the number of residents is a smaller in San Antonio than in Anchorage.
Cost of Living
Living in San Antonio is less expensive than in Anchorage. The overall cost of living in Anchorage is significantly higher than the U.S. average, due in part to transportation costs and the cost of goods in Alaska. Housing, groceries, and healthcare are also more expensive in Anchorage compared to San Antonio.
Income Tax
Texas, and therefore San Antonio, does not have a state income tax. Therefore, residents keep more of their income compared to other states. Unlike most states, Alaska and therefore Anchorage, has no state sales or income tax.
Property Tax
Property taxes vary greatly depending on locale within both cities. Both Alaska and Texas do not have state property taxes, but local property taxes are applied and can vary. Remember to check local property tax rates in the specific area of both cities that you are looking into.
Sales Tax
San Antonio, being in Texas, has no state income tax, but a state sales tax of 6.25% is imposed, with local municipalities having the option to add up to 2%, resulting in a maximum sales tax of 8.25%. In comparison, Alaska is one of five states with no statewide sales tax. However, local jurisdictions in Anchorage impose a sales tax up to 7%.
Income
Type
San Antonio
Anchorage
Estimated median household income
$54,923
$86,654
Estimated per capita income
$28,860
$43,165
Cost of living index (U.S. average is 100)
87.7
103.3
If you make $50,000 in San Antonio, you will have to make $58,894 in Anchorage to maintain the same standard of living.
Geographical Conditions
San Antonio is located on the south of Texas and experiences mild winters, hot summers and the occasional heavy rainstorm. Anchorage, by contrast, is located in south-central Alaska, surrounded by wilderness and mountains, and offers stunning natural landscapes, and faces lengthy, dark, and cold winters.
San Antonio is home to well-regarded schools and universities, providing opportunities for education at all levels. Anchorage, although smaller, also offers quality education via the Anchorage School District and the University of Alaska Anchorage (the largest in the state). Differentiating factor is the diversity of the educational institutions available in San Antonio.
San Antonio's economy revolves heavily around military, healthcare, government services, financial services, oil and gas, and tourism. On the other hand, Anchorage's economy is primarily based on transportation, military, municipal, state and federal government, tourism, corporate headquarters (including regional headquarters for multinational corporations), and resource extraction. The oil and gas industry plays a significant role in Anchorage's economy.
Biggest Employers
San Antonio's biggest employers include the military, USAA, Tesoro, and various healthcare providers. Meanwhile in Anchorage, the largest employers include Providence Health System, Carrs/Safeway, and Walmart.
Breakdown of population affiliated with a religious congregation
Type
Adherents
Congregations
Religion
San Antonio
Anchorage
San Antonio
Anchorage
CATHOLIC CHURCH
30.8%
7.9%
8.6%
3.7%
SOUTHERN BAPTIST CONVENTION
6.8%
3.1%
23.5%
10.1%
MUSLIM ESTIMATE
1.2%
0.3%
0.8%
0.9%
LUTHERAN CHURCH
0.7%
0.4%
1.0%
1.2%
EPISCOPAL CHURCH
0.6%
0.6%
1.6%
1.5%
EVANGELICAL LUTHERAN CHURCH IN AMERICA
0.6%
1.1%
2.2%
2.8%
AMERICAN BAPTIST CHURCHES IN THE USA
0.2%
0.5%
0.3%
1.2%
SEVENTH DAY ADVENTIST CHURCH
0.2%
0.6%
1.3%
2.8%
Weather
The climate contrasts greatly between the two cities. Anchorage features a subarctic climate with cold, snowy winters and cool, brief summers. In contrast, San Antonio offers a humid subtropical climate with hot summers and mild winters, making it favorable for individuals that prefer warmer climates.
Weather and climate
Type
San Antonio
Anchorage
Temperature - Average
68.7°F
34.3°F
Humidity - Average morning or afternoon humidity
74.9%
75%
Humidity - Differences between morning and afternoon humidity
37%
31%
Humidity - Maximum monthly morning or afternoon humidity
87%
81%
Humidity - Minimum monthly morning or afternoon humidity
50%
50%
Precipitation - Yearly average
32.2 in
20.1 in
Snowfall - Yearly average
1.2 in
146.5 in
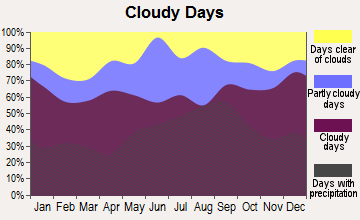
Clouds - Number of days clear of clouds
17.5%
10.2%
Sunshine amount - Average
62.4%
46.8%
Sunshine amount - Differences during a year
24%
18%
Sunshine amount - Maximum monthly
72%
51%
Sunshine amount - Minimum monthly
48%
33%
Wind speed - Average
8.9 mph
7.5 mph
Average climate in San Antonio, Texas
Average climate in Anchorage, Alaska
Air pollution
Type
AQI
CO
NO2
OZONE
PM10
PM25
SO2
Year
San Antonio
Anchorage
San Antonio
Anchorage
San Antonio
San Antonio
Anchorage
San Antonio
Anchorage
San Antonio
Anchorage
San Antonio
2018
83
54
N/A
0.50
4.9
N/A
25.6
N/A
N/A
12.5
8.0
5.4
0.2
N/A
2017
85
62
N/A
N/A
5.1
N/A
26.9
N/A
N/A
13.0
8.4
5.1
1.7
N/A
2016
79
63
N/A
0.67
5.2
N/A
25.7
N/A
N/A
19.0
8.2
5.8
0.8
N/A
2015
76
61
N/A
N/A
4.7
N/A
25.4
N/A
N/A
16.8
9.2
6.3
0.7
N/A
2014
84
66
N/A
N/A
5.5
N/A
27.3
N/A
N/A
21.9
9.5
5.9
0.6
N/A
2013
79
58
N/A
N/A
4.1
N/A
28.2
N/A
N/A
15.7
9.0
5.2
0.7
N/A
2012
77
61
N/A
N/A
4.5
N/A
27.5
16.8
18.1
16.5
9.2
5.7
N/A
N/A
2011
85
55
N/A
N/A
4.6
N/A
29.2
17.3
18.9
13.4
9.9
4.7
N/A
N/A
2010
75
65
0.21
N/A
7.2
N/A
25.8
17.7
17.1
15.7
9.2
5.6
N/A
N/A
2009
74
74
0.23
N/A
8.3
N/A
25.7
N/A
19.5
17.1
9.8
6.4
0.4
N/A
2008
84
N/A
0.26
N/A
9.3
N/A
26.8
N/A
19.8
N/A
10.1
N/A
0.5
N/A
2007
83
N/A
0.49
N/A
9.3
N/A
26.3
N/A
23.4
N/A
10.3
N/A
N/A
N/A
2006
86
N/A
0.51
N/A
9.7
N/A
32.7
N/A
24.8
N/A
9.8
N/A
N/A
N/A
2005
86
N/A
0.53
N/A
10.7
N/A
30.8
N/A
22.3
N/A
10.1
N/A
N/A
N/A
2004
76
N/A
0.48
N/A
10.4
N/A
29.6
N/A
22.4
N/A
N/A
N/A
N/A
N/A
2003
77
N/A
0.57
N/A
10.3
N/A
28.5
N/A
26.7
N/A
N/A
N/A
N/A
N/A
2002
88
N/A
0.52
N/A
11.2
N/A
30.3
N/A
N/A
N/A
N/A
N/A
N/A
N/A
2001
78
N/A
0.57
N/A
11.9
N/A
29.3
N/A
N/A
N/A
N/A
N/A
N/A
N/A
2000
82
N/A
0.52
N/A
11.7
N/A
29.6
N/A
N/A
N/A
N/A
N/A
N/A
N/A
Natural disasters
Type
San Antonio
Anchorage
Tornado activity compared to U.S. average
91.5%
0%
Earthquake activity compared to U.S. average
73.7%
8,330.9%
Natural disasters compared to U.S. average
21%
0%
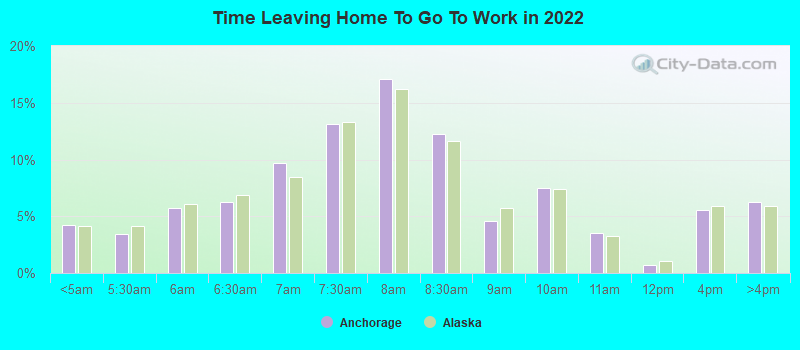
Transportation
In terms of transportation and commuting, San Antonio offers its residents the VIA Metropolitan Transit, whereas Anchorage provides the People Mover bus system. However, both cities are compiled for car travel with public transit being less convenient than in more densely populated cities.
Transport
Type
San Antonio
Anchorage
Amtrak stations
1
0
Amtrak stations nearby
1
0
FAA registered aircraft
987
2
FAA registered aircraft manufacturers and dealers
29
36
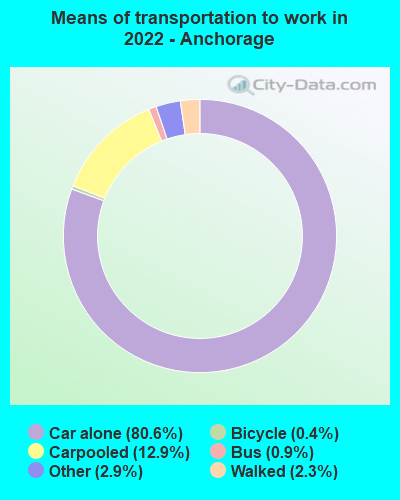
Means of transportation to work
Type
San Antonio
Anchorage
Bicycle
0.2%
0.9%
Bus
1.6%
1.1%
Carpooled
12.9%
11.7%
Car alone
81.9%
80.2%
Ferryboat
0%
0.3%
Motorcycle
0.1%
0%
Taxicab
0.1%
0.2%
Walked
1.6%
3%
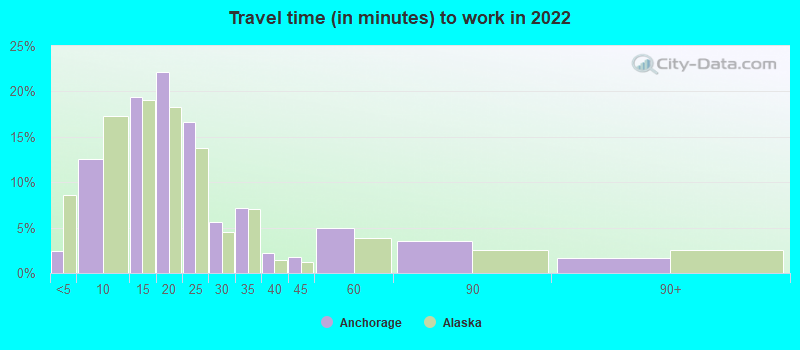
Average travel time to work
Type
San Antonio
Anchorage
Average
27 min
23.4 min
Other means
23.4 min
20.1 min
Public transportation
43.5 min
33.1 min
Private vehicle occupancy
Type
San Antonio
Anchorage
Average
1.2
1.2
Drove alone
84.6%
86.8%
In 2 person carpool
10.4%
9.8%
In 3 person carpool
3.3%
2.1%
In 4 person carpool
1%
0.9%
In 5-6 person carpool
0.6%
0.3%
How many people usually rode to work in the car, truck or van.
Real Estate
Generally, real estate is more expensive in Anchorage compared to San Antonio in terms of home sale prices and rental rates. San Antonio has a vibrant real estate market with varied options for every budget, while the Anchorage market is less diverse due to factors like remoteness and construction costs.
Neighborhoods
Both cities offer diverse neighborhoods with unique character. San Antonio neighborhoods range from historic districts rich in culture to upscale suburban communities, while Anchorage presents a mix of downtown living, suburban communities, and even rural environments just a short drive away.
Houses and residents
Type
San Antonio
Anchorage
Houses
603,670
119,808
Average household size (people)
2.7
2.6
Median year apartment built
1987
1983
Median year house/condo built
1981
1982
Length of stay in the house since moving in
14.3 years
12 years
Houses occupied
549,245 (91%)
109,584 (91.5%)
Houses occupied by owners
290,123 (52.8%)
69,699 (63.6%)
Houses occupied by renters
259,122 (47.2%)
39,885 (36.4%)
Median rent asked for vacant for-rent units
$1,143
$1,103
Median monthly housing costs
$1,101
$1,549
Median price asked for vacant for-sale houses and condos
$189,213
$230,450
Estimated median house or condo value
$197,600
$346,200
Median numbers of rooms
5.1
5.4
Median number of rooms in apartments
4
4.2
Median number of rooms in houses and condos
6.2
6.1
Median house price - detached houses
$238,319
$393,032
Median house price - in 2-unit structures
$407,491
$287,804
Median house price - in 3-to-4-unit structures
$120,363
$337,130
Median house price - in 5 or more unit structures
$163,867
$185,328
Median house price - mobile homes
$105,850
$127,974
Median house price - Townhouses or other attached units
$188,542
$267,390
Median house price - All housing units
$234,615
$350,756
Median house age
37
39
Renting percentage
43.5%
40.1%
Housing density (houses/condos per square mile)
1,481.2
70.6
House value disparities
33.6%
27.3%
Household income disparities
44.7%
41.6%
Median household income for houses/condes with a mortgage
$87,382
$121,329
Median household income for apartments without a mortgage
$60,785
$99,660
Housing units without a mortgage
5,815 (3.5%)
959 (1.9%)
Housing units with both a second mortgage and home equity loan
6,350 (3.8%)
1,726 (3.4%)
Housing units with a mortgage
160,674 (96.5%)
49,621 (98.1%)
Housing units with a home equity loan
129 (0.1%)
0 (0%)
Housing units with a second mortgage
7,761 (4.7%)
2,395 (4.7%)
House/condo owner moved in on average (years ago)
13
10
House/condo renter moved in on average (years ago)
1
1
Housing units lacking complete kitchen facilities
2.1%
1.2%
Housing units lacking complete plumbing facilities
1.3%
1.1%
Housing units in structures
Housing units in structures
San Antonio
Anchorage
One, detached
60.4%
46.6%
One, attached
2.7%
15.2%
Two
2.2%
4.6%
3 or 4
4.9%
10.5%
5 to 9
7.8%
6.0%
10 to 19
8.5%
4.3%
20 to 49
5.4%
6.1%
50 or more
6.6%
2.8%
Mobile homes
1.5%
3.7%
Boats, RVs, vans, etc.
0.0%
0.1%
Median real estate property taxes paid for housing units
Self-employed workers in own not incorporated business
46,328
6,643
State government workers
29,486
12,266
Unpaid family workers
657
500
Industries and Occupations
San Antonio's key industries include healthcare, tourism, and military. Majority of jobs revolve around these industries. In contrast, Anchorage's primary industries are oil and gas, transportation, and tourism. Several large oil companies have regional headquarters in Anchorage, serving as a massive employment hub.
San Antonio features prominent healthcare organizations, offering excellent care, including the San Antonio Military Medical Center, the only military hospital in America that services all active-duty service members. In Anchorage, health care services are provided by a mix of hospitals, including the Alaska Native Medical Center, which provides medical services primarily to Alaska Native and American Indian people.
Health (county statistics)
Type
San Antonio
Anchorage
General health status score of residents in this county from 1 (poor) to 5 (excellent)
San Antonio has a robust infrastructure with multiple highways, diverse housing options, airports, and all the amenities you'd expect in a large metro area. Anchorage, while smaller, has a solid infrastructure based on its geographical and climate demands, with a significant emphasis on maintaining a reliable road network crucial for trade and logistics.
Infrastructure
Type
San Antonio
Anchorage
Hospitals
130
7
TV stations
30
27
Arenas or stadiums
2
1
Bank branches located here
333
29
Bank institutions located here
41
4
Main business address for public companies
23
6
Drinking water stations with no reported violations in the past
7
51
Drinking water stations with reported violations in the past
HMDA - Conventional home purchase loans - Applications denied
Year
San Antonio
Anchorage
1999
6,847
436
2000
2,930
282
2001
2,383
239
2002
2,313
322
2003
3,759
393
2004
5,180
638
2005
6,554
1,011
2006
6,983
1,008
2007
4,562
648
2008
1,781
286
2009
847
293
Culture and Food
San Antonio is known for its vibrant culture, largely influenced by Hispanic traditions. The city is famous for its River Walk, historic Alamo, and lively food scene, especially Tex-Mex cuisine. Anchorage, on the other hand, offers unique cultural experiences grounded in its rich Native Alaska heritage, and offers culinary delights like fresh seafood, especially salmon and halibut.
Sports Teams
When it comes to sports, San Antonio is home to the San Antonio Spurs, a highly successful NBA team. For Anchorage, the sports scene focuses more on outdoor activities, like fishing, skiing, and dog mushing, especially the world-famous Iditarod sled dog race.


 San Antonio, TX
 Anchorage, AK