Sacramento, the capital of California, contrasts significantly from Santa Rosa, situated in the state's wine country. Both cities offer a unique blend of opportunities and amenities, appealing to different demographics and lifestyles. In general, Sacramento is more urban and historically diverse, while Santa Rosa presents a more relaxed environment centered around wine industry and a natural setting. Surrounded by valleys, rivers, and scenic paths, both cities attract tourists and locals alike.
Distance between
Sacramento, CA and
Santa Rosa, CA : 67.2 miles
Sacramento's population is larger by 197%. Its population has grown by 118,023 people (29.0%) since 2000. The population of Santa Rosa has grown by 29,343 people (19.9%) during that time.
Sacramento's crime rate is higher than the national average, with property crimes being the most common. However, neighborhoods such as East Sacramento and Land Park are considered safe, and the city is making significant efforts in public safety. Conversely, Santa Rosa has a lower crime rate than Sacramento, as well as a more prominent sense of safety in most neighborhoods.
City-data.com crime index counts serious crimes and violent crime more heavily. It adjusts for the number of visitors and daily workers commuting into cities. (higher means more crime, U.S. average = 301.1)
City-data.com crime index counts serious crimes and violent crime more heavily. It adjusts for the number of visitors and daily workers commuting into cities. (higher means more crime, U.S. average = 301.1)
Sex Offenders
According to our data, there are 2,246 registered sex offenders living in Sacramento and 308 registered sex offenders living in . The ratio of residents to sex offenders in Sacramento is 220 to 1; the ratio in Santa Rosa is 569 to 1. The number of registered sex offenders compared to the number of residents is much larger in Sacramento than that in Santa Rosa.
Cost of Living
Living in Sacramento is more affordable relative to Santa Rosa. Sacramento's lower housing costs significantly contribute to its overall lower cost of living. However, both cities' cost of living is still higher than the national average due to their location within California.
Income Tax
Both cities fall under California’s state income tax, which is progressive and ranges between 1% to 13.3% based on income level.
Property Tax
Both cities also fall under California's state property tax, which averages around 0.73%, lower than the national average. However, actual rates may differ by city and county.
Sales Tax
Sacramento has a city sales tax rate of 8.75%, while Santa Rosa's is higher at 9.25%. Both are higher than the national average due to California's overall high tax rates.
Income
Type
Sacramento
Santa Rosa
Estimated median household income
$75,311
$86,459
Estimated per capita income
$37,916
$43,653
Cost of living index (U.S. average is 100)
102.9
117.7
If you make $50,000 in Sacramento, you will have to make $57,191 in Santa Rosa to maintain the same standard of living.
Geographical Conditions
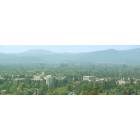
Sacramento is located in the Central Valley, near the Sacramento River. It's flat and surrounded by farmland. On the other hand, Santa Rosa is situated in the heart of wine country with a more hilly geography, providing beautiful scenic views.
Both cities value education, providing excellent public and private schools. Sacramento, being larger, offers a broader range of educational opportunities, from primary-level to higher education institutes. Santa Rosa provides quality education as well, and is home to the renowned Santa Rosa Junior College.
Sacramento's economy revolves around government, health care, and education sectors. In contrast, Santa Rosa's economy is fueled by healthcare, retail, and the wine industry, due to its location in the internationally renowned Sonoma County.
Biggest Employers
In Sacramento, the largest employers are the State of California, Sacramento County, and U.C. Davis Health System. In Santa Rosa, the largest employers include Kaiser Permanente, Sutter Santa Rosa Regional Hospital, and St. Joseph Health.
There were 1,004 building permits issued in Sacramento in 2012 (943 more than in 2011) compared to 420 building permits issued in Santa Rosa in 2012 (235 more than in 2011).
In Sacramento (Sacramento County), 58.1% voted for Democrats and 39.1% for Republicans in 2012 Presidential Election. In Santa Rosa (Sonoma County), 71.0% voted for Democrats and 25.3% for Republicans.
Elections
Type
Democrats
Republicans
Other
Year
Sacramento
Santa Rosa
Sacramento
Santa Rosa
Sacramento
Santa Rosa
2020
61.4%
74.5%
36.1%
23.0%
2.5%
2.4%
2016
58.0%
68.9%
33.8%
22.1%
8.3%
9.0%
2012
58.1%
71.0%
39.1%
25.3%
2.8%
3.7%
2008
58.4%
73.7%
39.4%
24.1%
2.2%
2.2%
2004
49.8%
67.2%
49.6%
30.9%
0.6%
1.9%
2000
49.4%
59.7%
45.4%
32.3%
5.2%
8.0%
1996
49.8%
55.6%
40.8%
29.5%
9.4%
14.9%
Breakdown of population affiliated with a religious congregation
Type
Adherents
Congregations
Religion
Sacramento
Santa Rosa
Sacramento
Santa Rosa
CATHOLIC CHURCH
16.2%
22.3%
5.1%
7.3%
SOUTHERN BAPTIST CONVENTION
1.7%
1.0%
8.6%
6.0%
MUSLIM ESTIMATE
0.9%
0.5%
1.3%
0.6%
NORTH AMERICAN BAPTIST CONFERENCE
0.6%
0.0%
2.2%
0.0%
SEVENTH DAY ADVENTIST CHURCH
0.6%
0.5%
2.1%
3.2%
EVANGELICAL LUTHERAN CHURCH IN AMERICA
0.5%
0.5%
1.8%
1.6%
AMERICAN BAPTIST CHURCHES IN THE USA
0.4%
0.0%
1.7%
0.3%
EPISCOPAL CHURCH
0.3%
0.4%
1.4%
2.5%
LUTHERAN CHURCH
0.2%
0.5%
1.1%
2.5%
Weather
Both cities experience a Mediterranean-like climate. Sacramento boasts more hot, dry summers and mild winters, whereas Santa Rosa is cooler and more temperate, with wet winters. For individuals who prefer more sunshine and hotter weather, Sacramento would be more attractive.
Weather and climate
Type
Sacramento
Santa Rosa
Temperature - Average
62.2°F
59°F
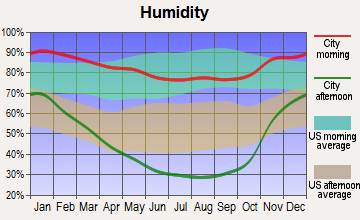
Humidity - Average morning or afternoon humidity
66.8%
76.8%
Humidity - Differences between morning and afternoon humidity
58%
37.8%
Humidity - Maximum monthly morning or afternoon humidity
87%
87.1%
Humidity - Minimum monthly morning or afternoon humidity
29%
49.3%
Precipitation - Yearly average
19 in
31.5 in
Snowfall - Yearly average
0 in
0 in
Clouds - Number of days clear of clouds
31.5%
29.6%
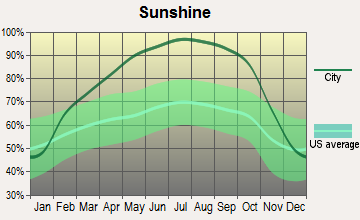
Sunshine amount - Average
83.6%
76.8%
Sunshine amount - Differences during a year
52%
29%
Sunshine amount - Maximum monthly
97%
81.1%
Sunshine amount - Minimum monthly
45%
52.1%
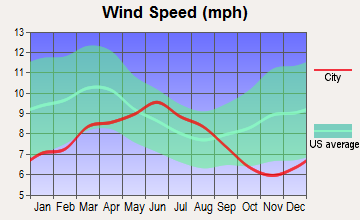
Wind speed - Average
6.8 mph
9.7 mph
Average climate in Sacramento, California
Average climate in Santa Rosa, California
Air pollution
Type
AQI
CO
NO2
OZONE
PB
PM10
PM25
SO2
Year
Sacramento
Santa Rosa
Sacramento
Santa Rosa
Sacramento
Santa Rosa
Sacramento
Santa Rosa
Sacramento
Sacramento
Santa Rosa
Sacramento
Santa Rosa
Sacramento
2018
121
76
0.32
0.37
9.7
4.5
24.7
20.3
0.002
N/A
28.9
16.9
12.7
8.6
N/A
N/A
2017
117
94
0.33
0.41
9.0
5.0
25.2
20.9
0.002
N/A
22.1
15.6
8.8
8.5
N/A
N/A
2016
103
63
0.44
0.36
8.0
4.6
25.3
20.0
0.002
N/A
14.0
13.2
9.0
5.2
N/A
N/A
2015
105
78
0.25
0.39
9.7
5.2
24.9
19.7
0.002
N/A
16.2
15.2
10.9
7.0
N/A
N/A
2014
99
70
0.24
0.35
10.2
4.9
24.9
20.1
0.002
N/A
15.6
13.4
9.6
8.2
N/A
N/A
2013
102
76
0.29
0.45
11.1
9.1
23.2
18.2
0.002
N/A
21.3
N/A
11.9
8.9
N/A
N/A
2012
107
66
0.31
0.42
10.5
8.5
25.2
18.2
0.002
N/A
15.2
N/A
7.9
8.4
N/A
N/A
2011
106
74
0.29
0.43
11.2
9.1
24.0
18.0
0.002
N/A
17.7
N/A
10.8
8.6
N/A
N/A
2010
109
79
0.29
0.34
11.2
8.2
22.8
18.5
N/A
N/A
16.9
N/A
9.3
7.2
0.5
N/A
2009
118
75
0.40
0.36
12.4
9.2
23.3
19.2
0.003
N/A
20.6
N/A
11.4
9.1
0.5
N/A
2008
130
91
0.40
0.33
14.9
10.5
25.4
21.0
N/A
N/A
24.3
N/A
13.6
13.6
0.5
N/A
2007
129
81
0.39
0.36
14.8
10.6
23.7
19.2
0.005
N/A
19.9
N/A
13.5
13.3
0.6
N/A
2006
124
54
0.49
0.41
15.4
11.4
22.7
19.6
N/A
N/A
23.7
N/A
13.0
N/A
0.5
N/A
2005
125
47
0.42
0.42
15.9
11.2
20.0
18.5
N/A
N/A
22.1
N/A
13.5
N/A
0.6
N/A
2004
119
51
0.49
0.40
15.8
10.9
19.1
17.2
N/A
N/A
22.7
N/A
13.3
N/A
0.6
N/A
2003
119
61
0.47
0.46
16.8
12.4
20.3
18.5
N/A
N/A
23.1
N/A
N/A
N/A
0.9
N/A
2002
114
58
0.50
0.52
18.1
13.1
21.2
19.3
0.004
N/A
25.1
N/A
N/A
N/A
1.5
N/A
2001
111
54
0.43
0.55
18.0
13.3
21.2
19.4
0.004
N/A
20.7
N/A
N/A
N/A
1.4
N/A
2000
107
47
0.55
0.64
17.9
13.0
19.5
17.3
0.004
N/A
19.1
N/A
N/A
N/A
1.4
N/A
Natural disasters
Type
Sacramento
Santa Rosa
Tornado activity compared to U.S. average
8.8%
7.3%
Earthquake activity compared to U.S. average
7,798.9%
7,493%
Natural disasters compared to U.S. average
18%
23%
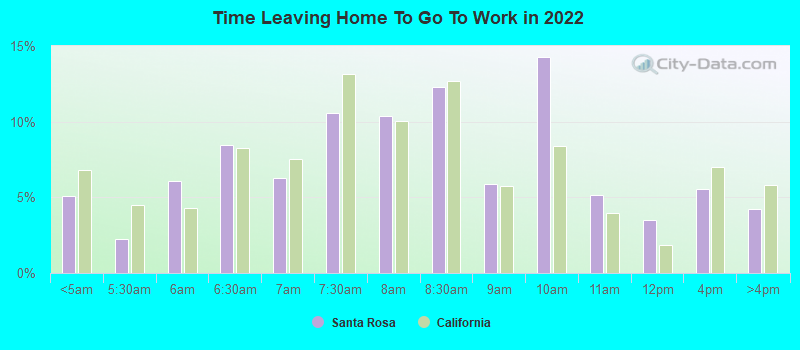
Transportation
Sacramento offers a comprehensive public transit system, including light rail and bus services. It also has extensive bike lanes and pedestrian-friendly areas. Santa Rosa's public transit is more limited, though the city is served by several bus routes, and also offers good biking and walking conditions.
Transport
Type
Sacramento
Santa Rosa
Amtrak stations
1
1
Amtrak stations nearby
3
3
FAA registered aircraft
414
298
FAA registered aircraft manufacturers and dealers
20
10
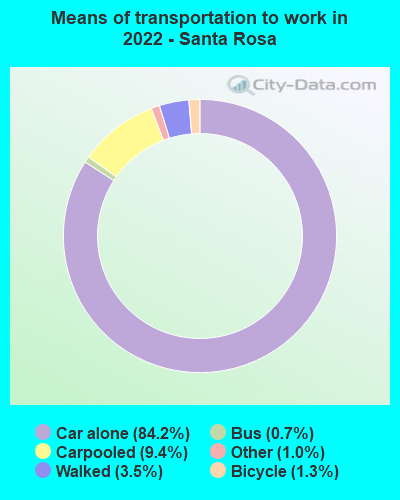
Means of transportation to work
Type
Sacramento
Santa Rosa
Bicycle
1.1%
1.6%
Bus
1%
0.9%
Carpooled
12%
9.7%
Car alone
80%
82.2%
Motorcycle
0.2%
0.2%
Railroad
0.4%
0.1%
Taxicab
0.1%
0.1%
Walked
2.8%
3.6%
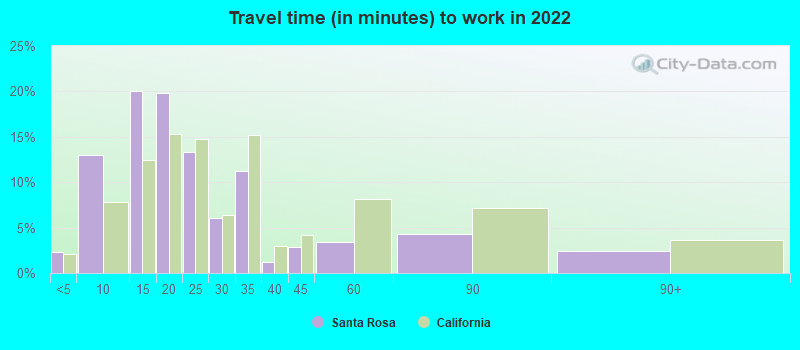
Average travel time to work
Type
Sacramento
Santa Rosa
Average
28.5 min
25.2 min
Other means
22.8 min
23.5 min
Public transportation
39 min
51.5 min
Private vehicle occupancy
Type
Sacramento
Santa Rosa
Average
1.2
1.2
Drove alone
88.5%
87.8%
In 2 person carpool
9.4%
8.3%
In 3 person carpool
1.2%
2.9%
In 4 person carpool
0.4%
0.7%
In 5-6 person carpool
0.5%
0.2%
In 7+ person carpool
0%
0.1%
How many people usually rode to work in the car, truck or van.
Real Estate
Sacramento's real estate market is typically more accessible than Santa Rosa's, with lower average home prices. However, both cities have seen an uptick in housing costs due to increased demand in recent years.
Neighborhoods
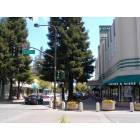
Sacramento’s neighborhoods are highly diverse, from bustling downtown spots to serene suburbs. Santa Rosa also offers a variety of neighborhoods, including historic districts and more rural options that are perfect for nature-lovers.
Houses and residents
Type
Sacramento
Santa Rosa
Houses
210,715
71,553
Average household size (people)
2.6
2.6
Median year apartment built
1977
1981
Median year house/condo built
1978
1980
Length of stay in the house since moving in
12.8 years
13.7 years
Houses occupied
202,093 (95.9%)
68,686 (96%)
Houses occupied by owners
103,994 (51.5%)
37,315 (54.3%)
Houses occupied by renters
98,099 (48.5%)
31,371 (45.7%)
Median rent asked for vacant for-rent units
$976.09
$3,255
Median monthly housing costs
$1,558
$1,973
Median price asked for vacant for-sale houses and condos
$398,191
$446,783
Estimated median house or condo value
$449,600
$638,500
Median numbers of rooms
5
5
Median number of rooms in apartments
4.1
4
Median number of rooms in houses and condos
5.8
5.8
Median house price - detached houses
$496,462
$738,188
Median house price - in 2-unit structures
$630,561
$728,261
Median house price - in 3-to-4-unit structures
$205,310
$428,231
Median house price - in 5 or more unit structures
$382,635
$565,629
Median house price - mobile homes
$104,325
$169,855
Median house price - Townhouses or other attached units
$463,571
$585,764
Median house price - All housing units
$481,210
$680,692
Median house age
44
41
Renting percentage
50.6%
45.9%
Housing density (houses/condos per square mile)
2,168.8
1,783.2
House value disparities
25.5%
22.8%
Household income disparities
44%
41.9%
Median household income for houses/condes with a mortgage
$109,432
$125,914
Median household income for apartments without a mortgage
$82,443
$83,816
Housing units without a mortgage
1,166 (1.6%)
348 (1.3%)
Housing units with both a second mortgage and home equity loan
4,385 (6.1%)
1,954 (7.4%)
Housing units with a mortgage
70,415 (98.4%)
25,990 (98.7%)
Housing units with a home equity loan
204 (0.3%)
83 (0.3%)
Housing units with a second mortgage
5,362 (7.5%)
2,882 (10.9%)
House/condo owner moved in on average (years ago)
10
11
House/condo renter moved in on average (years ago)
3
3
Housing units lacking complete kitchen facilities
1.2%
2.5%
Housing units lacking complete plumbing facilities
0.3%
0.9%
Housing units in structures
Housing units in structures
Sacramento
Santa Rosa
One, detached
61.7%
58.2%
One, attached
6.8%
11.6%
Two
1.8%
2.8%
3 or 4
4.8%
4.4%
5 to 9
6.9%
4.4%
10 to 19
4.9%
4.5%
20 to 49
3.5%
3.3%
50 or more
7.6%
7.1%
Mobile homes
1.9%
3.4%
Boats, RVs, vans, etc.
0.0%
0.4%
Median real estate property taxes paid for housing units
Self-employed workers in own not incorporated business
12,891
7,129
State government workers
40,274
2,157
Unpaid family workers
755
676
Industries and Occupations
Sacramento fields a wide range of industries, including government, healthcare, and insurance. In Santa Rosa, the major industries are healthcare, retail, and wine production.
Both cities offer high-quality healthcare services. Sacramento is home to several large hospitals and medical centers, while Santa Rosa too has multiple quality healthcare providers, including Kaiser Permanente and Sutter Health.
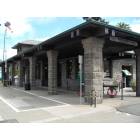
Sacramento, as a larger city, has extensive infrastructure including three major highways, an international airport, and a light rail system. Alternatively, Santa Rosa boasts a smaller-scale but well-maintained infrastructure, including Charles M. Schulz-Sonoma County Airport and several major highways.
Infrastructure
Type
Sacramento
Santa Rosa
Hospitals
17
15
TV stations
23
4
Bank branches located here
127
58
Bank institutions located here
31
20
Main business address for public companies
5
2
Drinking water stations with no reported violations in the past
26
20
Drinking water stations with reported violations in the past
HMDA - Conventional home purchase loans - Applications denied
Year
Sacramento
Santa Rosa
1999
1,003
474
2000
1,155
312
2001
983
229
2002
1,197
250
2003
2,258
478
2004
3,872
691
2005
4,610
885
2006
4,276
735
2007
2,386
472
2008
1,381
252
2009
647
165
Culture and Food
Sacramento boasts a diverse culinary scene, with influences from its immigrant population. It also hosts eclectic arts and music scenes. Santa Rosa, being situated in the Wine Country, offers a rich food and wine culture with numerous wineries and high-end restaurants.
Sports Teams
Sacramento has a greater presence of professional sports, housing the Sacramento Kings (NBA), and Sacramento Republic FC (USL). Alternatively, Santa Rosa does not host any major sports teams.


 Sacramento, CA
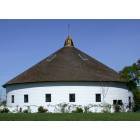
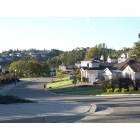
 Santa Rosa, CA