Sacramento and Roseville, nestled approximately 20 miles apart in sunny California, offer diverse living experiences. Sacramento as the state capital has a vibrant mix of urban buzz, cultural diversity, and rich history, while Roseville, a major suburb, offers a quieter residential environment, with a strong business economy and high-quality schools. Both cities provide a range of options for those keen to relocate or simply to visit. Each boasts attractions that cater to a broad spectrum of interests, from historical sites and parks to shopping centers and gastronomic experiences.
Distance between
Sacramento, CA and
Roseville, CA : 16.7 miles
Sacramento's population is larger by 246%. Its population has grown by 118,023 people (29.0%) since 2000. The population of Roseville has grown by 71,980 people (90.1%) during that time.
Sacramento, as a larger city, experiences a higher crime rate compared to Roseville. The levels in Roseville remain below the national average making it one of the safer cities in the region. Sacramento has dedicated a significant portion of the city’s budget to enhance safety, and there is a visible police presence. Visiting tourists and prospective residents should stay informed about the safer neighborhoods in Sacramento such as East Sacramento and Land Park.
City-data.com crime index counts serious crimes and violent crime more heavily. It adjusts for the number of visitors and daily workers commuting into cities. (higher means more crime, U.S. average = 301.1)
City-data.com crime index counts serious crimes and violent crime more heavily. It adjusts for the number of visitors and daily workers commuting into cities. (higher means more crime, U.S. average = 301.1)
Sex Offenders
According to our data, there are 2,246 registered sex offenders living in Sacramento and 148 registered sex offenders living in . The ratio of residents to sex offenders in Sacramento is 220 to 1; the ratio in Roseville is 897 to 1. The number of registered sex offenders compared to the number of residents is much larger in Sacramento than that in Roseville.
Cost of Living
Compared to Sacramento, Roseville holds a slightly higher cost of living index, mainly due to housing costs. However, Roseville's higher median household income somewhat offsets this. Standard consumer goods, groceries and healthcare are comparably priced in both cities. Overall, Sacramento provides more affordable housing options, whereas Roseville demands a slightly higher financial commitment.
Income Tax
As both are within the state of California, they have the same income tax rates, which are among the highest in the nation, ranging from 1% to 13.3% depending upon the income bracket.
Property Tax
Comparatively, property taxes in both cities don't differ significantly as they are based on the county rate. Sacramento County operates with a tax rate of 0.84%, and Placer County, where Roseville is located, has a rate of 0.77%.
Sales Tax
Sacramento has a combined city and state sales tax rate of 8.75%, while Roseville sits at 7.25%. The difference is attributed to additional Sacramento-specific taxes beyond the California state sales tax.
Income
Type
Sacramento
Roseville
Estimated median household income
$75,311
$107,714
Estimated per capita income
$37,916
$49,304
Cost of living index (U.S. average is 100)
102.9
102.6
If you make $50,000 in Roseville, you will have to make $50,146 in Sacramento to maintain the same standard of living.
Geographical Conditions
Both cities are located in the Central Valley, with Sacramento sitting at the confluence of the Sacramento and American rivers, while Roseville is located closer to the Sierra Nevada foothills. Both offer easy access to nature and outdoor recreational activities.
For families with school-aged children, education is often a primary concern. Roseville’s public school district, Roseville Joint Union High School District, frequently ranks as one of California’s best. Sacramento also offers extensive educational options, including notable public, charter, and private schools, and it’s home to Sacramento State University.
Sacramento’s economy thrives mainly on government, healthcare, and education sectors, offering varied employment opportunities. Roseville, though smaller, has a diverse economy with strong retail, healthcare, and technology sectors. The job market is robust in both cities, but Roseville generally enjoys a lower unemployment rate.
Biggest Employers
In Sacramento, State of California, Sacramento County, and Sutter Health are the leading employment providers. Roseville, on the other hand, hosts comprehensive company bases. Top employers include Kaiser Permanente, Hewlett-Packard and the City of Roseville.
There were 1,004 building permits issued in Sacramento in 2012 (943 more than in 2011) compared to 1,883 building permits issued in Roseville in 2012 (1472 more than in 2011).
In Sacramento (Sacramento County), 58.1% voted for Democrats and 39.1% for Republicans in 2012 Presidential Election. In Roseville (Placer County), 38.9% voted for Democrats and 58.2% for Republicans.
Elections
Type
Democrats
Republicans
Other
Year
Sacramento
Roseville
Sacramento
Roseville
Sacramento
Roseville
2020
61.4%
45.5%
36.1%
52.2%
2.5%
2.3%
2016
58.0%
39.6%
33.8%
51.2%
8.3%
9.2%
2012
58.1%
38.9%
39.1%
58.2%
2.8%
2.9%
2008
58.4%
43.4%
39.4%
54.7%
2.2%
2.0%
2004
49.8%
36.4%
49.6%
62.9%
0.6%
0.6%
2000
49.4%
36.1%
45.4%
59.4%
5.2%
4.5%
1996
49.8%
37.0%
40.8%
52.7%
9.4%
10.2%
Breakdown of population affiliated with a religious congregation
Type
Adherents
Congregations
Religion
Sacramento
Roseville
Sacramento
Roseville
CATHOLIC CHURCH
16.2%
14.7%
5.1%
4.7%
SOUTHERN BAPTIST CONVENTION
1.7%
0.5%
8.6%
6.3%
MUSLIM ESTIMATE
0.9%
0.0%
1.3%
0.0%
NORTH AMERICAN BAPTIST CONFERENCE
0.6%
0.4%
2.2%
2.4%
SEVENTH DAY ADVENTIST CHURCH
0.6%
0.7%
2.1%
3.6%
EVANGELICAL LUTHERAN CHURCH IN AMERICA
0.5%
0.6%
1.8%
2.4%
AMERICAN BAPTIST CHURCHES IN THE USA
0.4%
0.0%
1.7%
0.0%
EPISCOPAL CHURCH
0.3%
0.3%
1.4%
2.0%
EVANGELICAL PRESBYTERIAN CHURCH
0.2%
0.4%
0.1%
0.4%
Weather
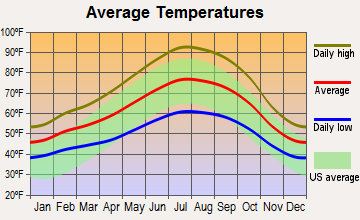
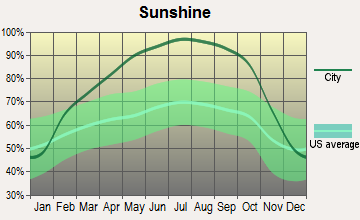
The climates in Sacramento and Roseville are quite similar due to their geographical proximity. Both have hot summers, mild winters, and over 250 sunny days per year. Summer temperatures often exceed 90 degrees Fahrenheit, while winters average in the high 50s. Given the warm, dry climate, both are great places for outdoor activities.
Weather and climate
Type
Sacramento
Roseville
Temperature - Average
62.2°F
61.8°F
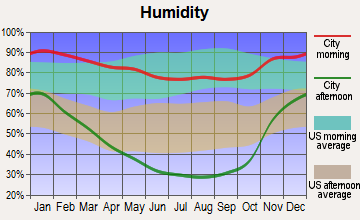
Humidity - Average morning or afternoon humidity
66.8%
66.8%
Humidity - Differences between morning and afternoon humidity
58%
57.9%
Humidity - Maximum monthly morning or afternoon humidity
87%
87%
Humidity - Minimum monthly morning or afternoon humidity
29%
29.1%
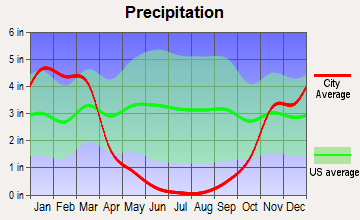
Precipitation - Yearly average
19 in
24.7 in
Snowfall - Yearly average
0 in
0 in
Clouds - Number of days clear of clouds
31.5%
31.5%
Sunshine amount - Average
83.6%
83.6%
Sunshine amount - Differences during a year
52%
51.9%
Sunshine amount - Maximum monthly
97%
96.9%
Sunshine amount - Minimum monthly
45%
45%
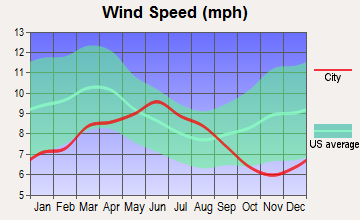
Wind speed - Average
6.8 mph
6.9 mph
Average climate in Sacramento, California
Average climate in Roseville, California
Air pollution
Type
AQI
CO
NO2
OZONE
PB
PM10
PM25
SO2
Year
Sacramento
Roseville
Sacramento
Roseville
Sacramento
Roseville
Sacramento
Roseville
Sacramento
Roseville
Sacramento
Roseville
Sacramento
Roseville
Sacramento
Roseville
2018
121
135
0.32
0.37
9.7
7.7
24.7
26.9
0.002
0.002
28.9
22.5
12.7
11.1
N/A
N/A
2017
117
115
0.33
0.33
9.0
7.9
25.2
27.9
0.002
0.002
22.1
15.8
8.8
7.1
N/A
N/A
2016
103
107
0.44
0.46
8.0
8.1
25.3
27.3
0.002
0.002
14.0
15.1
9.0
8.2
N/A
N/A
2015
105
115
0.25
0.29
9.7
8.6
24.9
27.8
0.002
0.002
16.2
17.0
10.9
10.1
N/A
N/A
2014
99
110
0.24
0.28
10.2
8.6
24.9
27.8
0.002
0.002
15.6
14.5
9.6
10.5
N/A
N/A
2013
102
106
0.29
0.30
11.1
10.2
23.2
25.8
0.002
0.002
21.3
21.0
11.9
10.9
N/A
N/A
2012
107
110
0.31
0.31
10.5
10.2
25.2
28.4
0.002
0.002
15.2
15.1
7.9
9.5
N/A
N/A
2011
106
110
0.29
0.36
11.2
11.0
24.0
27.2
0.002
0.002
17.7
17.5
10.8
10.9
N/A
N/A
2010
109
109
0.29
0.31
11.2
9.9
22.8
25.5
N/A
N/A
16.9
15.9
9.3
11.0
0.5
0.5
2009
118
118
0.40
0.37
12.4
10.4
23.3
26.1
0.003
0.003
20.6
18.5
11.4
10.7
0.5
0.5
2008
130
130
0.40
0.38
14.9
12.3
25.4
27.0
N/A
N/A
24.3
22.6
13.6
13.9
0.5
0.5
2007
129
129
0.39
0.40
14.8
12.5
23.7
27.4
0.005
0.005
19.9
19.5
13.5
12.2
0.6
0.6
2006
124
132
0.49
0.46
15.4
13.4
22.7
27.3
N/A
N/A
23.7
22.9
13.0
13.5
0.5
0.5
2005
125
127
0.42
0.31
15.9
13.5
20.0
21.7
N/A
N/A
22.1
20.0
13.5
14.6
0.6
0.6
2004
119
128
0.49
0.32
15.8
12.8
19.1
24.8
N/A
N/A
22.7
22.1
13.3
14.6
0.6
0.6
2003
119
111
0.47
0.36
16.8
14.1
20.3
25.9
N/A
N/A
23.1
19.3
N/A
N/A
0.9
0.9
2002
114
114
0.50
0.40
18.1
15.9
21.2
27.7
0.004
0.004
25.1
23.2
N/A
N/A
1.5
1.5
2001
111
116
0.43
0.38
18.0
14.7
21.2
26.4
0.004
0.004
20.7
18.2
N/A
N/A
1.4
1.4
2000
107
118
0.55
0.42
17.9
16.5
19.5
24.2
0.004
0.004
19.1
17.7
N/A
N/A
1.4
1.4
Natural disasters
Type
Sacramento
Roseville
Tornado activity compared to U.S. average
8.8%
7.8%
Earthquake activity compared to U.S. average
7,798.9%
7,686.4%
Natural disasters compared to U.S. average
18%
17%
Transportation
Sacramento’s public transportation system is comprehensive, with light rail and bus services serving the city and surrounding regions. Roseville Transit operates local bus services, and a commuter rail line called Capitol Corridor connects Roseville and Sacramento, catering to commuters.
Transport
Type
Sacramento
Roseville
Amtrak stations
1
1
Amtrak stations nearby
3
3
FAA registered aircraft
414
89
FAA registered aircraft manufacturers and dealers
20
2
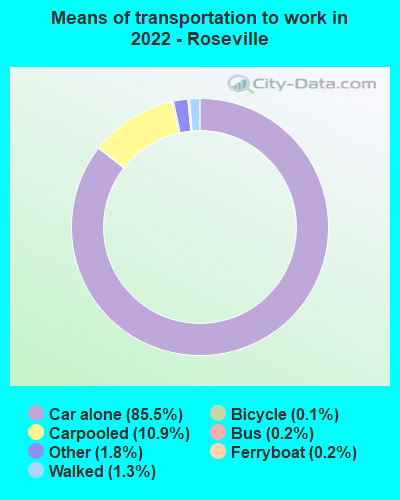
Means of transportation to work
Type
Sacramento
Roseville
Bicycle
1.1%
0.3%
Bus
1%
0.5%
Carpooled
12%
7.9%
Car alone
80%
88.8%
Motorcycle
0.2%
0.3%
Railroad
0.4%
0.1%
Streetcar
0.1%
0.1%
Taxicab
0.1%
0%
Walked
2.8%
0.9%
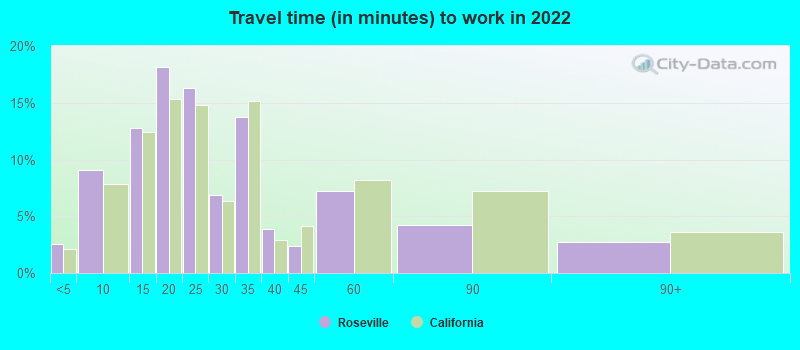
Average travel time to work
Type
Sacramento
Roseville
Average
28.5 min
24.9 min
Other means
22.8 min
26.9 min
Public transportation
39 min
48.5 min
Private vehicle occupancy
Type
Sacramento
Roseville
Average
1.2
1.1
Drove alone
88.5%
91.6%
In 2 person carpool
9.4%
6.1%
In 3 person carpool
1.2%
1.2%
In 4 person carpool
0.4%
0.5%
In 5-6 person carpool
0.5%
0.2%
In 7+ person carpool
0%
0.3%
How many people usually rode to work in the car, truck or van.
Real Estate
With a larger population, Sacramento's real estate market is more dynamic, having a spectrum of housing options, from affordable apartments to high-end homes. On the flip side, Roseville proffers predominantly single-family homes, balancing upper-end residences and more affordable housing options.
Neighborhoods
Sacramento's neighborhoods like Midtown and East Sacramento offer a diverse mix of living experiences, from vibrant urban appeal to quieter, family-friendly areas. Roseville features predominantly suburban neighborhoods, offering a quieter, more homogeneous living environment such as Stoneridge and East Roseville Parkway.
Houses and residents
Type
Sacramento
Roseville
Houses
210,715
59,392
Average household size (people)
2.6
2.6
Median year apartment built
1977
1995
Median year house/condo built
1978
2000
Length of stay in the house since moving in
12.8 years
10.6 years
Houses occupied
202,093 (95.9%)
57,569 (96.9%)
Houses occupied by owners
103,994 (51.5%)
39,453 (68.5%)
Houses occupied by renters
98,099 (48.5%)
18,116 (31.5%)
Median rent asked for vacant for-rent units
$976.09
$2,343
Median monthly housing costs
$1,558
$1,997
Median price asked for vacant for-sale houses and condos
$398,191
$556,233
Estimated median house or condo value
$449,600
$605,300
Median numbers of rooms
5
5.9
Median number of rooms in apartments
4.1
4.2
Median number of rooms in houses and condos
5.8
6.7
Median house price - detached houses
$496,462
$571,089
Median house price - in 2-unit structures
$630,561
$295,859
Median house price - in 3-to-4-unit structures
$205,310
$366,555
Median house price - in 5 or more unit structures
$382,635
$562,719
Median house price - mobile homes
$104,325
$194,495
Median house price - Townhouses or other attached units
$463,571
$374,677
Median house price - All housing units
$481,210
$559,229
Median house age
44
23
Renting percentage
50.6%
34.5%
Housing density (houses/condos per square mile)
2,168.8
1,948.8
House value disparities
25.5%
17.2%
Household income disparities
44%
39.2%
Median household income for houses/condes with a mortgage
$109,432
$150,604
Median household income for apartments without a mortgage
$82,443
$85,640
Housing units without a mortgage
1,166 (1.6%)
232 (0.8%)
Housing units with both a second mortgage and home equity loan
4,385 (6.1%)
1,679 (5.7%)
Housing units with a mortgage
70,415 (98.4%)
29,049 (99.2%)
Housing units with a home equity loan
204 (0.3%)
376 (1.3%)
Housing units with a second mortgage
5,362 (7.5%)
2,374 (8.1%)
House/condo owner moved in on average (years ago)
10
8
House/condo renter moved in on average (years ago)
3
2
Housing units lacking complete kitchen facilities
1.2%
2.1%
Housing units lacking complete plumbing facilities
0.3%
0.2%
Housing units in structures
Housing units in structures
Sacramento
Roseville
One, detached
61.7%
74.0%
One, attached
6.8%
4.3%
Two
1.8%
0.9%
3 or 4
4.8%
4.3%
5 to 9
6.9%
2.9%
10 to 19
4.9%
2.8%
20 to 49
3.5%
2.1%
50 or more
7.6%
7.3%
Mobile homes
1.9%
1.5%
Median real estate property taxes paid for housing units
Self-employed workers in own not incorporated business
12,891
5,490
State government workers
40,274
4,557
Unpaid family workers
755
216
Industries and Occupations
Governmental occupations dominate in Sacramento due to its status as the state capital; other prevalent sectors include healthcare, education, and retail. Conversely, Roseville homes major players in healthcare, technology, and retail like Adventist Health, Hewlett-Packard, and Westfield Galleria.
Sacramento houses numerous hospitals and specialty medical centers, including the UC Davis Medical Center. Roseville too hosts extensive healthcare facilities, including the renowned Sutter Roseville Medical Center and Kaiser Permanente Roseville Medical Center.
Health (county statistics)
Type
Sacramento
Roseville
General health status score of residents in this county from 1 (poor) to 5 (excellent)
With Sacramento serving as the state capital, it possesses well-developed infrastructure. It houses the Sacramento International Airport and Amtrak station offering seamless connectivity. Roseville also boasts reliable infrastructures like well-maintained roadways and parks and a city-owned electricity provider, lending stability and lower rates for residents.
Infrastructure
Type
Sacramento
Roseville
Hospitals
17
3
TV stations
23
24
Bank branches located here
127
58
Bank institutions located here
31
27
Main business address for public companies
5
2
Drinking water stations with no reported violations in the past
26
1
Drinking water stations with reported violations in the past
HMDA - Conventional home purchase loans - Applications denied
Year
Sacramento
Roseville
1999
1,003
218
2000
1,155
76
2001
983
62
2002
1,197
61
2003
2,258
477
2004
3,872
792
2005
4,610
985
2006
4,276
654
2007
2,386
438
2008
1,381
242
2009
647
112
Culture and Food
Sacramento, often called the 'Farm-to-Fork' capital, offers a rich culinary scene with a variety of ethnic foods. It also boasts various museums, theaters, and art galleries. Roseville has a diverse range of restaurants, mostly located around its main shopping center, the Galleria, and offers a distinct suburban culture with community events like the annual Roseville Festival.
Sports Teams
Sacramento is home to the NBA’s Sacramento Kings and a host of minor league teams in various sports. Roseville doesn't have professional sports teams. However, its proximity to Sacramento means residents can easily access and support the professional sports scene.


 Sacramento, CA
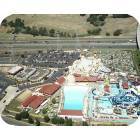
 Roseville, CA