Comparing the living conditions between Sacramento and Berkeley might prove insightful for those planning to relocate or take a visit, taking into account aspects such as crime and safety, weather, cost of living, education, work and economy, infrastructure, and more. Both cities are situated in California and offer their unique outlooks, with Sacramento as the state capital carrying a business-oriented and bustling urban environment contrasted by Berkeley's university-town ambiance known for its vibrant arts and intellectual scene. Each city carries its unique appeal depending on your lifestyle preferences.
Distance between
Sacramento, CA and
Berkeley, CA : 64.4 miles
Sacramento's population is larger by 348%. Its population has grown by 118,023 people (29.0%) since 2000. The population of Berkeley has grown by 14,402 people (14.0%) during that time.
Berkeley generally has a higher crime rate than Sacramento, including violent and property crimes. However, visitors can have a safe trip by staying alert and aware of their surroundings, particularly at night or in less crowded areas. Most reported crimes occur near campus areas or commercial districts. On the other hand, Sacramento's crime rate varies by neighborhood. Both cities have police departments actively working on community safety initiatives to curb crime rates.
City-data.com crime index counts serious crimes and violent crime more heavily. It adjusts for the number of visitors and daily workers commuting into cities. (higher means more crime, U.S. average = 301.1)
City-data.com crime index counts serious crimes and violent crime more heavily. It adjusts for the number of visitors and daily workers commuting into cities. (higher means more crime, U.S. average = 301.1)
Sex Offenders
According to our data, there are 2,246 registered sex offenders living in Sacramento and 69 registered sex offenders living in . The ratio of residents to sex offenders in Sacramento is 220 to 1; the ratio in Berkeley is 1,757 to 1. The number of registered sex offenders compared to the number of residents is much larger in Sacramento than that in Berkeley.
Cost of Living
Berkeley's cost of living is higher than Sacramento’s, primarily due to housing costs. Grocery expenses, transportation, and healthcare are also pricier in Berkeley. Sacramento, although still costly compared to national averages - as it's a norm with California cities, is considered more affordable by California standards, making it attractive for those considering relocation.
Income Tax
There is no city income tax in either Sacramento or Berkeley, but California's state income tax is progressive and ranges from 1% to 13.3%, which both cities are subject to.
Property Tax
Property tax rates are similar in both cities and adhere to the statewide rate (approximately 0.76%). However, due to the higher property values in Berkeley, homeowners there are likely to pay more in property taxes overall.
Sales Tax
Sacramento has a city sales tax rate of 8.75%, while Berkeley's is slightly higher at 9.25%. These rates are on top of California's statewide sales tax rate of 7.25%.
Income
Type
Sacramento
Berkeley
Estimated median household income
$75,311
$101,048
Estimated per capita income
$37,916
$59,752
Cost of living index (U.S. average is 100)
102.9
130.2
If you make $50,000 in Sacramento, you will have to make $63,265 in Berkeley to maintain the same standard of living.
Geographical Conditions
Berkeley is characterized by its hilly terrain and proximity to the San Francisco Bay, providing stunning views and numerous outdoor activities. Sacramento is located at the confluence of the Sacramento and American Rivers, offering a flat, urban landscape interspersed with lush green spaces.
Berkeley hosts the globally renowned University of California, Berkeley, making it a hub for higher education and research. The city is known for its highly educated populace, academic initiatives, and strong K-12 schools. Sacramento also provides quality education at all levels, boasting numerous public, private schools, and colleges like the California State University, Sacramento, but it lacks the competitive university-town atmosphere that Berkeley has.
Sacramento's work scene is heavily influenced by government jobs, being the state's capital. However, it's also diversifying with growth in healthcare, education, and tech startups. Berkeley's economy is anchored by education, with UC Berkeley being the major employer. Tech companies are also making their mark in the city due to its proximity to Silicon Valley.
Biggest Employers
The State of California, Sacramento County, and Sutter Health are among Sacramento’s largest employers. For Berkeley, UC Berkeley, Lawrence Berkeley National Laboratory, and the local school district provide the majority of employment.
There were 1,004 building permits issued in Sacramento in 2012 (943 more than in 2011) compared to 88 building permits issued in Berkeley in 2012 (84 more than in 2011).
In Sacramento (Sacramento County), 58.1% voted for Democrats and 39.1% for Republicans in 2012 Presidential Election. In Berkeley (Alameda County), 78.9% voted for Democrats and 18.2% for Republicans.
Elections
Type
Democrats
Republicans
Other
Year
Sacramento
Berkeley
Sacramento
Berkeley
Sacramento
Berkeley
2020
61.4%
79.8%
36.1%
17.6%
2.5%
2.6%
2016
58.0%
78.2%
33.8%
14.6%
8.3%
7.2%
2012
58.1%
78.9%
39.1%
18.2%
2.8%
3.0%
2008
58.4%
78.8%
39.4%
19.3%
2.2%
2.0%
2004
49.8%
75.5%
49.6%
23.4%
0.6%
1.1%
2000
49.4%
69.6%
45.4%
24.2%
5.2%
6.2%
1996
49.8%
65.8%
40.8%
23.1%
9.4%
11.2%
Breakdown of population affiliated with a religious congregation
Type
Adherents
Congregations
Religion
Sacramento
Berkeley
Sacramento
Berkeley
CATHOLIC CHURCH
16.2%
15.3%
5.1%
4.9%
SOUTHERN BAPTIST CONVENTION
1.7%
1.5%
8.6%
10.9%
MUSLIM ESTIMATE
0.9%
2.0%
1.3%
2.5%
NORTH AMERICAN BAPTIST CONFERENCE
0.6%
0.0%
2.2%
0.1%
SEVENTH DAY ADVENTIST CHURCH
0.6%
0.3%
2.1%
1.4%
EVANGELICAL LUTHERAN CHURCH IN AMERICA
0.5%
0.3%
1.8%
2.3%
AMERICAN BAPTIST CHURCHES IN THE USA
0.4%
0.5%
1.7%
2.5%
EPISCOPAL CHURCH
0.3%
0.3%
1.4%
1.7%
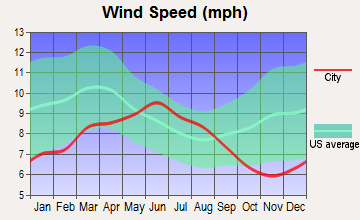
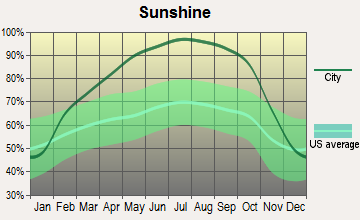
Weather
Weather-wise, both cities have a Mediterranean climate, but Sacramento experiences hotter summers with temperatures often exceeding 90°F, and cooler, wetter winters. On the other hand, Berkeley's weather is usually milder, with cooler summers due to the seaside fog and slightly warmer winters, making it more comfortable for outdoor activities year-round.
Weather and climate
Type
Sacramento
Berkeley
Temperature - Average
62.2°F
57.7°F
Humidity - Average morning or afternoon humidity
66.8%
84.2%
Humidity - Differences between morning and afternoon humidity
58%
29%
Humidity - Maximum monthly morning or afternoon humidity
87%
90.9%
Humidity - Minimum monthly morning or afternoon humidity
29%
61.9%
Precipitation - Yearly average
19 in
25.3 in
Snowfall - Yearly average
0 in
0 in
Clouds - Number of days clear of clouds
31.5%
27%
Sunshine amount - Average
83.6%
73%
Sunshine amount - Differences during a year
52%
22%
Sunshine amount - Maximum monthly
97%
77%
Sunshine amount - Minimum monthly
45%
55%
Wind speed - Average
6.8 mph
11.4 mph
Average climate in Sacramento, California
Average climate in Berkeley, California
Air pollution
Type
AQI
CO
NO2
OZONE
PB
PM10
PM25
SO2
Year
Sacramento
Berkeley
Sacramento
Berkeley
Sacramento
Berkeley
Sacramento
Berkeley
Sacramento
Berkeley
Sacramento
Sacramento
Berkeley
Sacramento
Berkeley
2018
121
105
0.32
0.53
9.7
14.4
24.7
18.9
0.002
0.012
28.9
N/A
12.7
12.6
N/A
0.4
2017
117
100
0.33
0.59
9.0
15.2
25.2
18.3
0.002
0.008
22.1
N/A
8.8
9.9
N/A
0.6
2016
103
79
0.44
0.48
8.0
13.2
25.3
19.6
0.002
0.005
14.0
N/A
9.0
8.1
N/A
0.8
2015
105
93
0.25
0.47
9.7
13.6
24.9
21.7
0.002
0.004
16.2
N/A
10.9
9.6
N/A
0.7
2014
99
90
0.24
0.45
10.2
13.7
24.9
21.5
0.002
0.005
15.6
N/A
9.6
9.4
N/A
0.6
2013
102
88
0.29
0.43
11.1
14.5
23.2
19.5
0.002
0.004
21.3
N/A
11.9
11.8
N/A
0.5
2012
107
87
0.31
0.41
10.5
13.1
25.2
21.1
0.002
0.003
15.2
N/A
7.9
7.8
N/A
1.0
2011
106
94
0.29
0.35
11.2
13.9
24.0
19.8
0.002
0.003
17.7
N/A
10.8
10.1
N/A
1.5
2010
109
88
0.29
0.31
11.2
12.9
22.8
19.3
N/A
0.017
16.9
N/A
9.3
8.8
0.5
0.8
2009
118
98
0.40
0.33
12.4
12.9
23.3
18.2
0.003
0.006
20.6
N/A
11.4
9.8
0.5
0.9
2008
130
110
0.40
0.27
14.9
14.3
25.4
18.8
N/A
0.006
24.3
N/A
13.6
12.9
0.5
0.9
2007
129
98
0.39
0.39
14.8
12.7
23.7
21.9
0.005
0.006
19.9
N/A
13.5
9.9
0.6
1.2
2006
124
104
0.49
0.45
15.4
13.3
22.7
22.2
N/A
N/A
23.7
N/A
13.0
9.8
0.5
1.4
2005
125
94
0.42
0.47
15.9
12.7
20.0
18.4
N/A
N/A
22.1
N/A
13.5
9.5
0.6
1.5
2004
119
105
0.49
0.51
15.8
13.8
19.1
18.6
N/A
0.004
22.7
N/A
13.3
11.5
0.6
1.7
2003
119
81
0.47
0.59
16.8
14.8
20.3
18.9
N/A
N/A
23.1
N/A
N/A
N/A
0.9
1.5
2002
114
81
0.50
0.62
18.1
15.9
21.2
19.2
0.004
0.008
25.1
N/A
N/A
N/A
1.5
1.5
2001
111
86
0.43
0.62
18.0
15.6
21.2
17.2
0.004
0.008
20.7
N/A
N/A
N/A
1.4
1.3
2000
107
76
0.55
0.71
17.9
15.8
19.5
15.8
0.004
0.014
19.1
N/A
N/A
N/A
1.4
1.8
Natural disasters
Type
Sacramento
Berkeley
Tornado activity compared to U.S. average
8.8%
8.6%
Earthquake activity compared to U.S. average
7,798.9%
7,631.7%
Natural disasters compared to U.S. average
18%
20%
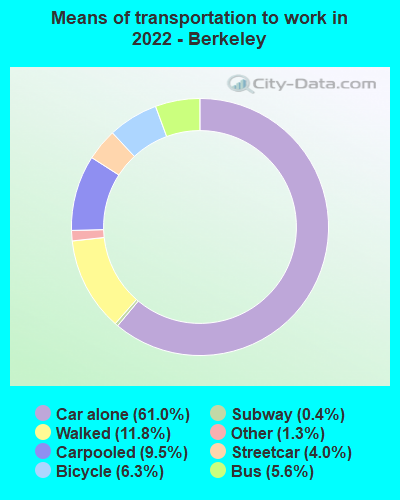
Transportation
Sacramento has a broader road network suitable for car commuting. Its public transit system includes buses and light rail run by Sacramento Regional Transit. Berkeley, on the other hand, is highly walkable and bike-friendly. Public transportation options here include the AC Transit bus network and Bay Area Rapid Transit (BART) services.
Transport
Type
Sacramento
Berkeley
Amtrak stations
1
1
Amtrak stations nearby
3
3
FAA registered aircraft
414
54
FAA registered aircraft manufacturers and dealers
20
0
Means of transportation to work
Type
Sacramento
Berkeley
Bicycle
1.1%
5.8%
Bus
1%
4.2%
Carpooled
12%
10.8%
Car alone
80%
65.6%
Motorcycle
0.2%
0.5%
Railroad
0.4%
0.4%
Streetcar
0.1%
2.3%
Subway
0.1%
0.2%
Taxicab
0.1%
0%
Walked
2.8%
8.4%
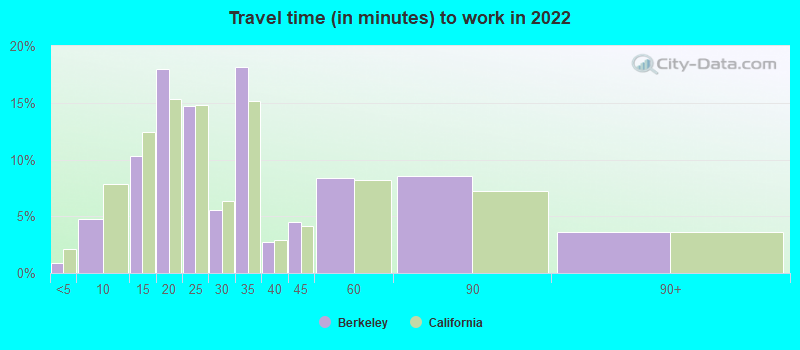
Average travel time to work
Type
Sacramento
Berkeley
Average
28.5 min
29.9 min
Other means
22.8 min
26 min
Public transportation
39 min
45.2 min
Private vehicle occupancy
Type
Sacramento
Berkeley
Average
1.2
1.1
Drove alone
88.5%
91.1%
In 2 person carpool
9.4%
7.1%
In 3 person carpool
1.2%
1%
In 4 person carpool
0.4%
0%
In 5-6 person carpool
0.5%
0.8%
How many people usually rode to work in the car, truck or van.
Real Estate
Real Estate in Berkeley is quite expensive, with median home prices that regularly exceed those of Sacramento. Sacramento's real estate market, although steadily climbing, is more affordable, making it a better option for home buyers considering budget and value.
Neighborhoods
Each city has its unique neighborhoods. Sacramento offers areas like Midtown, known for its vibrant nightlife, and East Sacramento, attractive for its historic homes and parks. Berkeley is home to iconic neighborhoods like the gourmet-centric North Berkeley and the student-populated Southside.
Houses and residents
Type
Sacramento
Berkeley
Houses
210,715
50,228
Average household size (people)
2.6
2.2
Median year apartment built
1977
1961
Length of stay in the house since moving in
12.8 years
15.8 years
Houses occupied
202,093 (95.9%)
43,893 (87.4%)
Houses occupied by owners
103,994 (51.5%)
20,207 (46%)
Houses occupied by renters
98,099 (48.5%)
23,686 (54%)
Median rent asked for vacant for-rent units
$976.09
$3,392
Median monthly housing costs
$1,558
$2,186
Median price asked for vacant for-sale houses and condos
$398,191
$1,929,908
Estimated median house or condo value
$449,600
Over $1,000,000
Median numbers of rooms
5
4.4
Median number of rooms in apartments
4.1
3.3
Median number of rooms in houses and condos
5.8
6.4
Median house price - detached houses
$496,462
Over $1,000,000
Median house price - in 2-unit structures
$630,561
$864,846
Median house price - in 3-to-4-unit structures
$205,310
$795,296
Median house price - in 5 or more unit structures
$382,635
$810,862
Median house price - Townhouses or other attached units
$463,571
Over $1,000,000
Median house price - All housing units
$481,210
Over $1,000,000
Median house age
44
78
Renting percentage
50.6%
59.1%
Housing density (houses/condos per square mile)
2,168.8
4,802.3
House value disparities
25.5%
19%
Household income disparities
44%
44.2%
Median household income for houses/condes with a mortgage
$109,432
$203,599
Median household income for apartments without a mortgage
$82,443
$126,414
Housing units without a mortgage
1,166 (1.6%)
431 (3.1%)
Housing units with both a second mortgage and home equity loan
4,385 (6.1%)
1,291 (9.3%)
Housing units with a mortgage
70,415 (98.4%)
13,480 (96.9%)
Housing units with a home equity loan
204 (0.3%)
0 (0%)
Housing units with a second mortgage
5,362 (7.5%)
1,546 (11.1%)
House/condo owner moved in on average (years ago)
10
15
House/condo renter moved in on average (years ago)
3
2
Housing units lacking complete kitchen facilities
1.2%
1.5%
Housing units lacking complete plumbing facilities
0.3%
1%
Housing units in structures
Housing units in structures
Sacramento
Berkeley
One, detached
61.7%
41.9%
One, attached
6.8%
4.5%
Two
1.8%
6.2%
3 or 4
4.8%
9.8%
5 to 9
6.9%
8.1%
10 to 19
4.9%
11.0%
20 to 49
3.5%
8.4%
50 or more
7.6%
9.9%
Mobile homes
1.9%
0.1%
Boats, RVs, vans, etc.
0.0%
0.1%
Median real estate property taxes paid for housing units
Self-employed workers in own not incorporated business
12,891
4,908
State government workers
40,274
8,941
Unpaid family workers
755
68
Industries and Occupations
Government, education, healthcare, and technology are leading industries in Sacramento, offering diverse job opportunities. In Berkeley, the main occupations revolve around education, research, the sciences, and the expanding technology sector.
Both Berkeley and Sacramento have outstanding health care facilities. Sacramento is served by notable institutions like UC Davis Medical Center and Sutter Medical Center. Berkeley residents mostly rely on facilities in the nearby Oakland or San Francisco area, but the city itself has Alta Bates Summit Medical Center, affiliated with Sutter Health.
Health (county statistics)
Type
Sacramento
Berkeley
General health status score of residents in this county from 1 (poor) to 5 (excellent)
Both cities have well-established infrastructures, but Sacramento's urban development is more spread out, with a mix of modern and historic buildings. Berkeley is more compact and pedestrian-friendly, with a blend of commercial districts and residential neighborhoods.
Infrastructure
Type
Sacramento
Berkeley
Hospitals
17
2
TV stations
23
24
Arenas or stadiums
1
2
Bank branches located here
127
19
Bank institutions located here
31
8
Main business address for public companies
5
5
Drinking water stations with no reported violations in the past
26
0
Drinking water stations with reported violations in the past
HMDA - Conventional home purchase loans - Applications denied
Year
Sacramento
Berkeley
1999
1,003
135
2000
1,155
141
2001
983
126
2002
1,197
102
2003
2,258
166
2004
3,872
202
2005
4,610
292
2006
4,276
282
2007
2,386
174
2008
1,381
94
2009
647
74
Culture and Food
Culturally, Berkeley is known for its vibrant intellectual and arts scene, with numerous galleries, theaters, and music venues. It also boasts a celebrated culinary landscape, with a strong emphasis on organic, locally-sourced food. Sacramento, while also having a thriving arts scene, is known as "America's Farm-to-Fork Capital" due to its focus on fresh, locally produced food.
Sports Teams
In terms of professional sports, Sacramento is home to the NBA's Sacramento Kings. Berkeley doesn't have any major league teams, but the California Golden Bears, the athletic teams of UC Berkeley, enjoy a significant following.


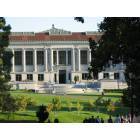
 Sacramento, CA
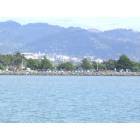
 Berkeley, CA