When it comes to living in Sacramento, CA, or Antioch, CA, the two offer differing experiences with unique rewards. Sacramento, the state capital, has a vibrant civic life and offers a more urban experience with a heavy government influence. Antioch, located in the East Bay of San Francisco, features a suburban feel coupled with great outdoor opportunities. Each city has its benefits and burdens when it comes to crime/safety, weather, cost of living, education, work, economy, and many other factors, which you will find detailed in the sections below.
Distance between
Sacramento, CA and
Antioch, CA : 42.9 miles
Sacramento's population is larger by 357%. Its population has grown by 118,023 people (29.0%) since 2000. The population of Antioch has grown by 24,262 people (26.8%) during that time.
When comparing crime rates Sacramento sees higher rates than Antioch, particularly in property crime. This is likely tied to its larger population and urban setting. In contrast, Antioch's overall crime rate is comparable to the national average, offering a semblance of safety often sought after by families. Visitors should consider these rates when planning activities and accommodations during their stay.
City-data.com crime index counts serious crimes and violent crime more heavily. It adjusts for the number of visitors and daily workers commuting into cities. (higher means more crime, U.S. average = 301.1)
City-data.com crime index counts serious crimes and violent crime more heavily. It adjusts for the number of visitors and daily workers commuting into cities. (higher means more crime, U.S. average = 301.1)
Sex Offenders
According to our data, there are 2,246 registered sex offenders living in Sacramento and 222 registered sex offenders living in . The ratio of residents to sex offenders in Sacramento is 220 to 1; the ratio in Antioch is 499 to 1. The number of registered sex offenders compared to the number of residents is larger in Sacramento than in Antioch.
Cost of Living
Currently, Sacramento has a cost of living higher than the national medium, a common trend in Californian cities. Antioch, while also above the national average, is more affordable when compared to Sacramento, notably due to lower housing costs. This can impact residents' quality of life and tourists' budgeting decisions.
Income Tax
As both cities are in California, residents are subject to the same high progressive state income tax rates, meaning higher earners pay more income tax.
Property Tax
Both cities function under California's property tax system. Yet, property taxes can be higher in Sacramento due to the higher real estate prices.
Sales Tax
The combined sales tax rate in both cities is the same at 8.25%. The similarity in tax rates ensure residents and tourists bear a similar tax burden while shopping in both cities.
Income
Type
Sacramento
Antioch
Estimated median household income
$75,311
$81,008
Estimated per capita income
$37,916
$36,202
Cost of living index (U.S. average is 100)
102.9
118.1
If you make $50,000 in Sacramento, you will have to make $57,386 in Antioch to maintain the same standard of living.
Geographical Conditions
Sacramento sits at the confluence of two rivers, offering riverfront attractions. Antioch prides itself on its marina and natural reserves like the Black Diamond Mines due to its location close to the delta of San Joaquin and Sacramento Rivers.
Both cities host public and private educational institutions. Sacramento's educational sector is more diverse, with universities such as California State University, Sacramento and University of California, Davis nearby. Antioch’s educational system is more geared towards K-12, but it does have a community college - Los Medanos College offering 2-year degrees.
Sacramento's economy mainly revolves around government, healthcare, and education, boosted by the presence of many state agencies. Alternatively, Antioch's economy is more mixed with healthcare, retail, and construction as key contributors. Job seekers and business travelers’ experiences may variate depending on their industry of interest.
Biggest Employers
In Sacramento, the largest employers are typically state agencies such as the California State Government. On the other hand, Antioch's largest employers include Sutter Delta Medical Center and Antioch Unified School District.
There were 1,004 building permits issued in Sacramento in 2012 (943 more than in 2011) compared to 578 building permits issued in Antioch in 2012 (429 more than in 2011).
In Sacramento (Sacramento County), 58.1% voted for Democrats and 39.1% for Republicans in 2012 Presidential Election. In Antioch (Contra Costa County), 66.2% voted for Democrats and 31.1% for Republicans.
Elections
Type
Democrats
Republicans
Other
Year
Sacramento
Antioch
Sacramento
Antioch
Sacramento
Antioch
2020
61.4%
71.8%
36.1%
26.4%
2.5%
1.8%
2016
58.0%
67.5%
33.8%
24.5%
8.3%
8.0%
2012
58.1%
66.2%
39.1%
31.1%
2.8%
2.7%
2008
58.4%
68.0%
39.4%
30.2%
2.2%
1.8%
2004
49.8%
62.6%
49.6%
36.7%
0.6%
0.7%
2000
49.4%
59.0%
45.4%
37.2%
5.2%
3.8%
1996
49.8%
55.7%
40.8%
35.2%
9.4%
9.1%
Breakdown of population affiliated with a religious congregation
Type
Adherents
Congregations
Religion
Sacramento
Antioch
Sacramento
Antioch
CATHOLIC CHURCH
16.2%
21.8%
5.1%
5.2%
SOUTHERN BAPTIST CONVENTION
1.7%
1.3%
8.6%
10.0%
MUSLIM ESTIMATE
0.9%
1.0%
1.3%
1.4%
NORTH AMERICAN BAPTIST CONFERENCE
0.6%
0.0%
2.2%
0.0%
SEVENTH DAY ADVENTIST CHURCH
0.6%
0.3%
2.1%
1.5%
EVANGELICAL LUTHERAN CHURCH IN AMERICA
0.5%
0.5%
1.8%
2.0%
AMERICAN BAPTIST CHURCHES IN THE USA
0.4%
0.3%
1.7%
2.6%
EPISCOPAL CHURCH
0.3%
0.5%
1.4%
2.3%
Weather
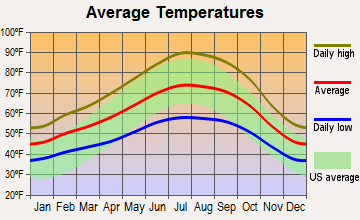
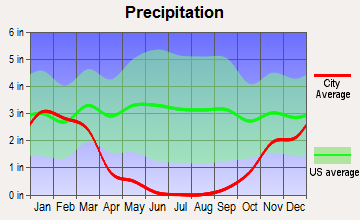
Weather-wise, Sacramento experiences hot, dry summers and mild, wet winters. Antioch enjoys similar weather, though typically milder due to its Bay Area location. These warm climates are great for tourists seeking sunshine and outdoor activities, but can contribute to high air conditioning costs for residents.
Weather and climate
Type
Sacramento
Antioch
Temperature - Average
62.2°F
60.4°F
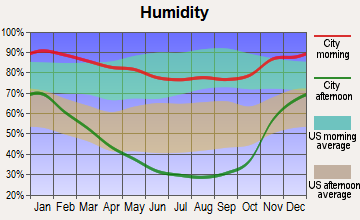
Humidity - Average morning or afternoon humidity
66.8%
69.7%
Humidity - Differences between morning and afternoon humidity
58%
47.1%
Humidity - Maximum monthly morning or afternoon humidity
87%
86.4%
Humidity - Minimum monthly morning or afternoon humidity
29%
39.4%
Precipitation - Yearly average
19 in
15.1 in
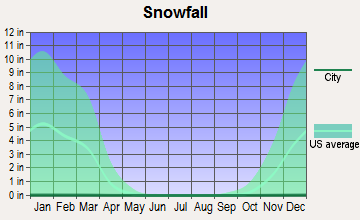
Snowfall - Yearly average
0 in
0 in
Clouds - Number of days clear of clouds
31.5%
30%
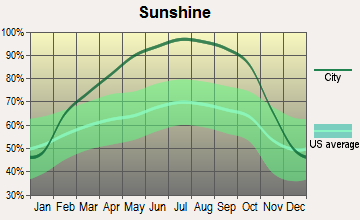
Sunshine amount - Average
83.6%
76.7%
Sunshine amount - Differences during a year
52%
28.8%
Sunshine amount - Maximum monthly
97%
81%
Sunshine amount - Minimum monthly
45%
52.2%
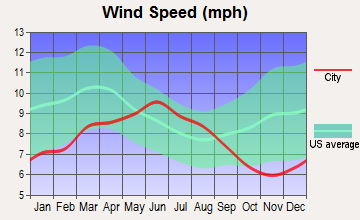
Wind speed - Average
6.8 mph
9 mph
Average climate in Sacramento, California
Average climate in Antioch, California
Air pollution
Type
AQI
CO
NO2
OZONE
PB
PM10
PM25
SO2
Year
Sacramento
Antioch
Sacramento
Antioch
Sacramento
Antioch
Sacramento
Antioch
Sacramento
Antioch
Sacramento
Sacramento
Antioch
Sacramento
Antioch
2018
121
99
0.32
0.35
9.7
6.7
24.7
26.0
0.002
N/A
28.9
N/A
12.7
12.8
N/A
0.7
2017
117
96
0.33
0.35
9.0
6.0
25.2
26.9
0.002
N/A
22.1
N/A
8.8
11.0
N/A
1.2
2016
103
92
0.44
0.34
8.0
5.7
25.3
26.4
0.002
N/A
14.0
N/A
9.0
7.1
N/A
1.2
2015
105
95
0.25
0.36
9.7
6.4
24.9
26.6
0.002
N/A
16.2
N/A
10.9
9.0
N/A
0.8
2014
99
93
0.24
0.31
10.2
6.6
24.9
26.0
0.002
N/A
15.6
N/A
9.6
7.8
N/A
0.7
2013
102
91
0.29
0.31
11.1
8.0
23.2
23.9
0.002
N/A
21.3
N/A
11.9
8.7
N/A
0.5
2012
107
88
0.31
0.31
10.5
7.3
25.2
26.3
0.002
N/A
15.2
N/A
7.9
7.6
N/A
0.6
2011
106
92
0.29
0.32
11.2
7.7
24.0
23.9
0.002
N/A
17.7
N/A
10.8
9.1
N/A
0.8
2010
109
77
0.29
0.30
11.2
7.1
22.8
25.7
N/A
N/A
16.9
N/A
9.3
6.8
0.5
0.8
2009
118
98
0.40
0.28
12.4
7.9
23.3
25.7
0.003
N/A
20.6
N/A
11.4
8.5
0.5
0.8
2008
130
120
0.40
0.31
14.9
9.4
25.4
26.4
N/A
0.005
24.3
N/A
13.6
11.3
0.5
1.4
2007
129
104
0.39
0.33
14.8
9.4
23.7
25.3
0.005
N/A
19.9
N/A
13.5
9.6
0.6
1.6
2006
124
106
0.49
0.38
15.4
10.3
22.7
26.1
N/A
N/A
23.7
N/A
13.0
11.7
0.5
2.1
2005
125
102
0.42
0.37
15.9
10.2
20.0
23.5
N/A
N/A
22.1
N/A
13.5
10.7
0.6
2.1
2004
119
115
0.49
0.41
15.8
10.4
19.1
24.0
N/A
N/A
22.7
N/A
13.3
12.1
0.6
1.8
2003
119
83
0.47
0.44
16.8
11.3
20.3
25.5
N/A
N/A
23.1
N/A
N/A
N/A
0.9
1.9
2002
114
89
0.50
0.48
18.1
12.9
21.2
25.6
0.004
N/A
25.1
N/A
N/A
N/A
1.5
2.3
2001
111
89
0.43
0.49
18.0
13.1
21.2
25.0
0.004
N/A
20.7
N/A
N/A
N/A
1.4
2.3
2000
107
97
0.55
0.53
17.9
13.2
19.5
23.4
0.004
N/A
19.1
N/A
N/A
N/A
1.4
1.7
Natural disasters
Type
Sacramento
Antioch
Tornado activity compared to U.S. average
8.8%
9.9%
Earthquake activity compared to U.S. average
7,798.9%
7,899.1%
Natural disasters compared to U.S. average
18%
18%
Transportation
Transit options in Sacramento are substantial, consisting of buses, light rail systems operated by the Sacramento Regional Transit, and multiple freeways. Antioch’s public transportation is provided by Tri-Delta Transit and the Antioch BART station for commuting into San Francisco and other Bay Area cities.
Transport
Type
Sacramento
Antioch
Amtrak stations
1
1
Amtrak stations nearby
3
2
FAA registered aircraft
414
20
FAA registered aircraft manufacturers and dealers
20
1
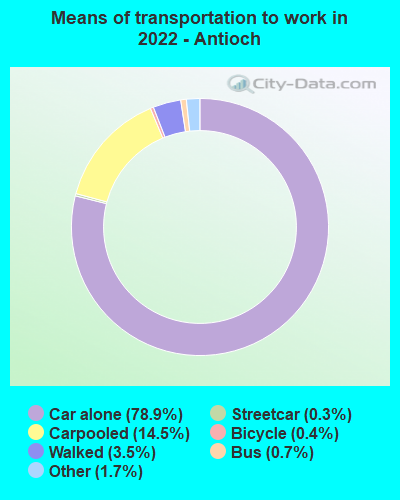
Means of transportation to work
Type
Sacramento
Antioch
Bicycle
1.1%
0.4%
Bus
1%
1%
Carpooled
12%
14.6%
Car alone
80%
79.3%
Motorcycle
0.2%
0.3%
Railroad
0.4%
0.4%
Streetcar
0.1%
0.3%
Taxicab
0.1%
0%
Walked
2.8%
3.1%
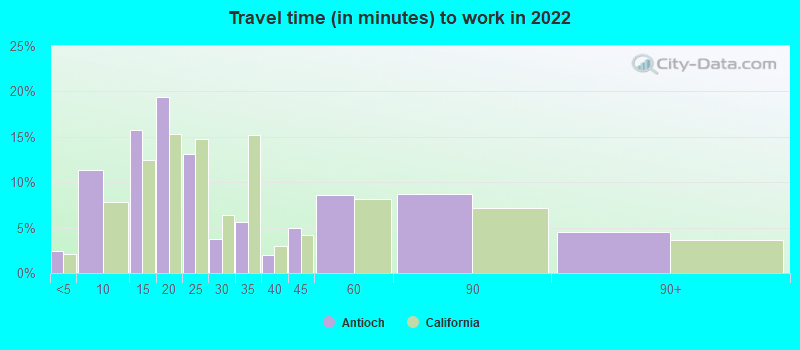
Average travel time to work
Type
Sacramento
Antioch
Average
28.5 min
26 min
Other means
22.8 min
41 min
Public transportation
39 min
67.7 min
Private vehicle occupancy
Type
Sacramento
Antioch
Average
1.2
1.3
Drove alone
88.5%
87.4%
In 2 person carpool
9.4%
7.4%
In 3 person carpool
1.2%
2%
In 4 person carpool
0.4%
0.6%
In 5-6 person carpool
0.5%
2.6%
How many people usually rode to work in the car, truck or van.
Real Estate
Housing in Sacramento is more expensive than in Antioch. House hunters and renters may find more affordable options in Antioch which could have a direct effect on the commutation depending on their workplace.
Neighborhoods
Sacramento has an extensive variety of neighborhoods, providing diversity in housing options. Antioch also has a broad range of neighborhoods, appealing to families due to its suburban ambiance.
Houses and residents
Type
Sacramento
Antioch
Houses
210,715
37,650
Average household size (people)
2.6
3.2
Median year apartment built
1977
1983
Median year house/condo built
1978
1989
Length of stay in the house since moving in
12.8 years
12.6 years
Houses occupied
202,093 (95.9%)
37,081 (98.5%)
Houses occupied by owners
103,994 (51.5%)
23,652 (63.8%)
Houses occupied by renters
98,099 (48.5%)
13,429 (36.2%)
Median rent asked for vacant for-rent units
$976.09
$1,529
Median monthly housing costs
$1,558
$1,965
Median price asked for vacant for-sale houses and condos
$398,191
$712,577
Estimated median house or condo value
$449,600
$577,900
Median numbers of rooms
5
5.9
Median number of rooms in apartments
4.1
4.7
Median number of rooms in houses and condos
5.8
6.5
Median house age
44
35
Renting percentage
50.6%
35.7%
Housing density (houses/condos per square mile)
2,168.8
1,397.1
House value disparities
25.5%
19%
Household income disparities
44%
43.9%
Median household income for houses/condes with a mortgage
$109,432
$107,461
Median household income for apartments without a mortgage
$82,443
$92,327
Housing units without a mortgage
1,166 (1.6%)
474 (2.5%)
Housing units with both a second mortgage and home equity loan
4,385 (6.1%)
1,540 (8%)
Housing units with a mortgage
70,415 (98.4%)
18,703 (97.5%)
Housing units with a home equity loan
204 (0.3%)
37 (0.2%)
Housing units with a second mortgage
5,362 (7.5%)
1,716 (8.9%)
House/condo owner moved in on average (years ago)
10
11
House/condo renter moved in on average (years ago)
3
4
Housing units lacking complete kitchen facilities
1.2%
0.6%
Housing units lacking complete plumbing facilities
0.3%
0.7%
Housing units in structures
Housing units in structures
Sacramento
Antioch
One, detached
61.7%
76.8%
One, attached
6.8%
7.8%
Two
1.8%
0.0%
3 or 4
4.8%
1.8%
5 to 9
6.9%
4.0%
10 to 19
4.9%
1.1%
20 to 49
3.5%
1.8%
50 or more
7.6%
5.8%
Mobile homes
1.9%
1.0%
Median real estate property taxes paid for housing units
Self-employed workers in own not incorporated business
12,891
2,484
State government workers
40,274
936
Unpaid family workers
755
660
Industries and Occupations
Sacramento's foremost industries include government, technology, healthcare, and tourism. In Antioch, the main industries are healthcare, construction, and retail. These highlight potential job opportunities and areas for business expansion in either city.
Both cities offer a range of healthcare options. Sacramento is home to renowned UC Davis Medical Center while Antioch hosts the Sutter Delta Medical Center. Quality healthcare services in both cities are accessible to residents and visitors alike.
Health (county statistics)
Type
Sacramento
Antioch
General health status score of residents in this county from 1 (poor) to 5 (excellent)
From an infrastructural standpoint, Sacramento has more to offer due to its urban nature. Public buildings, roadways, parks, and bridges are plentiful. Meanwhile, Antioch's infrastructure favors suburban living with a stronger focus on residential areas.
Infrastructure
Type
Sacramento
Antioch
Hospitals
17
10
TV stations
23
23
Bank branches located here
127
15
Bank institutions located here
31
8
Drinking water stations with no reported violations in the past
26
4
Drinking water stations with reported violations in the past
HMDA - Conventional home purchase loans - Applications denied
Year
Sacramento
Antioch
1999
1,003
346
2000
1,155
562
2001
983
570
2002
1,197
560
2003
2,258
612
2004
3,872
970
2005
4,610
1,266
2006
4,276
1,422
2007
2,386
772
2008
1,381
448
2009
647
187
Culture and Food
Both cities offer diverse cultures. Sacramento's larger population provides a wider array of cultural events, museums, and eateries. Yet, Antioch's location in the Bay Area allows for easy access to a diverse range of cultural experiences and cuisines.
Sports Teams
Sacramento is home to the NBA's Sacramento Kings while Antioch does not host any major sports teams. However, Antioch's proximity to San Francisco allows residents and visitors to support the city's professional NFL, MLB, and NBA teams.


 Sacramento, CA
 Antioch, CA