Riverside and Ontario are two vibrant cities located in the Southern California area. While they share many similar characteristics due to geographic proximity, they also possess individual features that set them apart. Both cities continue to draw families, professionals, and tourists alike with their diverse offerings. The subsequent comparison aims to provide detailed insights into essential aspects such as their crime and safety rates, weather patterns, cost of living, educational institutions, economies, and more, thereby aiding those considering relocation or planning a visit.
Distance between
Riverside, CA and
Ontario, CA : 15.1 miles
Riverside's population is larger by 78%. Its population has grown by 62,095 people (24.3%) since 2000. The population of Ontario has grown by 19,956 people (12.6%) during that time.
Riverside's crime rate is slightly higher than the US average. However, the city has been actively implementing several community-security programs to combat this. While not entirely crime-free, Ontario maintains a similar crime rate which appears lower than the national average. Residents in both areas appreciate responsive law enforcement agencies. For visitors, taking precautions customary to metropolitan areas would be advisable when exploring these cities.
City-data.com crime index counts serious crimes and violent crime more heavily. It adjusts for the number of visitors and daily workers commuting into cities. (higher means more crime, U.S. average = 301.1)
City-data.com crime index counts serious crimes and violent crime more heavily. It adjusts for the number of visitors and daily workers commuting into cities. (higher means more crime, U.S. average = 301.1)
Sex Offenders
According to our data, there are 648 registered sex offenders living in Riverside and 217 registered sex offenders living in . The ratio of residents to sex offenders in Riverside is 501 to 1; the ratio in Ontario is 798 to 1. The number of registered sex offenders compared to the number of residents is larger in Riverside than in Ontario.
Cost of Living
The cost of living in Riverside is slightly higher than in Ontario. This difference is particularly noticeable in housing costs. Other expenses like groceries, utilities, transportation, and health care are comparatively equal in both cities. It’s important for potential residents to weigh these factors against their income and lifestyle preferences.
Income Tax
California has a progressive income tax system. Both Riverside and Ontario residents pay the same state income tax, which scales based on income level.
Property Tax
Riverside and Ontario have roughly the same median property tax rates. Since Riverside has higher average house prices, homeowners here may end up paying more.
Sales Tax
The combined sales tax rate for Riverside and Ontario is currently 8.75%, due to California's base rate combined with the county rate. This applies to purchases of goods and services made within both cities.
Income
Type
Riverside
Ontario
Estimated median household income
$76,558
$73,872
Estimated per capita income
$29,013
$28,662
Cost of living index (U.S. average is 100)
83
84.1
If you make $50,000 in Riverside, you will have to make $50,663 in Ontario to maintain the same standard of living.
Geographical Conditions
Riverside is laureled by scenic hills and conveniently placed along the Santa Ana River. Ontario, in contrast, is primarily flat featuring rich agricultural land that once made it a major center for citrus production.
Both Riverside and Ontario offer quality education through their public school systems and higher education institutions. Riverside is home to the prestigious University of California, Riverside, and Riverside Community College. Ontario boasts Chaffey College, and a University of La Verne campus.
Riverside's economy is centered around education, health services, retail trade, and manufacturing while Ontario's primary industries are logistics, health care, retail, and manufacturing. Both cities have experienced consistent job growth.
Biggest Employers
The largest employers in Riverside include the County of Riverside, University of California Riverside, and Kaiser Permanente. In Ontario, top employers are Ontario International Airport, UPS, and Kaiser Permanente Ontario Medical Center.
There were 293 building permits issued in Riverside in 2012 (250 more than in 2011) compared to 738 building permits issued in Ontario in 2012 (702 more than in 2011).
In Riverside (Riverside County), 49.6% voted for Democrats and 48.0% for Republicans in 2012 Presidential Election. In Ontario (San Bernardino County), 52.3% voted for Democrats and 45.0% for Republicans.
Elections
Type
Democrats
Republicans
Other
Year
Riverside
Ontario
Riverside
Ontario
Riverside
Ontario
2020
53.0%
54.2%
45.0%
43.6%
2.0%
2.2%
2016
49.7%
52.1%
44.4%
41.5%
5.9%
6.4%
2012
49.6%
52.3%
48.0%
45.0%
2.4%
2.6%
2008
50.4%
52.2%
48.1%
45.8%
1.5%
2.0%
2004
41.3%
43.8%
58.2%
55.6%
0.6%
0.6%
2000
45.0%
47.3%
51.6%
48.8%
3.4%
3.9%
1996
43.0%
44.4%
45.6%
43.6%
11.3%
12.1%
Breakdown of population affiliated with a religious congregation
Type
Adherents
Congregations
Religion
Riverside
Ontario
Riverside
Ontario
CATHOLIC CHURCH
27.5%
21.9%
4.5%
4.3%
SOUTHERN BAPTIST CONVENTION
1.2%
2.2%
11.2%
9.6%
SEVENTH DAY ADVENTIST CHURCH
0.9%
1.6%
3.4%
4.6%
MUSLIM ESTIMATE
0.5%
0.6%
0.7%
1.1%
Weather
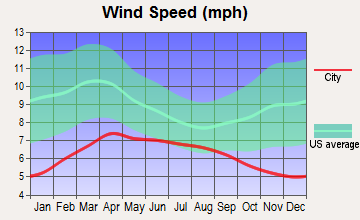
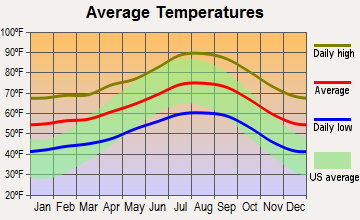
Both cities boast typical Southern California weather—warm, dry summers and mild winters. Riverside experiences higher average temperatures than Ontario as it's more inland. Ontario enjoys cooler summer nights and occasionally experiences coastal fog due to its location. Both cities receive minimal rainfall annually, which appeals to those who prefer sunnier climates.
Weather and climate
Type
Riverside
Ontario
Temperature - Average
66°F
64.1°F
Humidity - Average morning or afternoon humidity
66.7%
65.5%
Humidity - Differences between morning and afternoon humidity
21.4%
20.4%
Humidity - Maximum monthly morning or afternoon humidity
73.5%
71.9%
Humidity - Minimum monthly morning or afternoon humidity
52.1%
51.5%
Precipitation - Yearly average
10.3 in
18.4 in
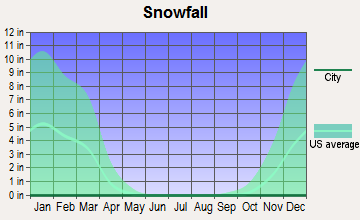
Snowfall - Yearly average
0 in
0 in
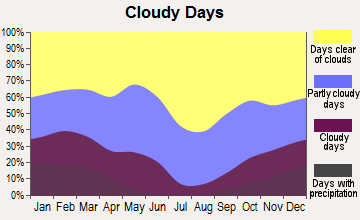
Clouds - Number of days clear of clouds
27.3%
27.6%
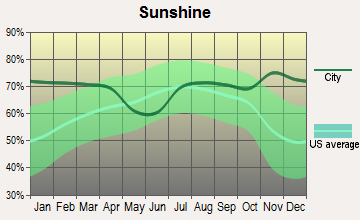
Sunshine amount - Average
78.2%
78.4%
Sunshine amount - Differences during a year
21.5%
21.9%
Sunshine amount - Maximum monthly
84.2%
84.8%
Sunshine amount - Minimum monthly
62.6%
62.9%
Wind speed - Average
4.5 mph
4 mph
Average climate in Riverside, California
Average climate in Ontario, California
Air pollution
Type
AQI
CO
NO2
OZONE
PB
PM10
PM25
SO2
Year
Riverside
Ontario
Riverside
Ontario
Riverside
Ontario
Riverside
Ontario
Riverside
Ontario
Riverside
Ontario
Riverside
Ontario
Riverside
Ontario
2018
153
152
0.35
0.37
14.4
15.4
29.8
28.3
0.006
0.006
44.6
35.4
13.6
15.2
0.4
0.4
2017
151
153
0.34
0.43
14.7
15.9
31.5
31.2
0.004
0.005
48.4
35.5
14.8
16.4
0.3
0.2
2016
140
140
0.33
0.39
14.8
16.6
30.9
31.1
0.006
0.006
44.4
29.5
14.5
16.7
0.2
0.3
2015
147
148
0.33
0.37
14.5
16.3
30.8
30.7
0.004
0.005
43.6
31.1
15.4
16.0
0.3
0.3
2014
147
145
0.37
0.36
15.9
17.2
30.7
29.1
0.006
0.006
34.1
33.4
16.5
17.4
0.3
0.3
2013
147
145
0.38
0.34
16.4
18.4
29.2
27.0
0.006
0.006
33.2
33.9
16.4
16.2
0.2
0.4
2012
148
148
0.35
0.39
16.4
19.2
30.2
27.7
0.007
0.006
32.3
34.3
16.0
18.2
0.3
0.5
2011
150
147
0.37
0.39
16.3
19.6
32.0
26.5
0.006
0.007
33.1
32.5
15.2
20.5
0.3
0.5
2010
144
143
0.42
0.41
17.8
20.2
30.9
27.8
0.008
0.008
31.9
29.8
15.5
18.7
1.3
1.1
2009
151
153
0.37
0.39
20.0
22.5
29.0
27.4
0.009
0.008
38.0
27.7
19.6
19.3
1.5
1.1
2008
157
161
0.41
0.45
20.5
22.9
30.0
27.8
0.010
0.009
43.6
31.3
16.3
18.3
0.9
1.4
2007
135
137
0.65
0.55
20.8
26.6
28.3
25.7
0.011
0.011
N/A
N/A
N/A
N/A
1.6
1.7
2006
129
127
0.58
0.61
21.0
29.1
28.0
25.3
0.005
0.007
N/A
N/A
N/A
N/A
1.4
1.7
2005
134
133
0.53
0.64
22.8
29.7
27.3
22.3
0.012
0.012
N/A
N/A
N/A
N/A
3.3
2.5
2004
142
142
0.72
0.70
18.5
29.0
29.5
22.9
0.013
0.012
N/A
N/A
N/A
N/A
3.1
1.7
2003
144
141
0.75
0.55
22.7
32.8
28.5
22.3
0.013
0.019
N/A
N/A
N/A
N/A
2.0
1.2
2002
142
136
0.82
0.48
24.9
34.7
28.5
22.1
0.015
0.018
N/A
N/A
N/A
N/A
0.2
0.9
2001
145
145
0.79
1.00
25.7
35.6
26.1
21.0
0.025
0.034
N/A
N/A
N/A
N/A
0.9
1.2
2000
157
153
0.82
1.05
24.2
37.0
25.0
21.1
0.031
0.038
N/A
N/A
N/A
N/A
1.2
1.8
Natural disasters
Type
Riverside
Ontario
Tornado activity compared to U.S. average
17.4%
18.1%
Earthquake activity compared to U.S. average
7,322.6%
7,358.4%
Natural disasters compared to U.S. average
46%
46%
Transportation
Both Riverside and Ontario provide various public transit options, including buses, and Metrolink train service. Ontario boasts the Ontario International Airport, providing convenient air travel options.
Transport
Type
Riverside
Ontario
Amtrak stations
1
1
Amtrak stations nearby
3
3
FAA registered aircraft
307
56
FAA registered aircraft manufacturers and dealers
15
4
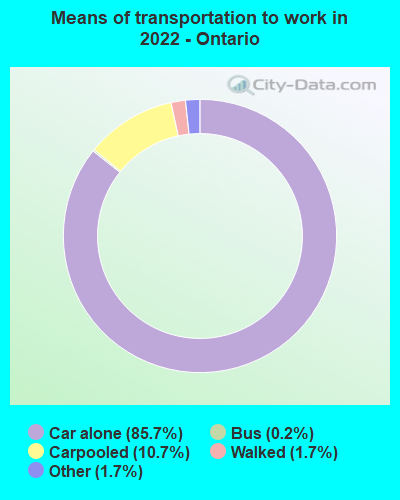
Means of transportation to work
Type
Riverside
Ontario
Bicycle
0.5%
0.1%
Bus
0.9%
0.8%
Carpooled
9%
12.4%
Car alone
85.7%
84.9%
Motorcycle
0.3%
0.1%
Railroad
0.4%
0.6%
Streetcar
0%
0.1%
Walked
2.3%
0.8%
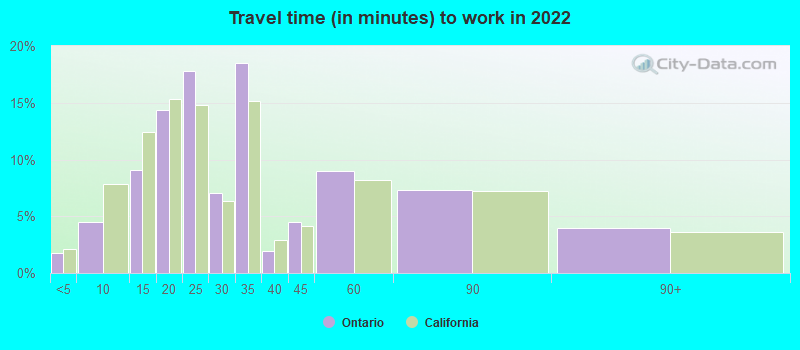
Average travel time to work
Type
Riverside
Ontario
Average
31.3 min
33.4 min
Other means
28.7 min
29.8 min
Public transportation
45.3 min
56 min
Private vehicle occupancy
Type
Riverside
Ontario
Average
1.1
1.2
Drove alone
89.1%
87.5%
In 2 person carpool
8.4%
8.8%
In 3 person carpool
2%
2.5%
In 4 person carpool
0.2%
0.8%
In 5-6 person carpool
0.2%
0.4%
In 7+ person carpool
0.1%
0.1%
How many people usually rode to work in the car, truck or van.
Real Estate
Riverside's real estate market is quite competitive with values exceeding those in Ontario. Housing in Ontario is more affordable, making it attractive to potential homeowners desiring more house for their money.
Neighborhoods
Both Riverside and Ontario showcase a variety of neighborhoods that cater to diverse lifestyles. Riverside neighborhoods such as Wood Streets and Victoria offer historical charm, whereas Arlington and Orangecrest provide modern suburban living. Ontario is known for historic neighborhoods like Armsley Square and College Park, and newly developed areas like New Model Colony.
Houses and residents
Type
Riverside
Ontario
Houses
94,246
57,356
Average household size (people)
3.2
3.6
Median year apartment built
1982
1981
Median year house/condo built
1974
1978
Length of stay in the house since moving in
14.2 years
14.1 years
Houses occupied
91,110 (96.7%)
55,819 (97.3%)
Houses occupied by owners
51,211 (56.2%)
32,424 (58.1%)
Houses occupied by renters
39,899 (43.8%)
23,395 (41.9%)
Median rent asked for vacant for-rent units
$1,277
$1,608
Median monthly housing costs
$1,680
$1,803
Median price asked for vacant for-sale houses and condos
$414,585
$368,754
Estimated median house or condo value
$483,300
$545,200
Median numbers of rooms
5.2
5
Median number of rooms in apartments
3.9
4.2
Median number of rooms in houses and condos
6.1
5.8
Median house price - detached houses
$548,362
$498,726
Median house price - in 2-unit structures
$525,372
Over $1,000,000
Median house price - in 3-to-4-unit structures
$450,463
$442,872
Median house price - in 5 or more unit structures
$408,213
$415,138
Median house price - mobile homes
$81,780
$49,867
Median house price - Townhouses or other attached units
$442,670
$391,450
Median house price - All housing units
$529,360
$490,823
Median house age
44
42
Renting percentage
44.3%
44.7%
Housing density (houses/condos per square mile)
1,206.8
1,152.1
House value disparities
21%
21.6%
Household income disparities
40.5%
41.4%
Median household income for houses/condes with a mortgage
$104,161
$104,195
Median household income for apartments without a mortgage
$71,925
$71,637
Housing units without a mortgage
393 (1%)
312 (1.3%)
Housing units with both a second mortgage and home equity loan
1,312 (3.3%)
875 (3.5%)
Housing units with a mortgage
39,744 (99%)
24,570 (98.7%)
Housing units with a home equity loan
123 (0.3%)
245 (1%)
Housing units with a second mortgage
2,112 (5.3%)
1,316 (5.3%)
House/condo owner moved in on average (years ago)
13
11
House/condo renter moved in on average (years ago)
3
4
Housing units lacking complete kitchen facilities
2.5%
2%
Housing units lacking complete plumbing facilities
0.4%
0.5%
Housing units in structures
Housing units in structures
Riverside
Ontario
One, detached
63.1%
58.7%
One, attached
5.6%
8.0%
Two
1.1%
2.6%
3 or 4
3.7%
6.9%
5 to 9
6.8%
4.4%
10 to 19
7.0%
2.9%
20 to 49
4.6%
3.4%
50 or more
6.4%
9.4%
Mobile homes
1.8%
3.8%
Median real estate property taxes paid for housing units
Self-employed workers in own not incorporated business
8,164
5,269
State government workers
8,293
3,109
Unpaid family workers
199
0
Industries and Occupations
Riverside's top industries include educational services, healthcare, and retail trade. In Ontario, logistics, healthcare, and retail are the primary industries. Both cities employ a significant number of office and administrative support workers, sales workers, and managers.
Riverside and Ontario offer quality health services with numerous hospitals and urgent care centers. Both cities are home to Kaiser Permanente facilities, some of the most recognized healthcare providers in the region.
Health (county statistics)
Type
Riverside
Ontario
General health status score of residents in this county from 1 (poor) to 5 (excellent)
Riverside boasts historic and modern infrastructure which includes restored buildings, modern shopping centers, and state-of-the-art healthcare facilities. Ontario has seen significant residential and commercial development, with plans for more infrastructural improvements in the future.
Infrastructure
Type
Riverside
Ontario
Hospitals
20
4
TV stations
5
10
Bank branches located here
61
27
Bank institutions located here
18
18
Main business address for public companies
2
2
Drinking water stations with no reported violations in the past
HMDA - Conventional home purchase loans - Applications denied
Year
Riverside
Ontario
1999
794
451
2000
375
561
2001
310
505
2002
405
503
2003
1,399
827
2004
1,892
1,083
2005
2,728
1,584
2006
3,235
1,557
2007
1,568
969
2008
544
327
2009
285
169
Culture and Food
Riverside emanates a robust cultural scene with numerous museums, art galleries, and diverse culinary options. Ontario also boasts a vibrant cultural backdrop and a rich culinary scene, characterized by a fusion of cultures.
Sports Teams
While there are no major sports teams based in either city, fans can enjoy short trips to nearby Los Angeles to watch professional basketball, baseball, or hockey games. Riverside and Ontario have amateur sports teams and athletics events that enjoy local support.


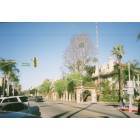
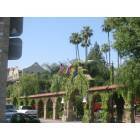

 Riverside, CA
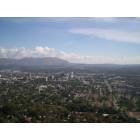
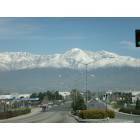
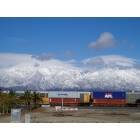
 Ontario, CA