Riverside and Fontana are two prominent cities within California delivering diverse experiences for both residents and tourists alike. Riverside, renowned for its vibrant arts scene, rich history, and picturesque landscapes contrasts with Fontana, noted for its sport-centric culture and economically-driven way of life. Each city has distinct advantages and potential challenges based upon aspects such as crime safety, cost of living, weather, education, and more. This comprehensive comparison aims to provide an in-depth guide for those considering relocation or a visit to either city.
Distance between
Riverside, CA and
Fontana, CA : 10.9 miles
Riverside's population is larger by 51%. Its population has grown by 62,095 people (24.3%) since 2000. The population of Fontana has grown by 81,832 people (63.5%) during that time.
Robust public safety measures are in place in both Riverside and Fontana. According to the FBI, Fontana has a lower crime rate compared to Riverside. However, both cities are investing heavily in community policing efforts and education to improve overall safety. Riverside has a Police Department Community Services Bureau that focuses on community engagement to prevent crime. It's crucial to note that safety can vary by neighborhood, so potential residents should research specific areas.
City-data.com crime index counts serious crimes and violent crime more heavily. It adjusts for the number of visitors and daily workers commuting into cities. (higher means more crime, U.S. average = 301.1)
City-data.com crime index counts serious crimes and violent crime more heavily. It adjusts for the number of visitors and daily workers commuting into cities. (higher means more crime, U.S. average = 301.1)
Sex Offenders
According to our data, there are 648 registered sex offenders living in Riverside and 273 registered sex offenders living in . The ratio of residents to sex offenders in Riverside is 501 to 1; the ratio in Fontana is 768 to 1. The number of registered sex offenders compared to the number of residents is larger in Riverside than in Fontana.
Cost of Living
The cost of living in Riverside is slightly higher than in Fontana. Things like groceries, health, and transportation might cost somewhat more in Riverside. Housing, however, is the major contributor to the cost of living difference. This consideration is crucial for potential residents deciding between these two cities while planning their finances.
Income Tax
As cities in California, Riverside and Fontana residents are subject to the same progressive state income tax system. This means the income tax rate varies from 1% to 13.3% based on income level.
Property Tax
Both Riverside and Fontana have similar property tax rates hovering around 1% of the total assessed value. Property taxes contribute to funding for essential local services like schools, police and fire departments.
Sales Tax
The total sales tax rate in both Riverside and Fontana is 7.75%, which aligns with the average sales tax rate for cities in California.
Income
Type
Riverside
Fontana
Estimated median household income
$76,558
$93,851
Estimated per capita income
$29,013
$28,677
Cost of living index (U.S. average is 100)
83
82.5
If you make $50,000 in Fontana, you will have to make $50,303 in Riverside to maintain the same standard of living.
Geographical Conditions
Riverside is set against the backdrop of the Box Springs Mountain, providing beautiful views and outdoor recreational opportunities. Fontana is located in a flat valley and being closer to the desert can experience hotter temperatures.
Riverside is home to several higher learning institutions, including the University of California, Riverside, which consistently ranks among the top public universities in the nation. Fontana, on the other hand, offers solid K-12 schooling options with an emphasis on vocational training. Both cities prioritise education, making either an excellent choice for families with school-aged children or adults seeking further education.
Both cities have robust economies but with different focal sectors. Riverside is recognized for its strong education and healthcare sectors, while Fontana's economy is propelled by transportation and logistics due to its proximity to interstate highways and international airports. The economies of both cities have steadily been growing, providing plenty of job opportunities.
Biggest Employers
In Riverside, the biggest employers are in the education and healthcare sectors. These include the University of California, Riverside, and the Riverside Community Hospital. Fontana, however, profits from the retail sector with companies like Home Depot and Auto Club Speedway being the city's largest employers.
There were 293 building permits issued in Riverside in 2012 (250 more than in 2011) compared to 652 building permits issued in Fontana in 2012 (516 more than in 2011).
In Riverside (Riverside County), 49.6% voted for Democrats and 48.0% for Republicans in 2012 Presidential Election. In Fontana (San Bernardino County), 52.3% voted for Democrats and 45.0% for Republicans.
Elections
Type
Democrats
Republicans
Other
Year
Riverside
Fontana
Riverside
Fontana
Riverside
Fontana
2020
53.0%
54.2%
45.0%
43.6%
2.0%
2.2%
2016
49.7%
52.1%
44.4%
41.5%
5.9%
6.4%
2012
49.6%
52.3%
48.0%
45.0%
2.4%
2.6%
2008
50.4%
52.2%
48.1%
45.8%
1.5%
2.0%
2004
41.3%
43.8%
58.2%
55.6%
0.6%
0.6%
2000
45.0%
47.3%
51.6%
48.8%
3.4%
3.9%
1996
43.0%
44.4%
45.6%
43.6%
11.3%
12.1%
Breakdown of population affiliated with a religious congregation
Type
Adherents
Congregations
Religion
Riverside
Fontana
Riverside
Fontana
CATHOLIC CHURCH
27.5%
21.9%
4.5%
4.3%
SOUTHERN BAPTIST CONVENTION
1.2%
2.2%
11.2%
9.6%
SEVENTH DAY ADVENTIST CHURCH
0.9%
1.6%
3.4%
4.6%
MUSLIM ESTIMATE
0.5%
0.6%
0.7%
1.1%
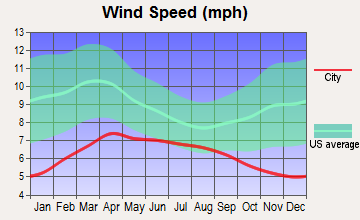
Weather
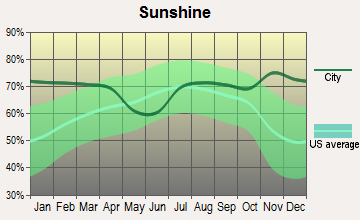
Riverside boasts more days of sunshine a year compared to Fontana, making it a great option for those who enjoy outdoor activities year-round. Both cities, however, enjoy a Mediterranean climate with mild, wet winters and hot, dry summers. Temperatures can rise significantly in the summer months reaching over 100°F, but evenings are generally cooler, providing relief.
Weather and climate
Type
Riverside
Fontana
Temperature - Average
66°F
65.6°F
Humidity - Average morning or afternoon humidity
66.7%
65.7%
Humidity - Differences between morning and afternoon humidity
21.4%
20.4%
Humidity - Maximum monthly morning or afternoon humidity
73.5%
72%
Humidity - Minimum monthly morning or afternoon humidity
52.1%
51.6%
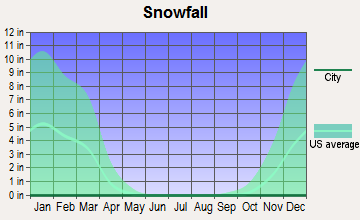
Precipitation - Yearly average
10.3 in
22.6 in
Snowfall - Yearly average
0 in
0 in
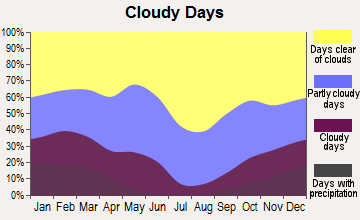
Clouds - Number of days clear of clouds
27.3%
27.5%
Sunshine amount - Average
78.2%
78.3%
Sunshine amount - Differences during a year
21.5%
21.7%
Sunshine amount - Maximum monthly
84.2%
84.5%
Sunshine amount - Minimum monthly
62.6%
62.8%
Wind speed - Average
4.5 mph
4.1 mph
Average climate in Riverside, California
Average climate in Fontana, California
Air pollution
Type
AQI
CO
NO2
OZONE
PB
PM10
PM25
SO2
Year
Riverside
Fontana
Riverside
Fontana
Riverside
Fontana
Riverside
Fontana
Riverside
Fontana
Riverside
Fontana
Riverside
Fontana
Riverside
Fontana
2018
153
153
0.35
0.32
14.4
18.3
29.8
30.5
0.006
0.006
44.6
40.7
13.6
14.0
0.4
0.4
2017
151
152
0.34
0.33
14.7
18.3
31.5
32.4
0.004
0.004
48.4
43.5
14.8
15.1
0.3
0.2
2016
140
140
0.33
0.20
14.8
18.2
30.9
31.8
0.006
0.006
44.4
39.6
14.5
14.8
0.2
0.4
2015
147
148
0.33
0.17
14.5
18.7
30.8
31.5
0.004
0.004
43.6
39.2
15.4
15.7
0.3
0.3
2014
147
149
0.37
0.16
15.9
19.9
30.7
31.1
0.006
0.006
34.1
41.8
16.5
16.7
0.3
0.3
2013
147
148
0.38
0.26
16.4
20.6
29.2
29.5
0.006
0.006
33.2
41.0
16.4
15.7
0.2
0.5
2012
148
148
0.35
0.26
16.4
22.1
30.2
30.6
0.007
0.007
32.3
40.4
16.0
17.3
0.3
0.6
2011
150
150
0.37
0.32
16.3
21.1
32.0
30.9
0.006
0.006
33.1
37.7
15.2
19.3
0.3
0.6
2010
144
147
0.42
0.32
17.8
23.2
30.9
30.4
0.008
0.008
31.9
33.3
15.5
18.1
1.3
1.0
2009
151
153
0.37
0.37
20.0
23.7
29.0
29.2
0.009
0.009
38.0
34.9
19.6
19.2
1.5
0.9
2008
157
163
0.41
0.44
20.5
20.4
30.0
29.7
0.010
0.010
43.6
39.3
16.3
19.0
0.9
1.6
2007
135
136
0.65
0.60
20.8
23.4
28.3
28.2
0.011
0.012
N/A
N/A
N/A
N/A
1.6
1.8
2006
129
126
0.58
0.59
21.0
27.0
28.0
27.7
0.005
0.007
N/A
N/A
N/A
N/A
1.4
1.9
2005
134
134
0.53
0.59
22.8
30.7
27.3
26.5
0.012
0.012
N/A
N/A
N/A
N/A
3.3
2.1
2004
142
143
0.72
0.71
18.5
27.0
29.5
28.1
0.013
0.013
N/A
N/A
N/A
N/A
3.1
1.0
2003
144
143
0.75
0.73
22.7
30.1
28.5
27.5
0.013
0.018
N/A
N/A
N/A
N/A
2.0
0.8
2002
142
140
0.82
0.73
24.9
33.3
28.5
27.2
0.015
0.016
N/A
N/A
N/A
N/A
0.2
1.3
2001
145
143
0.79
0.82
25.7
35.5
26.1
25.8
0.025
0.029
N/A
N/A
N/A
N/A
0.9
1.4
2000
157
155
0.82
0.86
24.2
35.7
25.0
24.5
0.031
0.034
N/A
N/A
N/A
N/A
1.2
2.0
Natural disasters
Type
Riverside
Fontana
Tornado activity compared to U.S. average
17.4%
17.1%
Earthquake activity compared to U.S. average
7,322.6%
7,438.3%
Natural disasters compared to U.S. average
46%
46%
Transportation
Both Riverside and Fontana have numerous public transportation options. Riverside's bus service extends even to the outskirts, and it also has a Metrolink train service. Fontana, being closer to Los Angeles, offers convenient commuting options to LA and other major cities, making it a popular choice for daily commuters.
Transport
Type
Riverside
Fontana
Amtrak stations
1
0
Amtrak stations nearby
3
3
FAA registered aircraft
307
36
FAA registered aircraft manufacturers and dealers
15
4
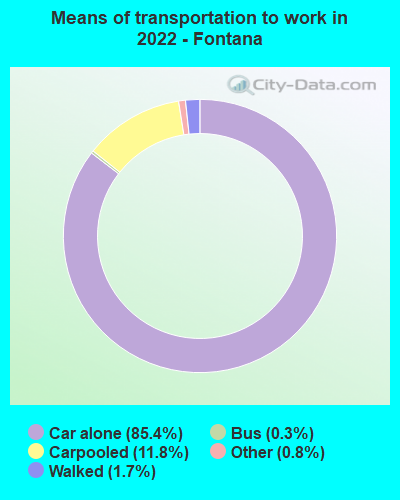
Means of transportation to work
Type
Riverside
Fontana
Bicycle
0.5%
0.2%
Bus
0.9%
0.4%
Carpooled
9%
11.7%
Car alone
85.7%
84.7%
Motorcycle
0.3%
0.1%
Railroad
0.4%
0%
Taxicab
0%
0.1%
Walked
2.3%
1.6%
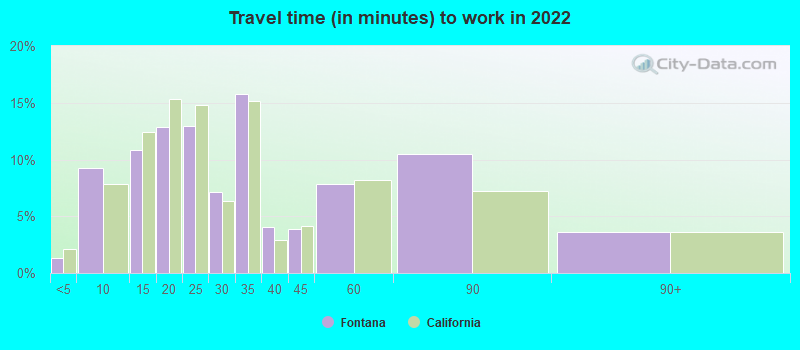
Average travel time to work
Type
Riverside
Fontana
Average
31.3 min
30.3 min
Other means
28.7 min
33.5 min
Public transportation
45.3 min
55.8 min
Private vehicle occupancy
Type
Riverside
Fontana
Average
1.1
1.2
Drove alone
89.1%
86%
In 2 person carpool
8.4%
11.5%
In 3 person carpool
2%
1.5%
In 4 person carpool
0.2%
0.6%
In 5-6 person carpool
0.2%
0.3%
In 7+ person carpool
0.1%
0%
How many people usually rode to work in the car, truck or van.
Real Estate
Riverside's real estate is more expensive than Fontana's, with the median home cost being about $50,000 more. However, Riverside offers a good balance between urban and suburban living. Fontana offers cheaper housing options, making it preferable for people looking for affordable housing.
Neighborhoods
Riverside offers a blend of historical and modern neighborhoods, housing a mix of student populations due to the city's university and families alike. Neighborhoods in Fontana are relatively newer, most of which were developed in the late 20th century. Property prices vary greatly between neighborhoods in both cities.
Houses and residents
Type
Riverside
Fontana
Houses
94,246
58,533
Average household size (people)
3.2
4
Median year apartment built
1982
1983
Median year house/condo built
1974
1994
Length of stay in the house since moving in
14.2 years
12.1 years
Houses occupied
91,110 (96.7%)
57,836 (98.8%)
Houses occupied by owners
51,211 (56.2%)
39,490 (68.3%)
Houses occupied by renters
39,899 (43.8%)
18,346 (31.7%)
Median rent asked for vacant for-rent units
$1,277
$628.91
Median monthly housing costs
$1,680
$1,832
Median price asked for vacant for-sale houses and condos
$414,585
$322,101
Estimated median house or condo value
$483,300
$511,000
Median numbers of rooms
5.2
5.5
Median number of rooms in apartments
3.9
4.3
Median number of rooms in houses and condos
6.1
6
Median house price - detached houses
$548,362
$438,510
Median house price - in 2-unit structures
$525,372
$579,874
Median house price - in 3-to-4-unit structures
$450,463
$426,113
Median house price - in 5 or more unit structures
$408,213
$309,290
Median house price - mobile homes
$81,780
$50,280
Median house price - Townhouses or other attached units
$442,670
$499,707
Median house price - All housing units
$529,360
$431,552
Median house age
44
32
Renting percentage
44.3%
31.1%
Housing density (houses/condos per square mile)
1,206.8
1,620.6
House value disparities
21%
19.3%
Household income disparities
40.5%
36.9%
Median household income for houses/condes with a mortgage
$104,161
$105,783
Median household income for apartments without a mortgage
$71,925
$88,893
Housing units without a mortgage
393 (1%)
356 (1.1%)
Housing units with both a second mortgage and home equity loan
1,312 (3.3%)
846 (2.6%)
Housing units with a mortgage
39,744 (99%)
32,565 (98.9%)
Housing units with a home equity loan
123 (0.3%)
0 (0%)
Housing units with a second mortgage
2,112 (5.3%)
1,037 (3.1%)
House/condo owner moved in on average (years ago)
13
9
House/condo renter moved in on average (years ago)
3
5
Housing units lacking complete kitchen facilities
2.5%
1.1%
Housing units lacking complete plumbing facilities
0.4%
0.6%
Housing units in structures
Housing units in structures
Riverside
Fontana
One, detached
63.1%
78.8%
One, attached
5.6%
3.7%
Two
1.1%
0.1%
3 or 4
3.7%
3.8%
5 to 9
6.8%
1.2%
10 to 19
7.0%
1.4%
20 to 49
4.6%
1.2%
50 or more
6.4%
8.2%
Mobile homes
1.8%
1.7%
Median real estate property taxes paid for housing units
Self-employed workers in own not incorporated business
8,164
4,423
State government workers
8,293
5,298
Unpaid family workers
199
0
Industries and Occupations
While Fontana's economy is heavily reliant on the transportation and logistics industry with occupations centered around logistics, warehouse, and trucking services, Riverside hosts various industries, such as education, healthcare, and agriculture. In both cities, there's a strong commitment to economic diversity which provides job opportunities in multiple sectors.
Riverside excels in healthcare with two major hospitals and a variety of specialized care clinics. In contrast, Fontana has a major Kaiser Permanente hospital but limited specialist clinics, indicating Riverside might better serve those with specific healthcare needs.
Health (county statistics)
Type
Riverside
Fontana
General health status score of residents in this county from 1 (poor) to 5 (excellent)
Riverside's historical influence is apparent in its infrastructure, with many buildings preserved from the late 19th and early 20th centuries. Fontana, being a younger city, boasts a more modern infrastructure suited to businesses and industry. Both cities provide good public services, well-maintained roads, and access to utilities but reflect different historical periods and aesthetics.
HMDA - Conventional home purchase loans - Applications denied
Year
Riverside
Fontana
1999
794
374
2000
375
127
2001
310
121
2002
405
165
2003
1,399
1,211
2004
1,892
1,684
2005
2,728
2,338
2006
3,235
2,779
2007
1,568
1,535
2008
544
555
2009
285
222
Culture and Food
Riverside is known for its cultural diversity and vibrant arts scene, with museums, performing arts theatres, and galleries. It offers a diverse food scene with options reflecting its multicultural population. Fontana, while not as culturally diverse, is known for its sports culture and offers a range of casual dining and fast food options.
Sports Teams
Contrasting with Riverside's focus on the arts, Fontana is home to Auto Club Speedway, a major hub for NASCAR and other racing events. While Riverside doesn't have major league sports teams, it supports intercollegiate sports at the University of California, Riverside.


 Riverside, CA
 Fontana, CA