Both Riverside and Corona, California are vibrant cities that share some similarities but also have their unique characteristics. This comparison will help individuals considering either for relocation or for a sightseeing trip make an informed decision. We focus on important factors ranging from crime and safety, cost of living, education, the economy, to the culture and food scene, among others.
Distance between
Riverside, CA and
Corona, CA : 11.2 miles
Riverside's population is larger by 99%. Its population has grown by 62,095 people (24.3%) since 2000. The population of Corona has grown by 34,777 people (27.8%) during that time.
Riverside and Corona both have safety concerns, common for cities of their size. Riverside has a slightly higher crime rate than the national average, with property crime being more common than violent crime. Corona's crime rate is lower in comparison to Riverside, but still above the national average. It is advisable in both cities to stay informed about the local crime situation and take usual precautions.
City-data.com crime index counts serious crimes and violent crime more heavily. It adjusts for the number of visitors and daily workers commuting into cities. (higher means more crime, U.S. average = 301.1)
City-data.com crime index counts serious crimes and violent crime more heavily. It adjusts for the number of visitors and daily workers commuting into cities. (higher means more crime, U.S. average = 301.1)
Sex Offenders
According to our data, there are 648 registered sex offenders living in Riverside and 149 registered sex offenders living in . The ratio of residents to sex offenders in Riverside is 501 to 1; the ratio in Corona is 1,119 to 1. The number of registered sex offenders compared to the number of residents is larger in Riverside than in Corona.
Cost of Living
Living in Corona tends to be slightly more expensive than in Riverside. Factors contributing to this include higher average housing costs and slightly higher healthcare costs in Corona. However, the cost of living in both cities is still lower than the California state average.
Income Tax
California has a progressive income tax system, with rates ranging from 1% to 13.3%. Therefore, residents of both Corona and Riverside are subject to the same state income tax rates.
Property Tax
Property taxes in both Riverside and Corona are lower than the national average but still higher than in many other states. Riverside has a property tax rate of around 0.78%, while Corona’s rate is slightly higher at 0.79%.
Sales Tax
Sales tax in both Riverside and Corona is high, owing to California's state sales tax rate. Both cities have an 8.75% sales tax rate.
Income
Type
Riverside
Corona
Estimated median household income
$76,558
$92,606
Estimated per capita income
$29,013
$35,675
Cost of living index (U.S. average is 100)
83
83.2
If you make $50,000 in Riverside, you will have to make $50,120 in Corona to maintain the same standard of living.
Geographical Conditions
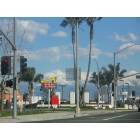
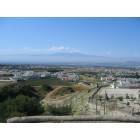
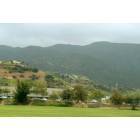
Riverside features a mix of urban and pastoral settings, thanks to its location along the Santa Ana River and near several mountain ranges. Corona, also known as the ‘Circle City’ due to its circular layout, is surrounded by mountains and hills, adding to its picturesque appeal.
Both cities are served by well-respected school systems and are near several reputable colleges and universities. Riverside features a branch of the University of California and is home to Riverside City College, while Corona boasts quality public schools, some of which are recognized as California Distinguished Schools.
Riverside's economy is diverse, with industries like education, health, and government leading the way. Corona's economy, while also diverse, relies more heavily on advanced manufacturing, healthcare, and technology sectors. Unemployment rates in both cities are slightly above the national average.
Biggest Employers
In Riverside, major employers include the County of Riverside, University of California, Riverside, and Riverside Unified School District. Corona, on the other hand, is home to several major employers such as Corona Regional Medical Center, Corona-Norco Unified School District, and All American Asphalt.
There were 293 building permits issued in Riverside in 2012 (250 more than in 2011) compared to 177 building permits issued in Corona in 2012 (122 more than in 2011).
Weather
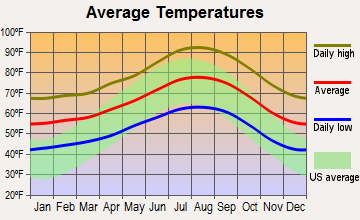
Weather in both Riverside and Corona is generally favorable. Due to their Southern California location, both cities enjoy warmer climates. Summers in both cities can get quite hot, reaching into the 90s, while winters maintain mild temperatures, rarely dipping below 40℉.
Weather and climate
Type
Riverside
Corona
Temperature - Average
66°F
65.5°F
Humidity - Average morning or afternoon humidity
66.7%
67.4%
Humidity - Differences between morning and afternoon humidity
21.4%
22.4%
Humidity - Maximum monthly morning or afternoon humidity
73.5%
74.5%
Humidity - Minimum monthly morning or afternoon humidity
52.1%
52.1%
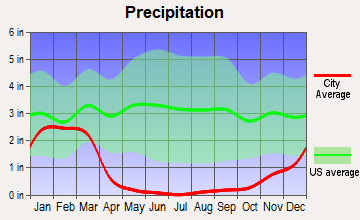
Precipitation - Yearly average
10.3 in
10.6 in
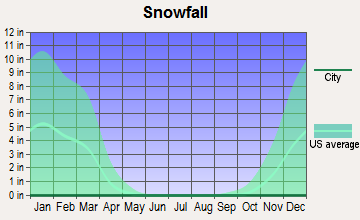
Snowfall - Yearly average
0 in
0 in
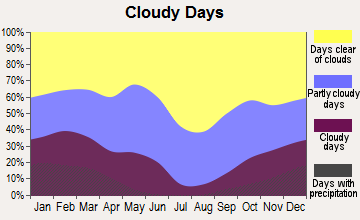
Clouds - Number of days clear of clouds
27.3%
27.2%
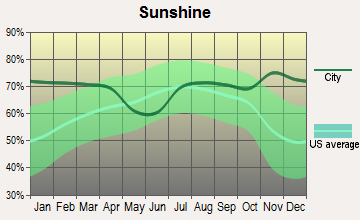
Sunshine amount - Average
78.2%
78.3%
Sunshine amount - Differences during a year
21.5%
21.7%
Sunshine amount - Maximum monthly
84.2%
84.5%
Sunshine amount - Minimum monthly
62.6%
62.8%
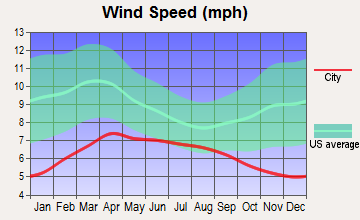
Wind speed - Average
4.5 mph
4.8 mph
Average climate in Riverside, California
Average climate in Corona, California
Air pollution
Type
AQI
CO
NO2
OZONE
PB
PM10
PM25
SO2
Year
Riverside
Corona
Riverside
Corona
Riverside
Corona
Riverside
Corona
Riverside
Corona
Riverside
Corona
Riverside
Corona
Riverside
Corona
2018
153
152
0.35
0.32
14.4
14.3
29.8
29.7
0.006
0.006
44.6
39.7
13.6
13.6
0.4
0.4
2017
151
153
0.34
0.33
14.7
14.4
31.5
31.0
0.004
0.004
48.4
42.6
14.8
14.8
0.3
0.3
2016
140
140
0.33
0.30
14.8
14.6
30.9
30.6
0.006
0.006
44.4
38.3
14.5
14.7
0.2
0.3
2015
147
148
0.33
0.28
14.5
14.6
30.8
30.5
0.004
0.004
43.6
38.0
15.4
15.8
0.3
0.3
2014
147
145
0.37
0.30
15.9
15.3
30.7
29.8
0.006
0.006
34.1
40.3
16.5
16.7
0.3
0.3
2013
147
145
0.38
0.30
16.4
15.8
29.2
28.4
0.006
0.006
33.2
39.3
16.4
15.8
0.2
0.3
2012
148
148
0.35
0.32
16.4
16.3
30.2
28.5
0.007
0.007
32.3
38.1
16.0
17.1
0.3
0.3
2011
150
147
0.37
0.34
16.3
16.8
32.0
29.3
0.006
0.006
33.1
36.8
15.2
18.3
0.3
0.4
2010
144
143
0.42
0.38
17.8
17.5
30.9
29.3
0.008
0.008
31.9
32.8
15.5
17.4
1.3
1.1
2009
151
156
0.37
0.36
20.0
19.1
29.0
28.6
0.009
0.009
38.0
33.5
19.6
18.2
1.5
1.3
2008
157
163
0.41
0.38
20.5
20.0
30.0
29.2
0.010
0.010
43.6
38.5
16.3
16.5
0.9
1.1
2007
135
138
0.65
0.50
20.8
22.1
28.3
27.7
0.011
0.012
N/A
N/A
N/A
N/A
1.6
1.5
2006
129
130
0.58
0.51
21.0
23.1
28.0
27.5
0.005
0.006
N/A
N/A
N/A
N/A
1.4
1.5
2005
134
134
0.53
0.51
22.8
24.2
27.3
26.0
0.012
0.012
N/A
N/A
N/A
N/A
3.3
2.7
2004
142
144
0.72
0.60
18.5
22.9
29.5
28.1
0.013
0.013
N/A
N/A
N/A
N/A
3.1
2.3
2003
144
145
0.75
0.66
22.7
26.4
28.5
26.9
0.013
0.017
N/A
N/A
N/A
N/A
2.0
1.6
2002
142
142
0.82
0.68
24.9
27.4
28.5
26.3
0.015
0.016
N/A
N/A
N/A
N/A
0.2
0.7
2001
145
149
0.79
0.81
25.7
28.7
26.1
25.2
0.025
0.029
N/A
N/A
N/A
N/A
0.9
1.1
2000
157
158
0.82
0.84
24.2
29.5
25.0
23.8
0.031
0.034
N/A
N/A
N/A
N/A
1.2
1.5
Natural disasters
Type
Riverside
Corona
Tornado activity compared to U.S. average
17.4%
18.4%
Earthquake activity compared to U.S. average
7,322.6%
7,200.6%
Natural disasters compared to U.S. average
46%
46%
Transportation
Riverside has a well-established public transportation system supplied by Riverside Transit Agency. Corona also offers public transit operated by the City of Corona's Department of Public Works. Both cities are served by Metrolink commuter rail service, providing access to broader Southern California.
Transport
Type
Riverside
Corona
Amtrak stations
1
0
Amtrak stations nearby
3
3
FAA registered aircraft
307
177
FAA registered aircraft manufacturers and dealers
15
12
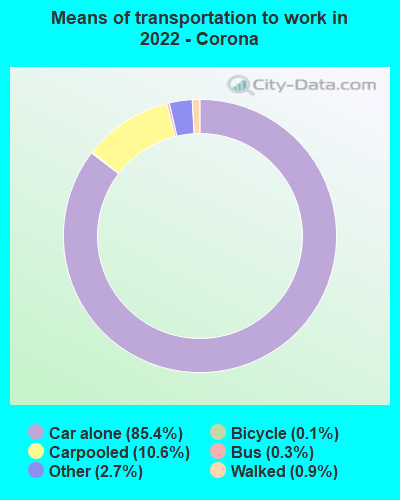
Means of transportation to work
Type
Riverside
Corona
Bicycle
0.5%
0.1%
Bus
0.9%
0.6%
Carpooled
9%
10.5%
Car alone
85.7%
85.1%
Motorcycle
0.3%
0.3%
Railroad
0.4%
0.7%
Walked
2.3%
0.9%
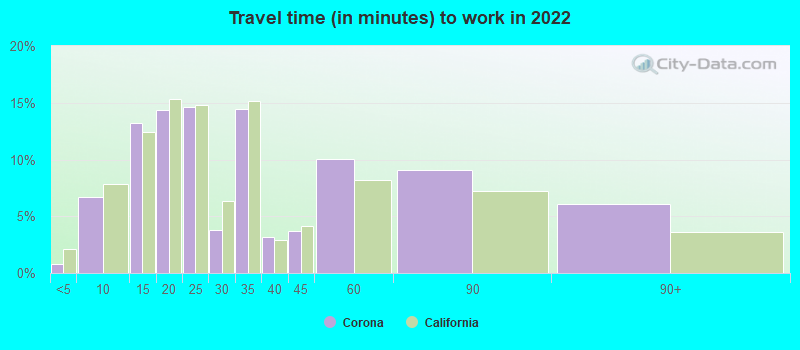
Average travel time to work
Type
Riverside
Corona
Average
31.3 min
32 min
Other means
28.7 min
36.9 min
Public transportation
45.3 min
55.6 min
Private vehicle occupancy
Type
Riverside
Corona
Average
1.1
1.1
Drove alone
89.1%
90.9%
In 2 person carpool
8.4%
6.3%
In 3 person carpool
2%
1.9%
In 4 person carpool
0.2%
0.3%
In 5-6 person carpool
0.2%
0.4%
In 7+ person carpool
0.1%
0.1%
How many people usually rode to work in the car, truck or van.
Real Estate
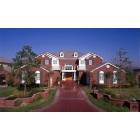
When it comes to real estate, Corona tends to be pricier. The median home price in Corona is significantly higher than in Riverside. Both cities offer a variety of housing options, ranging from apartments to single-family homes.
Neighborhoods
Riverside is known for its historic and diverse neighborhoods, with the Downtown, Arlington, and Orangecrest areas being particularly popular. Corona also boasts a variety of neighborhoods, each with a distinctive character. Sierra Del Oro and Corona Hills are among the most sought-after locations.
Houses and residents
Type
Riverside
Corona
Houses
94,246
50,613
Average household size (people)
3.2
3.4
Median year apartment built
1982
1989
Median year house/condo built
1974
1990
Length of stay in the house since moving in
14.2 years
13.7 years
Houses occupied
91,110 (96.7%)
48,905 (96.6%)
Houses occupied by owners
51,211 (56.2%)
30,461 (62.3%)
Houses occupied by renters
39,899 (43.8%)
18,444 (37.7%)
Median rent asked for vacant for-rent units
$1,277
$608.14
Median monthly housing costs
$1,680
$1,918
Median price asked for vacant for-sale houses and condos
$414,585
$479,674
Estimated median house or condo value
$483,300
$620,600
Median numbers of rooms
5.2
6
Median number of rooms in apartments
3.9
4.1
Median number of rooms in houses and condos
6.1
6.9
Median house price - detached houses
$548,362
$667,347
Median house price - in 2-unit structures
$525,372
$310,376
Median house price - in 3-to-4-unit structures
$450,463
$293,658
Median house price - in 5 or more unit structures
$408,213
$279,322
Median house price - mobile homes
$81,780
$146,143
Median house price - Townhouses or other attached units
$442,670
$451,067
Median house price - All housing units
$529,360
$623,919
Median house age
44
31
Renting percentage
44.3%
32.8%
Housing density (houses/condos per square mile)
1,206.8
1,440
House value disparities
21%
19.4%
Household income disparities
40.5%
39.1%
Median household income for houses/condes with a mortgage
$104,161
$118,249
Median household income for apartments without a mortgage
$71,925
$91,037
Housing units without a mortgage
393 (1%)
252 (1.1%)
Housing units with both a second mortgage and home equity loan
1,312 (3.3%)
1,280 (5.5%)
Housing units with a mortgage
39,744 (99%)
23,204 (98.9%)
Housing units with a home equity loan
123 (0.3%)
0 (0%)
Housing units with a second mortgage
2,112 (5.3%)
1,808 (7.7%)
House/condo owner moved in on average (years ago)
13
12
House/condo renter moved in on average (years ago)
3
4
Housing units lacking complete kitchen facilities
2.5%
1.6%
Housing units lacking complete plumbing facilities
0.4%
0.4%
Housing units in structures
Housing units in structures
Riverside
Corona
One, detached
63.1%
67.4%
One, attached
5.6%
5.6%
Two
1.1%
0.7%
3 or 4
3.7%
4.8%
5 to 9
6.8%
6.0%
10 to 19
7.0%
4.9%
20 to 49
4.6%
2.1%
50 or more
6.4%
5.2%
Mobile homes
1.8%
3.3%
Median real estate property taxes paid for housing units
Self-employed workers in own not incorporated business
8,164
5,276
State government workers
8,293
1,082
Unpaid family workers
199
0
Industries and Occupations
Riverside's largest industries include education, healthcare, and retail, while Corona's economy leans more towards manufacturing, healthcare, and retail. Both cities offer a wide range of job opportunities, however, Corona has a slightly higher median income.
Health diagnosing and treating practitioners and other technical occupations
5.1%
4.7%
Production occupations
4.7%
4.1%
Business and financial operations occupations
4.1%
7.6%
Community and social service occupations
3.5%
2.2%
Building and grounds cleaning and maintenance occupations
3.1%
4.1%
Personal care and service occupations
2.6%
2.4%
Health technologists and technicians
2.3%
2.3%
Arts, design, entertainment, sports, and media occupations
1.9%
1.3%
Life, physical, and social science occupations
1.2%
0.7%
Transportation occupations
0.9%
1.1%
Health Care
Both Riverside and Corona offer high-quality healthcare services. Riverside is home to several large hospitals, including Riverside Community Hospital and Kaiser Permanente Riverside Medical Center. Corona also has top-rated healthcare facilities like Corona Regional Medical Center.
Riverside’s city layout allows for a smooth traffic flow, resulting in a relatively low congestion level. Corona also has a well-developed infrastructure, but its geographical location means it receives heavy traffic, especially during peak hours. Both cities have ongoing infrastructure development projects to further enhance their urban landscape.
Infrastructure
Type
Riverside
Corona
Hospitals
20
5
TV stations
5
4
Bank branches located here
61
41
Bank institutions located here
18
17
Main business address for public companies
2
2
Drinking water stations with no reported violations in the past
2
1
Drinking water stations with reported violations in the past
HMDA - Conventional home purchase loans - Applications denied
Year
Riverside
Corona
1999
794
549
2000
375
33
2001
310
78
2002
405
82
2003
1,399
943
2004
1,892
1,378
2005
2,728
1,900
2006
3,235
2,272
2007
1,568
1,270
2008
544
567
2009
285
242
Culture and Food
Both Riverside and Corona have a rich cultural scene. Riverside is home to several museums, theatres, and hosts the renowned Riverside International Film Festival. Corona also has a thriving cultural scene with diverse culinary offerings, from traditional Mexican cuisine to Asian fusion.
Sports Teams
While neither Riverside nor Corona hosts any major league sports teams, both cities are within an hour's drive of all that LA's vibrant professional sports scene has to offer, including teams like the Lakers, Dodgers, Rams, Kings, and Clippers.


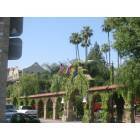
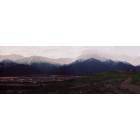
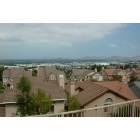
 Riverside, CA
 Corona, CA