Queens, New York, and San Antonio, Texas, are two cities that offer unique experiences for both residents and tourists. The differences in their climate, economy, infrastructure, and culture form a significant contrast. While Queens boasts a bustling city life with diverse cultures within a small area, San Antonio provides a fusion of Mexican-American influences, a warm climate, and a slower pace of life. Before making the choice between living in or visiting these two cities, it is essential to understand their characteristics based on crime and safety, weather, cost of living, and more.
Both Queens and San Antonio have their share of crime, though the nature and prevalence may vary. San Antonio has a crime rate that’s somewhat higher than the national average, particularly in property crimes. However, it has many safe neighborhoods to live in. On the other hand, Queens, as part of NYC, has a moderately high crime rate, though it has significantly improved over the decades and comparable to San Antonio in terms of safety.
Cost of Living
The cost of living in Queens is significantly higher than in San Antonio. Everything from housing and groceries to healthcare is cheaper in San Antonio, in part due to the lower population density. Moreover, Texas does not impose a state income tax, which also reduces the financial burden.
Income Tax
Residents in Queens are subject to New York state and city income tax in addition to federal tax. On the contrary, Texas does not impose an income tax, which means San Antonio residents enjoy a lower tax burden.
Property Tax
Both Queens and San Antonio levy property taxes, but rates in Queens tend to be lower due to New York City's complex property tax system. However, the higher property values in Queens can still lead to substantial tax payments. Property taxes in Texas are relatively high, but property values in San Antonio are generally lower.
Sales Tax
The sales tax in Queens is higher than in San Antonio. Queens, part of New York City, has a combined city and state sales tax of 8.875%. San Antonio, meanwhile, has a combined city and state sales tax rate of 8.25%.
Income
Type
Queens
San Antonio
Estimated median household income
$73,262
$54,923
Estimated per capita income
$34,969
$28,860
Cost of living index (U.S. average is 100)
173.2
87.7
If you make $50,000 in San Antonio, you will have to make $98,746 in Queens to maintain the same standard of living.
Geographical Conditions
Geographically, Queens is flat and urban, with access to beaches via Long Island. San Antonio enjoys a variety of landscapes, including the Texas Hill Country, various rivers and parks, and is less densely populated.
Geographical information
Type
Queens
San Antonio
Land area
109.2 sq. miles
407.6 sq. miles
Population density
20,847 people per sq. mile
3,562.3 people per sq. mile
Relative area comparison
Queens, NY San Antonio, TX
Education
Both Queens and San Antonio have strong educational infrastructures. Queens, with its proximity to Manhattan, offers access to many prestigious schools and universities, such as Columbia and New York University. San Antonio also has well-regarded universities, like the University of Texas at San Antonio, and a strong focus on public education.
The work and economic opportunities also differ substantially between the two cities. Queens, being part of the major economic hub that is New York City, has numerous opportunities in financial services, tech, and media. San Antonio's economy is more centered around healthcare, bioscience, manufacturing, military, and tourism.
Biggest Employers
The biggest employers in Queens are JetBlue Airways, Mount Sinai Hospital, and Queens Library. In San Antonio, the largest employers are H-E-B, USAA, and the San Antonio Military Medical Center.
In Queens (Queens County), 79.2% voted for Democrats and 20.0% for Republicans in 2012 Presidential Election. In San Antonio (Bexar County), 51.6% voted for Democrats and 47.1% for Republicans.
Elections
Type
Democrats
Republicans
Other
Year
Queens
San Antonio
Queens
San Antonio
Queens
San Antonio
2020
72.3%
58.3%
27.0%
40.1%
0.7%
1.5%
2016
75.4%
54.2%
21.8%
40.8%
2.8%
5.0%
2012
79.2%
51.6%
20.0%
47.1%
0.8%
1.4%
2008
75.4%
52.3%
24.3%
46.7%
0.3%
1.0%
2004
71.8%
44.5%
27.5%
55.0%
0.8%
0.6%
2000
75.2%
44.9%
22.0%
52.3%
2.8%
2.7%
1996
72.9%
49.7%
21.1%
44.6%
6.0%
5.7%
Breakdown of population affiliated with a religious congregation
Type
Adherents
Congregations
Religion
Queens
San Antonio
Queens
San Antonio
CATHOLIC CHURCH
30.4%
30.8%
7.7%
8.6%
MUSLIM ESTIMATE
3.7%
1.2%
4.4%
0.8%
SEVENTH DAY ADVENTIST CHURCH
0.6%
0.2%
3.4%
1.3%
AMERICAN BAPTIST CHURCHES IN THE USA
0.5%
0.2%
2.5%
0.3%
EPISCOPAL CHURCH
0.4%
0.6%
2.1%
1.6%
EVANGELICAL LUTHERAN CHURCH IN AMERICA
0.3%
0.6%
2.6%
2.2%
SOUTHERN BAPTIST CONVENTION
0.2%
6.8%
3.8%
23.5%
LUTHERAN CHURCH
0.1%
0.7%
1.8%
1.0%
Weather
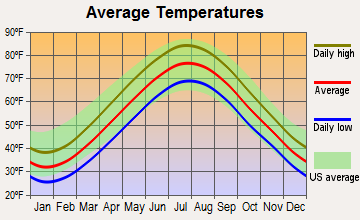
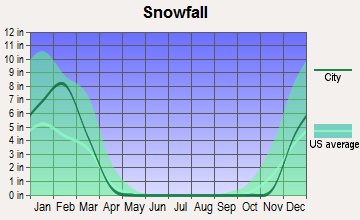
The weather in Queens, NY, and San Antonio, TX, is vastly different. Queens, like the rest of New York City, experiences all four seasons, including snowy winters, which can be quite intense. In contrast, San Antonio has a warmer climate, with mild winters and very hot summers, making it ideal for those who prefer warmer temperatures year-round.
Weather and climate
Type
Queens
San Antonio
Temperature - Average
54.6°F
68.7°F
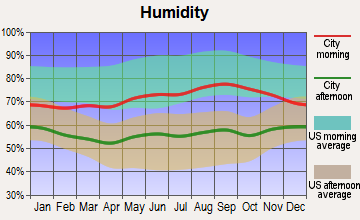
Humidity - Average morning or afternoon humidity
68.5%
74.9%
Humidity - Differences between morning and afternoon humidity
25.1%
37%
Humidity - Maximum monthly morning or afternoon humidity
76.3%
87%
Humidity - Minimum monthly morning or afternoon humidity
51.1%
50%
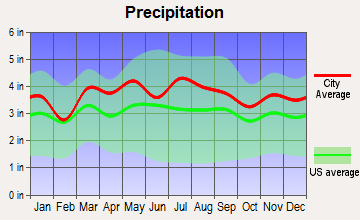
Precipitation - Yearly average
44.5 in
32.2 in
Snowfall - Yearly average
52.7 in
1.2 in
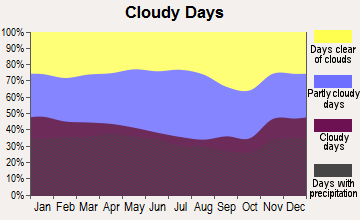
Clouds - Number of days clear of clouds
16.3%
17.5%
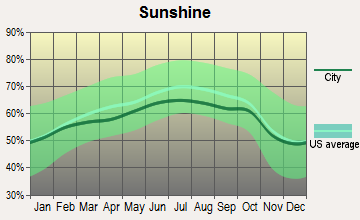
Sunshine amount - Average
60.2%
62.4%
Sunshine amount - Differences during a year
20%
24%
Sunshine amount - Maximum monthly
64%
72%
Sunshine amount - Minimum monthly
44%
48%
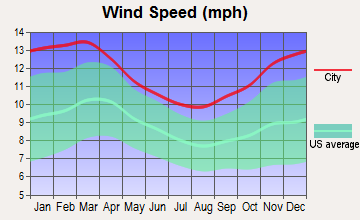
Wind speed - Average
11.6 mph
8.9 mph
Average climate in Queens, New York
Average climate in San Antonio, Texas
Air pollution
Type
AQI
CO
NO2
OZONE
PB
PM10
PM25
SO2
Year
Queens
San Antonio
Queens
San Antonio
Queens
San Antonio
Queens
San Antonio
Queens
Queens
San Antonio
Queens
San Antonio
Queens
San Antonio
2018
97
83
0.26
N/A
14.7
4.9
25.4
25.6
N/A
N/A
N/A
N/A
6.4
8.0
0.4
0.2
2017
98
85
0.23
N/A
15.4
5.1
25.8
26.9
N/A
N/A
N/A
N/A
6.4
8.4
0.5
1.7
2016
97
79
0.24
N/A
16.0
5.2
25.5
25.7
N/A
N/A
N/A
N/A
6.7
8.2
0.6
0.8
2015
104
76
0.26
N/A
17.4
4.7
24.1
25.4
N/A
N/A
N/A
N/A
7.9
9.2
0.8
0.7
2014
99
84
0.25
N/A
17.0
5.5
24.3
27.3
N/A
N/A
N/A
N/A
7.8
9.5
1.1
0.6
2013
101
79
0.23
N/A
17.7
4.1
25.8
28.2
N/A
N/A
N/A
N/A
8.7
9.0
1.2
0.7
2012
105
77
0.26
N/A
17.6
4.5
25.8
27.5
N/A
N/A
N/A
18.1
9.1
9.2
1.8
N/A
2011
112
85
0.27
N/A
20.4
4.6
24.2
29.2
N/A
N/A
N/A
18.9
10.6
9.9
2.7
N/A
2010
112
75
0.35
0.21
19.4
7.2
23.6
25.8
N/A
N/A
N/A
17.1
10.3
9.2
2.9
N/A
2009
107
74
0.24
0.23
21.0
8.3
21.0
25.7
N/A
N/A
N/A
19.5
9.7
9.8
3.4
0.4
2008
113
84
0.44
0.26
22.6
9.3
22.0
26.8
0.013
N/A
N/A
19.8
11.0
10.1
4.1
0.5
2007
121
83
0.46
0.49
22.9
9.3
20.2
26.3
0.016
N/A
N/A
23.4
11.6
10.3
4.9
N/A
2006
120
86
0.46
0.51
23.5
9.7
20.3
32.7
0.018
N/A
N/A
24.8
12.7
9.8
5.3
N/A
2005
110
86
0.54
0.53
25.5
10.7
19.7
30.8
N/A
N/A
N/A
22.3
N/A
10.1
6.7
N/A
2004
107
76
0.55
0.48
25.1
10.4
18.2
29.6
0.030
N/A
N/A
22.4
N/A
N/A
5.8
N/A
2003
110
77
0.63
0.57
26.9
10.3
18.9
28.5
0.022
N/A
26.9
26.7
N/A
N/A
7.0
N/A
2002
124
88
0.58
0.52
27.9
11.2
19.2
30.3
0.008
N/A
25.7
N/A
N/A
N/A
6.5
N/A
2001
124
78
0.60
0.57
28.8
11.9
19.3
29.3
0.020
N/A
24.5
N/A
N/A
N/A
7.8
N/A
2000
115
82
0.67
0.52
28.4
11.7
17.6
29.6
0.022
N/A
22.2
N/A
N/A
N/A
7.3
N/A
Natural disasters
Type
Queens
San Antonio
Tornado activity compared to U.S. average
54%
91.5%
Earthquake activity compared to U.S. average
30.6%
73.7%
Natural disasters compared to U.S. average
19%
21%
Transportation
Public transportation in Queens is convenient, with frequent subway and bus services. Commutes can be lengthy due to congestion. San Antonio's public transit mainly consists of buses. Car ownership is more common due to the city's spread-out nature, and commutes tend to be less stressful than in Queens.
Transport
Type
Queens
San Antonio
Amtrak stations
2
1
Amtrak stations nearby
3
1
FAA registered aircraft
4
987
FAA registered aircraft manufacturers and dealers
0
29
Means of transportation to work
Type
Queens
San Antonio
Bicycle
0.3%
0.2%
Bus
10%
1.6%
Carpooled
10.2%
12.9%
Car alone
34.3%
81.9%
Motorcycle
0%
0.1%
Railroad
2.2%
0%
Streetcar
0.2%
0%
Subway
34.3%
0%
Taxicab
0.7%
0.1%
Walked
5.7%
1.6%
Average travel time to work
Type
Queens
San Antonio
Average
44 min
27 min
Real Estate
Real estate prices are considerably higher in Queens, with a median home cost that is multiple times that of the median price in San Antonio, making San Antonio a more affordable housing market.
Neighborhoods
Both cities have diverse and distinctive neighborhoods. Queens is known for its ethnically diverse neighborhoods like Flushing (predominantly Asian) and Astoria (Greek influence). San Antonio features areas like the historic King William District and the vibrant Pearl District.
Houses and residents
Type
Queens
San Antonio
Houses
817,250
603,670
Average household size (people)
2.8
2.7
Houses occupied
782,664 (95.8%)
549,245 (91%)
Houses occupied by owners
334,894 (42.8%)
290,123 (52.8%)
Houses occupied by renters
447,770 (57.2%)
259,122 (47.2%)
Median rent asked for vacant for-rent units
$1,666
$1,143
Median price asked for vacant for-sale houses and condos
$615,765
$189,213
Estimated median house or condo value
$642,000
$197,600
Median number of rooms in apartments
3.7
4
Median number of rooms in houses and condos
5.4
6.2
Renting percentage
57%
43.5%
Housing density (houses/condos per square mile)
7,481.6
1,481.2
Household income disparities
44.9%
44.7%
Housing units without a mortgage
64,617 (34.6%)
5,815 (3.5%)
Housing units with both a second mortgage and home equity loan
311 (0.2%)
6,350 (3.8%)
Housing units with a mortgage
122,366 (65.4%)
160,674 (96.5%)
Housing units with a home equity loan
9,927 (5.3%)
129 (0.1%)
Housing units with a second mortgage
10,707 (5.7%)
7,761 (4.7%)
Housing units lacking complete kitchen facilities
1%
2.1%
Housing units lacking complete plumbing facilities
Self-employed workers in own not incorporated business
48,383
46,328
State government workers
21,536
29,486
Unpaid family workers
2,382
657
Industries and Occupations
In Queens, the leading industries are healthcare, retail trade, and educational services. In San Antonio, industries such as healthcare, biosciences, military-related activities, and tourism are significant employers.
Healthcare in both Queens and San Antonio is reliable and accessible. Queens residents have access to some world-class hospitals located in NYC, while San Antonio boasts some excellent healthcare facilities, including the renowned South Texas Medical Center.
Health (county statistics)
Type
Queens
San Antonio
General health status score of residents in this county from 1 (poor) to 5 (excellent)
Queens has an extensive public transportation system that includes subways and buses, making it easy to get around without a car. San Antonio, while having public buses, is more car-centric due to its expansive layout.
Infrastructure
Type
Queens
San Antonio
Hospitals
1
130
TV stations
30
30
Schools
School facilities
Type
Queens
San Antonio
Private elementary/middle schools
8
43
Private high schools
1
28
Public elementary/middle schools
6
367
Public high schools
2
110
Colleges/Universities
1
49
Culture and Food
Culturally, Queens is one of the most diverse places worldwide, boasting a range of global cuisines, cultural institutions, and ethnic neighborhoods. San Antonio's culture showcases a unique blend of Mexican and American influences, seen in its food, architecture, and annual events.
Sports Teams
Queens is home to the New York Mets (MLB) and has easy access to other NYC sports teams. San Antonio hosts the San Antonio Spurs (NBA), a team with a storied history in professional basketball.
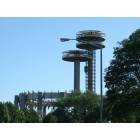


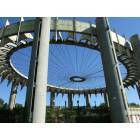


 Queens, NY
 San Antonio, TX