


Relative area comparison
 Queens, NY
 Baltimore, MD
Queens, New York, and Baltimore, Maryland are two cities within the United States which share common urban characteristics, yet each possesses unique features befitting distinct lifestyles. This comparison will delve into several aspects of living in these two cities, including crime rates, cost of living, transportation, taxes, culture, sports, and their geographical landscapes, among others. It provides a comprehensive view for individuals exploring a potential relocation or simply considering these cities for tourism.

 | City/Metro homicides 2024 (703 replies) |
| Demographics Thread - 2023 (221 replies) |
| Most "Walkable" City? (147 replies) |
| Top 10 most urban contiguous 50 sq miles (681 replies) |
| Walk Score Top 25 City Ranking for American Cities (68 replies) |
| City/Metro Homicides of 2022 (2524 replies) |
Queens, NY and
Baltimore, MD : 177.0 miles
Queens's population is larger by 295%. The population of Baltimore has decreased by 74,656 people (11.5%) during that time.
| Population | ||
| Type | Queens | Baltimore |
|---|---|---|
| Population | 2,277,251 | 576,498 |
| Female / male percentage | 51.8% / 48.2%
|
53.1% / 46.9%
|
Despite being part of one of the world’s major cities, Queens, New York generally has a lower crime rate compared to Baltimore. While Queens has seen a decrease in crime over the years, Baltimore struggles with high crime rates, particularly violent crimes. However, both cities are investing heavily in their community policing efforts to ensure public safety. Tourists in both cities are generally safe, provided they stay in well-populated areas and exercise common caution typical in any urban area.
Living in Queens is significantly more expensive than Baltimore in nearly all respects. From housing to groceries and health care, the overall cost of living in Baltimore is considerably lower. For individuals considering relocation, Baltimore may be an appealing choice for its affordability. Yet, for tourists, the high cost in Queens may be offset by the rich experiences provided by this cosmopolitan city.
New York City has its own city income tax, and along with the state tax, the total income tax in Queens could go beyond 10%. Baltimore residents pay state income tax of 5.75% and a local income tax of 3.2%.
Property tax rates are higher in Baltimore compared to Queens. However, property values are significantly more in Queens thus potentially resulting in larger absolute tax payments.
New York State has a sales tax of 4%, and with the addition of city tax, Queens has a total sales tax of 8.875%. Baltimore, part of Maryland, enjoys a lower sales tax rate at 6%.
| Income | ||
| Type | Queens | Baltimore |
|---|---|---|
| Estimated median household income | $73,262 | $54,652 |
| Estimated per capita income | $34,969 | $35,091 |
| Cost of living index (U.S. average is 100) | 173.2 | 105.7 |
If you make $50,000 in Baltimore, you will have to make $81,930 in Queens to maintain the same standard of living.
Queens is geographically diverse, from the skyscrapers of Long Island City to the suburban neighborhoods of Bayside. Baltimore is known for its picturesque Inner Harbor and historic architecture.
| Geographical information | ||
| Type | Queens | Baltimore |
|---|---|---|
| Land area | 109.2 sq. miles | 80.8 sq. miles |
| Population density | 20,847 people per sq. mile | 7,134.5 people per sq. mile |
Queens, NY
Baltimore, MD
Both cities offer various educational opportunities for all age groups. However, due to its proximity to prestigious institutions like Columbia University and New York University, Queens may provide more opportunities in higher education. Baltimore also has its share of educational institutions such as Johns Hopkins University. It's therefore matter of choice deciding between these two cities from an education perspective.
| Education level (25-year-olds and older) | ||
| Type | Queens | Baltimore |
|---|---|---|
| Bachelor's degree or higher | 24.3% | 37.7% |
| Graduate or professional degree | 9.2% | 18.5% |
| High school or higher | 74.4% | 88.8% |
New York City's economy, including Queens, is diverse with sectors such as finance, healthcare, and entertainment, offering a wide range of job opportunities. On the other hand, Baltimore's economy is centered around health, science, technology, and the port-related commerce. Both cities offer competitive job markets, and choice would depend on individual's occupational interests and skills.
The largest employers in Queens are the healthcare sector including NewYork-Presbyterian Hospital and Mount Sinai Health System. In Baltimore, Johns Hopkins University and Health System, and the federal government are the leading employers.
In Queens (Queens County), 79.2% voted for Democrats and 20.0% for Republicans in 2012 Presidential Election. In Baltimore (Baltimore city), 87.4% voted for Democrats and 11.1% for Republicans.
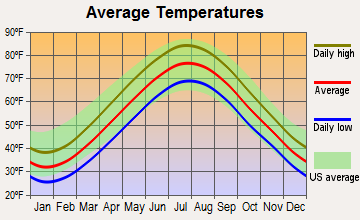
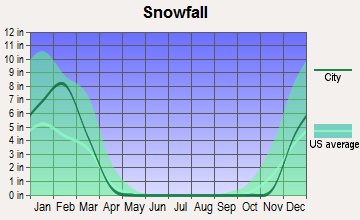
Queens experiences a wide range of weather conditions with hot summers, whereas Baltimore tends to be slightly warmer yet milder in comparison. Winters in Queens can be harsher than those in Baltimore, with more frequent snowfall. Both cities experience seasonal changes and tourists can enjoy different cultural events and attractions specific to each season.
| Weather and climate | ||
| Type | Queens | Baltimore |
|---|---|---|
| Temperature - Average | 54.6°F | 54.5°F |
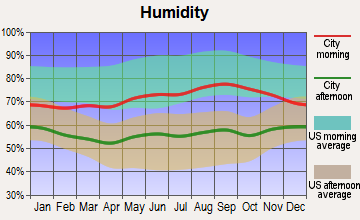
| Humidity - Average morning or afternoon humidity | 68.5% | 70.4% |
| Humidity - Differences between morning and afternoon humidity | 25.1% | 36% |
| Humidity - Maximum monthly morning or afternoon humidity | 76.3% | 84% |
| Humidity - Minimum monthly morning or afternoon humidity | 51.1% | 48% |
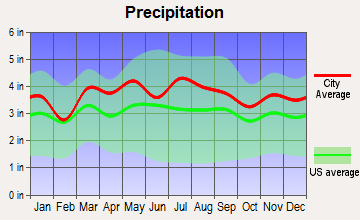
| Precipitation - Yearly average | 44.5 in | 42.9 in |
| Snowfall - Yearly average | 52.7 in | 39.6 in |
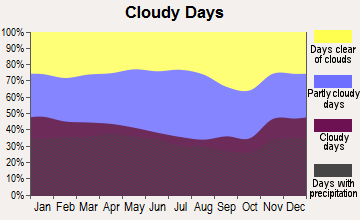
| Clouds - Number of days clear of clouds | 16.3% | 17.5% |
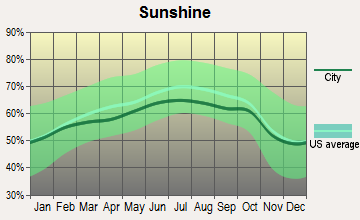
| Sunshine amount - Average | 60.2% | 60.3% |
| Sunshine amount - Differences during a year | 20% | 16% |
| Sunshine amount - Maximum monthly | 64% | 63% |
| Sunshine amount - Minimum monthly | 44% | 47% |
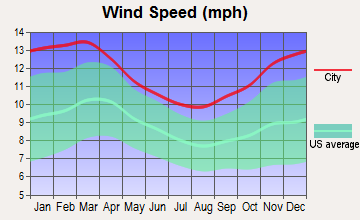
| Wind speed - Average | 11.6 mph | 7.9 mph |
| Natural disasters | ||
| Type | Queens | Baltimore |
|---|---|---|
| Tornado activity compared to U.S. average | 54% | 117.8% |
| Earthquake activity compared to U.S. average | 30.6% | 40.6% |
| Natural disasters compared to U.S. average | 19% | 0% |
Queens has a robust transportation system, with efficient subway and bus lines, making commuting easier. Baltimore also has adequate public transit, but is not as extensive as Queens. Both cities have bike-sharing programs and numerous taxis and ride-sharing services.
| Transport | ||
| Type | Queens | Baltimore |
|---|---|---|
| Amtrak stations | 2 | 2 |
| Amtrak stations nearby | 3 | 2 |
| FAA registered aircraft | 4 | 136 |
| FAA registered aircraft manufacturers and dealers | 0 | 2 |
| Means of transportation to work | ||
| Type | Queens | Baltimore |
|---|---|---|
| Bicycle | 0.3% | 0.4% |
| Bus | 10% | 6.2% |
| Carpooled | 10.2% | 7.3% |
| Car alone | 34.3% | 77.2% |
| Railroad | 2.2% | 0.3% |
| Streetcar | 0.2% | 1.2% |
| Subway | 34.3% | 0.2% |
| Taxicab | 0.7% | 0.7% |
| Walked | 5.7% | 4.5% |
| Average travel time to work | ||
| Type | Queens | Baltimore |
|---|---|---|
| Average | 44 min | 32.3 min |
Real estate is notably more expensive in Queens than in Baltimore, with the median home price significantly higher in Queens. However, for tourists looking for short-term rentals, both cities offer a range of options.
Queens is known for its diverse neighborhoods like Astoria and Flushing that cater to various ethnic communities and offer a multitude of cultural experiences. Baltimore’s neighborhoods such as Fells Point and Federal Hill offer historic charm and local character.
| Houses and residents | ||
| Type | Queens | Baltimore |
|---|---|---|
| Houses | 817,250 | 293,487 |
| Average household size (people) | 2.8 | 2.4 |
| Houses occupied | 782,664 (95.8%) | 254,370 (86.7%) |
| Houses occupied by owners | 334,894 (42.8%) | 123,249 (48.5%) |
| Houses occupied by renters | 447,770 (57.2%) | 131,121 (51.5%) |
| Median rent asked for vacant for-rent units | $1,666 | $1,254 |
| Median price asked for vacant for-sale houses and condos | $615,765 | $207,303 |
| Estimated median house or condo value | $642,000 | $193,100 |
| Median number of rooms in apartments | 3.7 | 4.2 |
| Median number of rooms in houses and condos | 5.4 | 6.5 |
| Renting percentage | 57% | 52.3% |
| Housing density (houses/condos per square mile) | 7,481.6 | 3,632.1 |
| Household income disparities | 44.9% | 49.4% |
| Housing units without a mortgage | 64,617 (34.6%) | 2,415 (2.8%) |
| Housing units with both a second mortgage and home equity loan | 311 (0.2%) | 5,740 (6.6%) |
| Housing units with a mortgage | 122,366 (65.4%) | 84,578 (97.2%) |
| Housing units with a home equity loan | 9,927 (5.3%) | 579 (0.7%) |
| Housing units with a second mortgage | 10,707 (5.7%) | 8,544 (9.8%) |
| Housing units lacking complete kitchen facilities | 1% | 6% |
| Housing units lacking complete plumbing facilities | 1.1% | 5.1% |
In Queens, the dominant industries include healthcare, retail trade, and education. Baltimore's key industries are health, life sciences, international commerce, and cybersecurity. Job seekers will find a variety of job markets in both cities.
Queens is home to some of the country's top hospitals, like Mount Sinai Queens and NewYork-Presbyterian Queens. Baltimore also offers excellent healthcare facilities, including the world-renowned Johns Hopkins Hospital.
| Health (county statistics) | ||
| Type | Queens | Baltimore |
|---|---|---|
| General health status score of residents in this county from 1 (poor) to 5 (excellent) | 3.4 | 3.5 |
| Average weight of females (lbs) | 156.2 lbs | 165.6 lbs |
| Average weight of males (lbs) | 183.8 lbs | 197.7 lbs |
| Residents visited a dentist within the past year | 71.1% | 72.1% |
| Residents exercised in the past month | 68.7% | 73.7% |
| Adult residents drank alcohol in the past 30 days | 75.3% | 56.5% |
| Residents smoked 100+ cigarettes in their lives | 41.4% | 41.4% |
Queens, as a part of the larger NYC metro area, boasts an extensive and robust infrastructure, from public transit to accessibility of services. Infrastructure in Baltimore, although not as extensive, is adequate and improving, with ongoing efforts towards urban renewal projects.
| Infrastructure | ||
| Type | Queens | Baltimore |
|---|---|---|
| Hospitals | 1 | 45 |
| TV stations | 30 | 19 |
Culture and food are where both cities truly shine. Queens offers global culinary adventures, reflecting its highly diverse population. Baltimore, on the other hand, is famous for its seafood, particularly its crab dishes. Both cities have a lively arts scene, with numerous museums, galleries, and theaters.
Queens ties into the NYC sports scene, with two of its popular teams, the Mets in baseball and the New York City FC in soccer. Baltimore supports its own beloved teams, the NFL's Ravens and MLB's Orioles - making both cities a sports-lover's delight.