Relocating or contemplating a visit to Portland, OR and Central Contra Costa, CA can provide distinctly varied experiences, depending on your preferences and requirements. Both regions offer a rich diversity of culture, facilities, and scenic beauty. This comparison can assist you with your decision, giving insights on crime safety, weather, costs, education, work opportunities, infrastructure, industry occupations, major employers, real estate, neighborhoods, transportation, taxes, culture, sports, geographical settings, and healthcare availability.
Portland, OR has higher rates of both property and violent crimes compared to the US average. Safety is a concerning issue. However, the city administration and community take measures to address the challenges.
Central Contra Costa, CA experiences lower crime rates than the national average but residents' concern about burglary and auto theft is still present. Both locations would require a balanced approach to personal safety and security.
Cost of Living
Living in Portland is comparatively less expensive than Central Contra Costa. While the housing influences much of the cost difference, everyday expenses like groceries, healthcare, and utilities are generally also lower in Portland.
Income Tax
Oregon's income tax is notably high, while California also is known for high state income tax rates. There is no significant advantage for either in this regard.
Property Tax
Property tax rates in Portland are higher than in Central Contra Costa, contributing to the overall cost of homeownership. However, higher property values in Central Contra Costa can lead to large tax bills.
Sales Tax
Comparing the two, Portland has an advantage with no sales tax in Oregon. In contrast, the sales tax in Central Contra Costa is high, making shopping and dining more expensive.
Income
Type
Portland
Central Contra Costa
Estimated median household income
$79,057
$127,452
Estimated per capita income
$49,003
$68,702
Cost of living index (U.S. average is 100)
106.5
139.1
If you make $50,000 in Portland, you will have to make $65,305 in Central Contra Costa to maintain the same standard of living.
Geographical Conditions
Portland, with its access to both mountains and coastlines, offers a varied landscape. Central Contra Costa has rolling hills, proximity to water, and is a short drive from the Pacific coast and Sierra Nevada mountains.
Geographical information
Type
Portland
Central Contra Costa
Land area
134.3 sq. miles
261.3 sq. miles
Population density
4,773.4 people per sq. mile
1,863.4 people per sq. mile
Relative area comparison
Portland, OR Central Contra Costa, CA
Education
Both regions prioritize education but offer different styles. Portland has more unconventional learning environments, while Central Contra Costa follows a more traditional approach. Both have excellent public and private schools, with Central Contra Costa boasting better school ratings overall.
Portland's economy is more diversified compared to Central Contra Costa. There are ample job opportunities in tech, healthcare, and manufacturing in Portland. Central Contra Costa is primarily driven by services and retail trade sectors.
Biggest Employers
Intel, Providence Health & Services, and Oregon Health & Science University are the biggest employers in Portland. In Central Contra Costa, some of the largest employers include Kaiser Permanente and Bank of America.
In Portland (Multnomah County), 75.4% voted for Democrats and 20.6% for Republicans in 2012 Presidential Election. In Central Contra Costa (Contra Costa County), 66.2% voted for Democrats and 31.1% for Republicans.
Elections
Type
Democrats
Republicans
Other
Year
Portland
Central Contra Costa
Portland
Central Contra Costa
Portland
Central Contra Costa
2020
79.2%
71.8%
17.9%
26.4%
2.9%
1.8%
2016
73.3%
67.5%
17.0%
24.5%
9.7%
8.0%
2012
75.4%
66.2%
20.6%
31.1%
4.0%
2.7%
2008
76.7%
68.0%
20.6%
30.2%
2.7%
1.8%
2004
71.6%
62.6%
27.1%
36.7%
1.3%
0.7%
2000
63.8%
59.0%
28.3%
37.2%
7.9%
3.8%
1996
59.2%
55.7%
26.3%
35.2%
14.4%
9.1%
Breakdown of population affiliated with a religious congregation
Type
Adherents
Congregations
Religion
Portland
Central Contra Costa
Portland
Central Contra Costa
CATHOLIC CHURCH
15.2%
21.8%
6.7%
5.2%
EVANGELICAL LUTHERAN CHURCH IN AMERICA
0.9%
0.5%
4.0%
2.0%
SEVENTH DAY ADVENTIST CHURCH
0.9%
0.3%
3.4%
1.5%
AMERICAN BAPTIST CHURCHES IN THE USA
0.8%
0.3%
2.7%
2.6%
EPISCOPAL CHURCH
0.7%
0.5%
2.2%
2.3%
SOUTHERN BAPTIST CONVENTION
0.5%
1.3%
3.8%
10.0%
LUTHERAN CHURCH
0.4%
0.2%
2.2%
2.0%
MUSLIM ESTIMATE
0.3%
1.0%
1.0%
1.4%
Weather
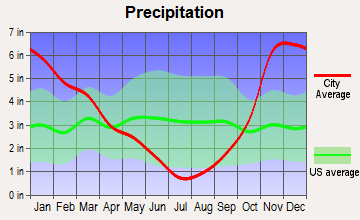
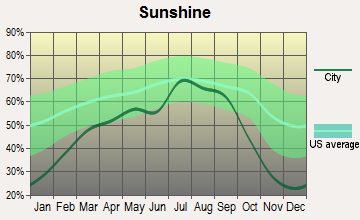
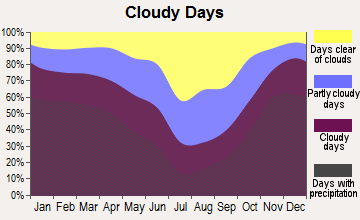
Portland enjoys a temperate oceanic climate with warm, dry summers and chilly, wet winters. Much of the year is cloudy, where drizzle is commonplace.
Central Contra Costa, on the other hand, experiences a Mediterranean climate, with cool, rainy winters and warm to hot, dry summers. Portland's rainy ambiance contrasts with the sunny disposition of Central Contra Costa.
Weather and climate
Type
Portland
Central Contra Costa
Temperature - Average
53.9°F
59.1°F
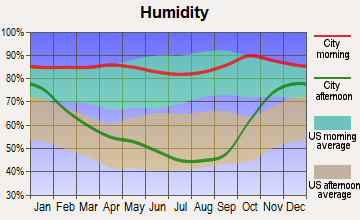
Humidity - Average morning or afternoon humidity
76.5%
82.2%
Humidity - Differences between morning and afternoon humidity
42%
29.3%
Humidity - Maximum monthly morning or afternoon humidity
86%
88.1%
Humidity - Minimum monthly morning or afternoon humidity
44%
58.8%
Precipitation - Yearly average
41.6 in
21.8 in
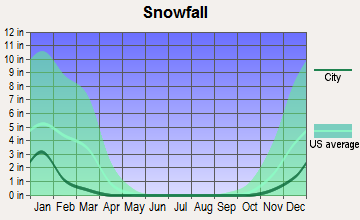
Snowfall - Yearly average
12.8 in
0 in
Clouds - Number of days clear of clouds
11.3%
27.7%
Sunshine amount - Average
54.7%
73.3%
Sunshine amount - Differences during a year
52%
22.4%
Sunshine amount - Maximum monthly
72%
77.2%
Sunshine amount - Minimum monthly
20%
54.7%
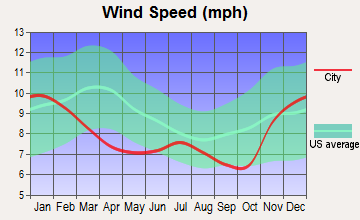
Wind speed - Average
8.1 mph
11.1 mph
Average climate in Portland, Oregon
Average climate in Central Contra Costa, California
Air pollution
Type
AQI
CO
NO2
OZONE
PB
PM25
SO2
Year
Portland
Central Contra Costa
Portland
Central Contra Costa
Portland
Central Contra Costa
Portland
Central Contra Costa
Portland
Central Contra Costa
Portland
Central Contra Costa
Portland
Central Contra Costa
2018
79
105
0.26
0.32
8.8
6.9
21.4
22.1
N/A
0.012
7.2
13.3
0.4
0.6
2017
93
102
0.26
0.30
8.7
7.0
22.6
25.9
N/A
0.008
7.1
11.9
0.4
0.7
2016
72
86
0.25
0.28
8.7
6.5
20.8
25.2
N/A
0.005
5.2
6.5
0.2
0.8
2015
91
94
0.28
0.34
9.2
7.6
20.1
25.8
N/A
0.004
7.4
8.8
0.5
0.5
2014
91
95
0.24
0.35
8.5
7.8
21.0
25.2
N/A
0.005
6.3
6.9
0.8
0.5
2013
85
93
0.29
0.34
9.6
9.3
17.9
21.5
N/A
0.004
8.6
7.8
1.1
0.5
2012
78
93
0.30
0.32
9.1
8.5
21.0
25.2
N/A
0.003
7.4
8.3
0.6
0.3
2011
89
99
0.34
0.35
9.4
9.0
18.5
23.0
N/A
0.003
8.1
9.8
0.8
0.6
2010
80
93
0.33
0.31
9.1
8.6
19.4
23.2
N/A
0.014
6.4
8.5
1.4
0.5
2009
95
104
0.32
0.31
10.2
9.5
20.0
23.7
N/A
0.006
8.4
10.3
1.6
0.6
2008
101
120
0.34
0.36
10.9
10.2
19.2
26.1
N/A
0.006
8.8
12.1
1.0
0.8
2007
101
104
0.35
0.36
11.4
10.7
18.1
24.1
N/A
0.006
8.8
9.7
1.3
0.7
2006
106
109
N/A
0.39
N/A
10.9
N/A
26.0
N/A
N/A
7.8
11.1
1.5
0.8
2005
96
104
N/A
0.43
N/A
11.6
N/A
22.7
N/A
N/A
8.9
10.4
1.7
1.0
2004
92
112
N/A
0.46
N/A
12.4
N/A
22.6
N/A
0.004
9.8
11.9
N/A
1.1
2003
77
84
N/A
0.51
N/A
13.4
N/A
23.1
0.008
N/A
8.6
N/A
N/A
0.7
2002
68
88
N/A
0.51
N/A
14.7
N/A
23.3
0.010
0.008
8.4
N/A
N/A
0.9
2001
73
90
N/A
0.56
N/A
15.4
N/A
22.1
0.008
0.008
8.9
N/A
N/A
1.2
2000
52
95
N/A
0.67
N/A
15.9
N/A
20.8
N/A
0.013
N/A
N/A
N/A
1.6
Natural disasters
Type
Portland
Central Contra Costa
Tornado activity compared to U.S. average
8.4%
9.4%
Earthquake activity compared to U.S. average
1,575.5%
7,786.2%
Natural disasters compared to U.S. average
9%
18%
Transportation
Portland has excellent public transit with light rail, buses, and streetcars. Central Contra Costa residents primarily rely on cars, but there is access to Bay Area Rapid Transit (BART) for commuting.
Transport
Type
Portland
Central Contra Costa
Amtrak stations
1
0
Amtrak stations nearby
3
3
FAA registered aircraft
804
0
FAA registered aircraft manufacturers and dealers
6
0
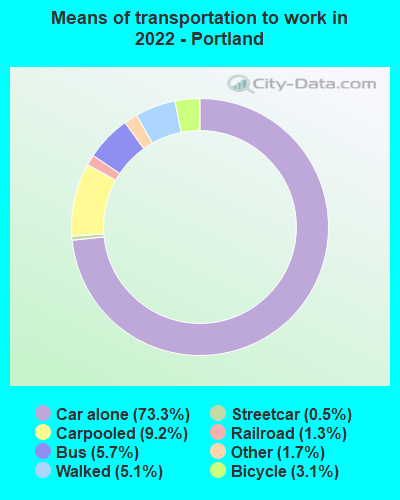
Means of transportation to work
Type
Portland
Central Contra Costa
Bicycle
3.1%
0.5%
Bus
4.6%
1%
Carpooled
9.4%
9.9%
Car alone
76.2%
72.3%
Motorcycle
0.2%
0.2%
Railroad
0.9%
0.8%
Streetcar
0.3%
0.1%
Subway
0%
7.7%
Walked
3.8%
1.5%
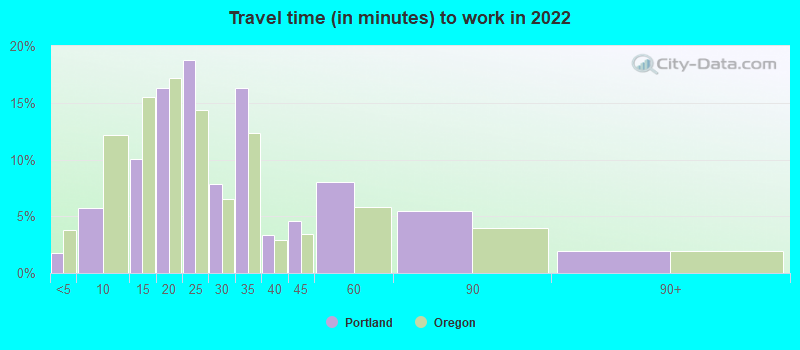
Average travel time to work
Type
Portland
Central Contra Costa
Average
28.8 min
31.8 min
Real Estate
Portland offers urban real estate options like condos, apartments, townhomes, and single-family homes. Central Contra Costa offers more suburban-style housing with single-family homes and large backyards, but the prices are considerably higher.
Neighborhoods
While Portland offers an array of neighborhoods for diverse lifestyles, Central Contra Costa is a more suburban setting, each city within the enclave offering distinct community vibes. Both options appeal depending on one's lifestyle preference.
Houses and residents
Type
Portland
Central Contra Costa
Houses
303,483
183,777
Average household size (people)
2.3
2.5
Houses occupied
286,734 (94.5%)
179,136 (97.5%)
Houses occupied by owners
153,121 (53.4%)
127,889 (71.4%)
Houses occupied by renters
133,613 (46.6%)
51,247 (28.6%)
Median rent asked for vacant for-rent units
$1,917
$2,527
Median price asked for vacant for-sale houses and condos
$248,225
$1,269,474
Estimated median house or condo value
$520,200
Over $1,000,000
Median number of rooms in apartments
3.4
4.3
Median number of rooms in houses and condos
6.2
6.5
Renting percentage
46.3%
30.3%
Housing density (houses/condos per square mile)
2,259.4
703.4
Household income disparities
44.7%
35.9%
Housing units without a mortgage
2,404 (2.2%)
20,208 (18.2%)
Housing units with both a second mortgage and home equity loan
11,239 (10.1%)
418 (0.4%)
Housing units with a mortgage
108,864 (97.8%)
90,899 (81.8%)
Housing units with a home equity loan
396 (0.4%)
13,612 (12.3%)
Housing units with a second mortgage
12,832 (11.5%)
13,614 (12.3%)
Housing units lacking complete kitchen facilities
1.2%
0.5%
Housing units lacking complete plumbing facilities
Self-employed workers in own not incorporated business
25,437
22,217
State government workers
15,615
6,705
Unpaid family workers
688
617
Industries and Occupations
Portland prides itself on a robust tech industry. Health care and social assistance and retail trade are the largest sectors. In Central Contra Costa, health care and retail, along with finance and insurance services, form the leading industries.
Both locations have high-quality healthcare services. Portland is home to Oregon Health & Science University, a top research institution, and Central Contra Costa has access to the robust Bay Area healthcare system including Kaiser Permanente and John Muir Health.
Health (county statistics)
Type
Portland
Central Contra Costa
General health status score of residents in this county from 1 (poor) to 5 (excellent)
Portland's infrastructure is more developed and comprehensive due to its urban nature. Central Contra Costa, on the other hand, is known for its suburban environment, with larger homes and yards.
Infrastructure
Type
Portland
Central Contra Costa
TV stations
18
24
Culture and Food
Portland is known for its unique culture, offering a vibrant arts scene, music, and an array of international and local cuisines. Central Contra Costa also offers a rich cultural environment with its local festivals, recreational activities, and culinary experiences.
Sports Teams
In this category, Portland edges out Central Contra Costa, being home to NBA's Trail Blazers, MLS's Timbers, and the Thorns. Central Contra Costa residents support teams regionally, such as the Golden State Warriors, the San Francisco Giants, and the Oakland Raiders.
 Portland, OR
 Central Contra Costa, CA