Portland, Oregon and Bellevue, Washington each have their own unique lifestyles and amenities, making them appealing for different reasons. Portland offers a vibrant culture, diverse food scene, and a thriving economy, while Bellevue is known for its high-quality schools, safer neighborhoods, and robust tech industry. The choice between the two largely depends on your individual situation, priorities, and preferences.
Distance between
Portland, OR and
Bellevue, WA : 145.1 miles
Portland's population is larger by 329%. Its population has grown by 112,041 people (21.2%) since 2000. The population of Bellevue has grown by 39,871 people (36.4%) during that time.
Regarding crime rates, Portland generally has higher crime rates than Bellevue. According to the FBI's most recent data, Portland reported more incidents of both violent and property crime than Bellevue, making Bellevue relatively safer. However, specific rates can vary depending on the neighborhood.
City-data.com crime index counts serious crimes and violent crime more heavily. It adjusts for the number of visitors and daily workers commuting into cities. (higher means more crime, U.S. average = 301.1)
City-data.com crime index counts serious crimes and violent crime more heavily. It adjusts for the number of visitors and daily workers commuting into cities. (higher means more crime, U.S. average = 301.1)
Sex Offenders
According to our data, there are 371 registered sex offenders living in Portland and 19 registered sex offenders living in . The ratio of residents to sex offenders in Portland is 1,724 to 1; the ratio in Bellevue is 7,439 to 1. The number of registered sex offenders compared to the number of residents is much larger in Portland than that in Bellevue.
Cost of Living
Cost of living is generally higher in Bellevue than in Portland. This difference is largely driven by housing costs, with median home prices in Bellevue being considerably higher than Portland's. The general costs for goods and services, groceries, and healthcare are also slightly more expensive in Bellevue.
Income Tax
While Washington state, including Bellevue, does not have a state income tax, Oregon does. People earning income in Portland will pay personal income tax to the state.
Property Tax
Both Portland and Bellevue have property taxes, with the rates varying by county and city. Generally, property taxes are higher in Bellevue compared to Portland.
Sales Tax
Oregon, including Portland, does not have a sales tax while Washington does. This can make everyday items more expensive in Bellevue. However, this is somewhat balanced by Oregon’s higher income tax rate.
Income
Type
Portland
Bellevue
Estimated median household income
$79,057
$144,274
Estimated per capita income
$49,003
$78,786
Cost of living index (U.S. average is 100)
106.5
118.2
If you make $50,000 in Portland, you will have to make $55,493 in Bellevue to maintain the same standard of living.
Geographical Conditions
Both cities are blessed with beautiful natural environments. Portland is located near the Columbia and Willamette Rivers, whereas Bellevue is located between Lake Washington and Lake Sammamish. Both cities are surrounded by mountains and forests, offering many outdoor activities.
When it comes to education, Bellevue is often recognized for its high-quality school system. Bellevue's public schools regularly rank among the top in the nation. Conversely, Portland provides more higher education opportunities, with several universities and colleges within and close to the city.
Both cities have robust economies. Portland has a diverse economy with a strong presence in the technology, manufacturing, and healthcare industries. Bellevue, on the other hand, is a hub for the technology industry, housing many IT and software companies.
Biggest Employers
Some of the biggest employers in Portland include Intel, Providence Health & Services, and Nike. In Bellevue, major employers are Microsoft, T-Mobile, and Expedia, signifying the city's strong tech industry presence.
There were 474 building permits issued in Portland in 2012 (23 more than in 2011) compared to 200 building permits issued in Bellevue in 2012 (132 more than in 2011).
In Portland (Multnomah County), 75.4% voted for Democrats and 20.6% for Republicans in 2012 Presidential Election. In Bellevue (King County), 69.0% voted for Democrats and 28.5% for Republicans.
Elections
Type
Democrats
Republicans
Other
Year
Portland
Bellevue
Portland
Bellevue
Portland
Bellevue
2020
79.2%
75.1%
17.9%
22.3%
2.9%
2.6%
2016
73.3%
70.0%
17.0%
21.1%
9.7%
8.9%
2012
75.4%
69.0%
20.6%
28.5%
4.0%
2.5%
2008
76.7%
70.2%
20.6%
28.1%
2.7%
1.7%
2004
71.6%
65.1%
27.1%
33.8%
1.3%
1.1%
2000
63.8%
60.3%
28.3%
34.5%
7.9%
5.2%
1996
59.2%
56.4%
26.3%
31.4%
14.4%
12.2%
Breakdown of population affiliated with a religious congregation
Type
Adherents
Congregations
Religion
Portland
Bellevue
Portland
Bellevue
CATHOLIC CHURCH
15.2%
14.4%
6.7%
4.9%
EVANGELICAL LUTHERAN CHURCH IN AMERICA
0.9%
1.3%
4.0%
4.7%
SEVENTH DAY ADVENTIST CHURCH
0.9%
0.6%
3.4%
2.3%
AMERICAN BAPTIST CHURCHES IN THE USA
0.8%
0.6%
2.7%
2.9%
EPISCOPAL CHURCH
0.7%
0.8%
2.2%
2.4%
SOUTHERN BAPTIST CONVENTION
0.5%
0.3%
3.8%
3.8%
LUTHERAN CHURCH
0.4%
0.5%
2.2%
2.0%
MUSLIM ESTIMATE
0.3%
0.6%
1.0%
1.4%
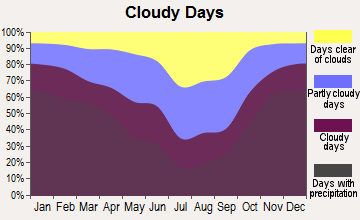
Weather
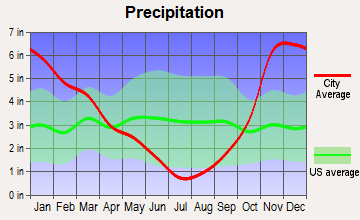
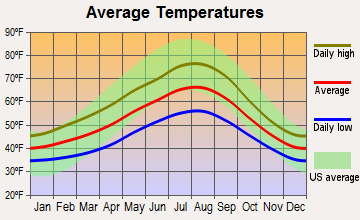
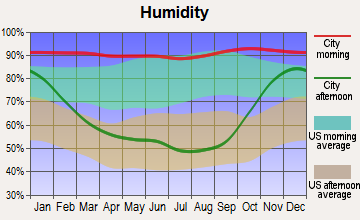
Weather conditions are relatively similar given the close proximity of both cities in the Pacific Northwest. Both cities experience mild, wet winters and warm, dry summers. However, Portland tends to have slightly warmer temperatures year-round compared to Bellevue.
Weather and climate
Type
Portland
Bellevue
Temperature - Average
53.9°F
52.5°F
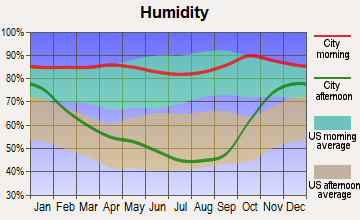
Humidity - Average morning or afternoon humidity
76.5%
78.5%
Humidity - Differences between morning and afternoon humidity
42%
38%
Humidity - Maximum monthly morning or afternoon humidity
86%
86%
Humidity - Minimum monthly morning or afternoon humidity
44%
48%
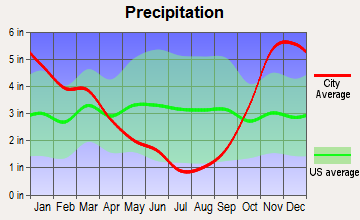
Precipitation - Yearly average
41.6 in
37 in
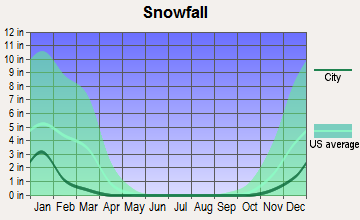
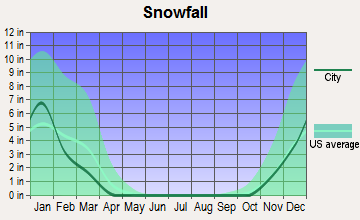
Snowfall - Yearly average
12.8 in
21.5 in
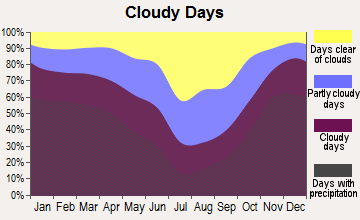
Clouds - Number of days clear of clouds
11.3%
11.7%
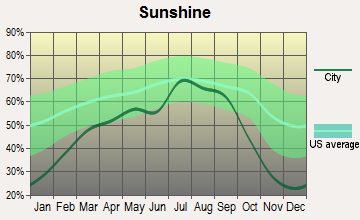
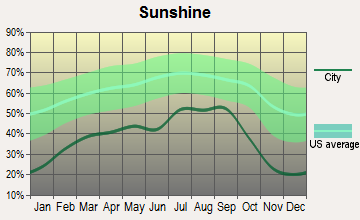
Sunshine amount - Average
54.7%
49.4%
Sunshine amount - Differences during a year
52%
44%
Sunshine amount - Maximum monthly
72%
64%
Sunshine amount - Minimum monthly
20%
20%
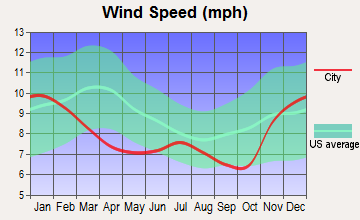
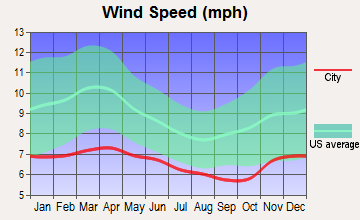
Wind speed - Average
8.1 mph
8.5 mph
Average climate in Portland, Oregon
Average climate in Bellevue, Washington
Air pollution
Type
AQI
CO
NO2
OZONE
PB
PM10
PM25
SO2
Year
Portland
Bellevue
Portland
Bellevue
Portland
Bellevue
Portland
Bellevue
Portland
Bellevue
Bellevue
Portland
Bellevue
Portland
Bellevue
2018
79
85
0.26
0.21
8.8
10.6
21.4
21.1
N/A
N/A
N/A
N/A
7.2
3.4
0.4
0.7
2017
93
100
0.26
0.23
8.7
11.1
22.6
21.2
N/A
N/A
N/A
N/A
7.1
4.3
0.4
0.3
2016
72
67
0.25
0.22
8.7
11.9
20.8
20.2
N/A
N/A
N/A
N/A
5.2
3.5
0.2
0.6
2015
91
88
0.28
0.23
9.2
10.8
20.1
19.4
N/A
N/A
N/A
N/A
7.4
5.2
0.5
0.8
2014
91
75
0.24
0.24
8.5
11.5
21.0
19.5
N/A
N/A
N/A
N/A
6.3
5.5
0.8
N/A
2013
85
81
0.29
0.24
9.6
N/A
17.9
17.1
N/A
N/A
N/A
N/A
8.6
4.8
1.1
0.8
2012
78
83
0.30
0.23
9.1
N/A
21.0
19.2
N/A
N/A
N/A
N/A
7.4
4.8
0.6
1.0
2011
89
73
0.34
0.24
9.4
N/A
18.5
18.6
N/A
N/A
N/A
N/A
8.1
4.8
0.8
1.1
2010
80
73
0.33
0.24
9.1
N/A
19.4
18.0
N/A
N/A
N/A
N/A
6.4
4.1
1.4
1.1
2009
95
94
0.32
0.27
10.2
N/A
20.0
18.3
N/A
N/A
N/A
N/A
8.4
5.4
1.6
1.4
2008
101
80
0.34
0.30
10.9
N/A
19.2
17.8
N/A
N/A
N/A
N/A
8.8
5.1
1.0
1.3
2007
101
85
0.35
0.30
11.4
N/A
18.1
17.6
N/A
N/A
18.9
N/A
8.8
5.9
1.3
1.5
2006
106
102
N/A
N/A
N/A
N/A
N/A
18.4
N/A
N/A
21.0
N/A
7.8
6.9
1.5
N/A
2005
96
104
N/A
0.78
N/A
18.3
N/A
N/A
N/A
N/A
22.7
N/A
8.9
7.0
1.7
3.5
2004
92
110
N/A
0.78
N/A
17.9
N/A
N/A
N/A
N/A
N/A
N/A
9.8
7.7
N/A
3.0
2003
77
100
N/A
0.83
N/A
18.5
N/A
N/A
0.008
N/A
N/A
N/A
8.6
7.9
N/A
2.4
2002
68
90
N/A
1.10
N/A
19.3
N/A
N/A
0.010
N/A
N/A
N/A
8.4
10.8
N/A
2.7
2001
73
91
N/A
1.10
N/A
20.5
N/A
N/A
0.008
0.004
N/A
N/A
8.9
11.2
N/A
3.7
2000
52
99
N/A
1.23
N/A
20.9
N/A
N/A
N/A
N/A
N/A
N/A
N/A
12.1
N/A
3.2
Natural disasters
Type
Portland
Bellevue
Tornado activity compared to U.S. average
8.4%
5.5%
Earthquake activity compared to U.S. average
1,575.5%
1,407.6%
Natural disasters compared to U.S. average
9%
30%
Transportation
Both cities have good public transit systems. Portland's TriMet system includes buses, light rail, and streetcars. There's also a bike sharing program. Bellevue is served by the King County Metro Transit, and plans to connect to the Link light rail system are underway.
Transport
Type
Portland
Bellevue
Amtrak stations
1
0
Amtrak stations nearby
3
2
FAA registered aircraft
804
238
FAA registered aircraft manufacturers and dealers
6
14
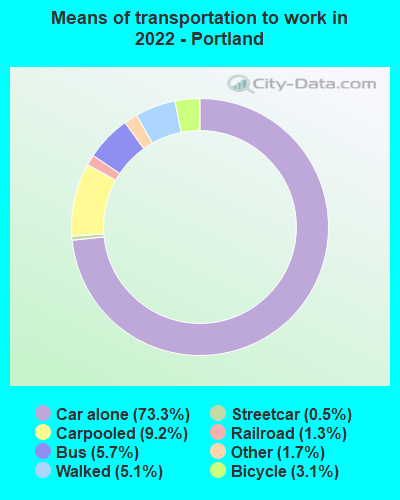
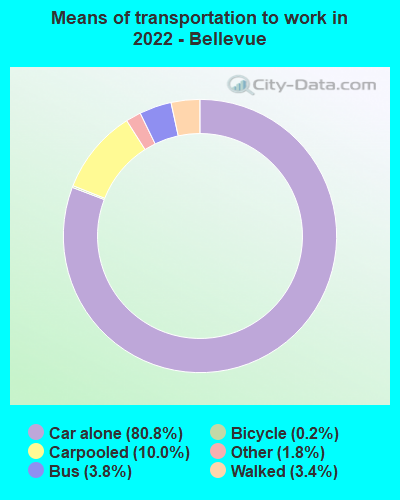
Means of transportation to work
Type
Portland
Bellevue
Bicycle
3.1%
1.1%
Bus
4.6%
3.2%
Carpooled
9.4%
8.5%
Car alone
76.2%
82.7%
Motorcycle
0.2%
0.1%
Railroad
0.9%
0%
Streetcar
0.3%
0%
Walked
3.8%
2.6%
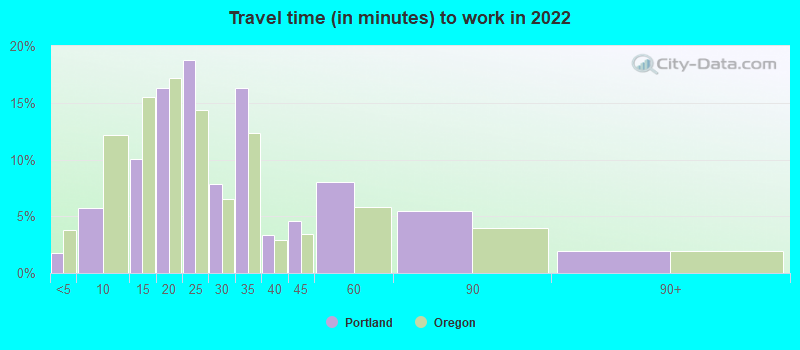
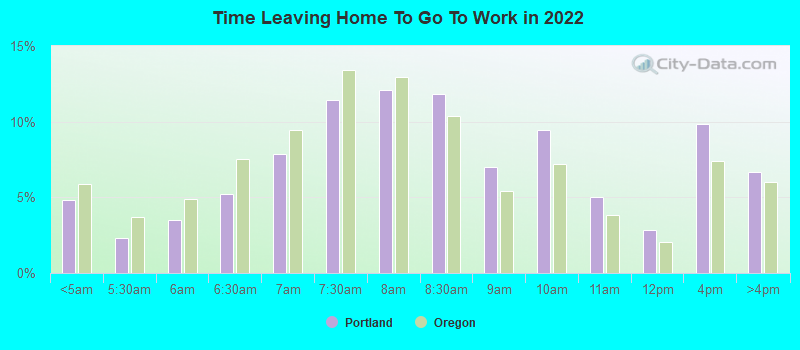
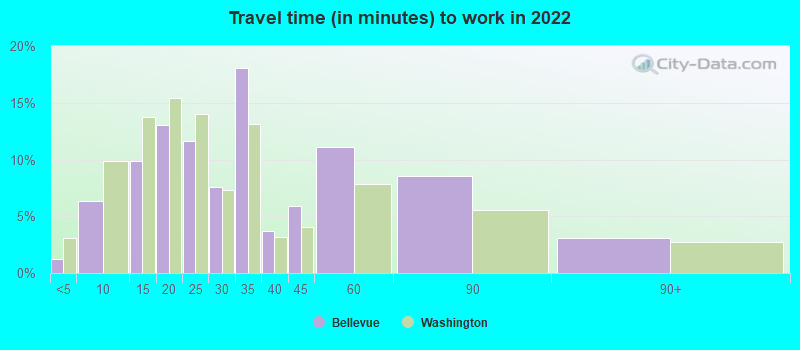
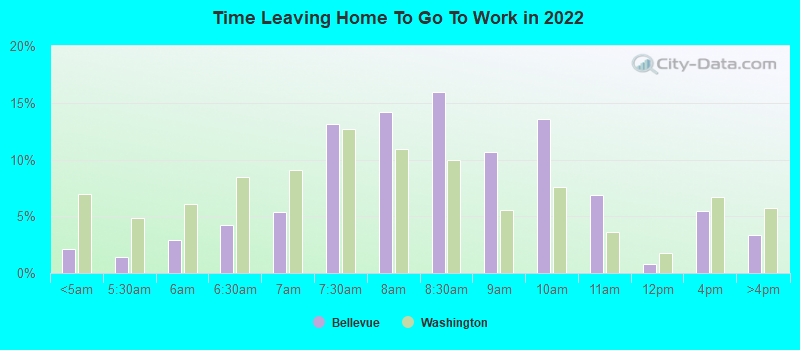
Average travel time to work
Type
Portland
Bellevue
Average
28.8 min
32.5 min
Other means
21.8 min
21.3 min
Public transportation
38.2 min
37.9 min
Private vehicle occupancy
Type
Portland
Bellevue
Average
1.2
1.2
Drove alone
88.2%
87.4%
In 2 person carpool
8.4%
9.2%
In 3 person carpool
1.6%
1.1%
In 4 person carpool
0.8%
0.3%
In 5-6 person carpool
0.6%
1.1%
In 7+ person carpool
0.4%
0.3%
How many people usually rode to work in the car, truck or van.
Real Estate
Bellevue's real estate market is generally more expensive than Portland's, reflecting its higher cost of living. Nevertheless, both cities offer a variety of housing options, from apartments in downtown areas to suburban homes.
Neighborhoods
Portland's neighborhoods are characterized by their unique character, hipster culture, and close-knit community feel. Bellevue offers smaller, quieter neighborhoods and provides a more suburban feel compared to Portland.
Houses and residents
Type
Portland
Bellevue
Houses
303,483
65,120
Average household size (people)
2.3
2.4
Median year apartment built
1976
1988
Median year house/condo built
1954
1976
Length of stay in the house since moving in
12.1 years
13.9 years
Houses occupied
286,734 (94.5%)
61,440 (94.3%)
Houses occupied by owners
153,121 (53.4%)
32,296 (52.6%)
Houses occupied by renters
133,613 (46.6%)
29,144 (47.4%)
Median rent asked for vacant for-rent units
$1,917
$3,990
Median monthly housing costs
$1,535
$2,232
Median price asked for vacant for-sale houses and condos
$248,225
$928,504
Estimated median house or condo value
$520,200
Over $1,000,000
Median numbers of rooms
4.8
5.1
Median number of rooms in apartments
3.4
3.3
Median number of rooms in houses and condos
6.2
7.3
Median house price - detached houses
$568,464
Over $1,000,000
Median house price - in 2-unit structures
$576,814
$655,612
Median house price - in 3-to-4-unit structures
$426,181
$548,021
Median house price - in 5 or more unit structures
$466,898
$656,656
Median house price - mobile homes
$136,996
$72,333
Median house price - Townhouses or other attached units
$416,951
$825,939
Median house price - All housing units
$544,799
Over $1,000,000
Median house age
56
39
Renting percentage
46.3%
41.3%
Housing density (houses/condos per square mile)
2,259.4
2,117.9
House value disparities
23.1%
20.8%
Household income disparities
44.7%
36.3%
Median household income for houses/condes with a mortgage
$122,948
$206,202
Median household income for apartments without a mortgage
$72,663
$137,065
Housing units without a mortgage
2,404 (2.2%)
676 (3.4%)
Housing units with both a second mortgage and home equity loan
11,239 (10.1%)
1,494 (7.6%)
Housing units with a mortgage
108,864 (97.8%)
19,020 (96.6%)
Housing units with a home equity loan
396 (0.4%)
43 (0.2%)
Housing units with a second mortgage
12,832 (11.5%)
1,911 (9.7%)
House/condo owner moved in on average (years ago)
9
13
House/condo renter moved in on average (years ago)
1
1
Housing units lacking complete kitchen facilities
1.2%
0.8%
Housing units lacking complete plumbing facilities
0.9%
0.4%
Housing units in structures
Housing units in structures
Portland
Bellevue
One, detached
53.3%
47.4%
One, attached
5.7%
6.2%
Two
3.5%
0.7%
3 or 4
4.5%
4.4%
5 to 9
4.0%
6.2%
10 to 19
4.7%
5.9%
20 to 49
6.6%
8.4%
50 or more
16.2%
20.8%
Mobile homes
1.2%
0.0%
Boats, RVs, vans, etc.
0.3%
0.0%
Median real estate property taxes paid for housing units
Self-employed workers in own not incorporated business
25,437
4,294
State government workers
15,615
1,883
Unpaid family workers
688
141
Industries and Occupations
Portland enjoys diversity in its economic sectors with strong representation in manufacturing, technology, and healthcare. In contrast, Bellevue's economy leans heavily toward the tech industry, but also includes sectors such as retail, education, and healthcare.
Both cities offer excellent healthcare. Portland is home to the Oregon Health & Science University, a leading health and research center. Bellevue has strong healthcare systems too, with access to top-rated hospitals like Overlake Hospital Medical Center.
Health (county statistics)
Type
Portland
Bellevue
General health status score of residents in this county from 1 (poor) to 5 (excellent)
Bellevue offers a highly developed infrastructure with well-maintained city systems and facilities. It benefits from its adjacency to Seattle and the presence of major corporations. Portland also has good infrastructure, with a focus on sustainable and eco-friendly practices.
Infrastructure
Type
Portland
Bellevue
Hospitals
21
1
TV stations
18
16
Bank branches located here
208
63
Bank institutions located here
30
28
Main business address for public companies
32
19
Drinking water stations with no reported violations in the past
2
2
Drinking water stations with reported violations in the past
HMDA - Conventional home purchase loans - Applications denied
Year
Portland
Bellevue
1999
1,922
330
2000
1,651
241
2001
1,193
181
2002
1,235
162
2003
1,844
304
2004
2,651
402
2005
3,396
470
2006
3,510
551
2007
3,008
540
2008
1,465
208
2009
712
237
Culture and Food
Portland is famous for its vibrant arts scene, live music, and diverse food culture. There's a plethora of breweries, food trucks, and farmers markets. Bellevue, while smaller, also offers a range of cultural attractions including museums, performing arts venues, and a growing food scene.
Sports Teams
Sports fans would enjoy both cities. Portland is home to the Trail Blazers (NBA), Timbers (MLS), and Thorns (NWSL). Bellevue residents have quick access to Seattle's Seahawks (NFL), Mariners (MLB), Sounders (MLS), and Kraken (NHL).


 Portland, OR
 Bellevue, WA