In comparing Phoenix, AZ and Pittsburgh, PA, distinct differences and unique charms of each location emerge, influencing one's choice to either relocate or visit as a tourist. Factors such as crime rates, weather, cost of living, education, work and economy, among others discussed in this article, play a crucial role in decision-making processes.
Distance between
Phoenix, AZ and
Pittsburgh, PA : 1,823.7 miles
Phoenix's population is larger by 441%. Its population has grown by 303,524 people (23.0%) since 2000. The population of Pittsburgh has decreased by 34,132 people (10.2%) during that time.
Phoenix, AZ carries a higher crime rate compared to the national average; though, localized to specific neighborhoods, this risk may not impact all residents equally. Pittsburgh, PA, on the other hand, tends to be safer compared to the national average. It is always imperative to research specific neighborhoods before making a move.
City-data.com crime index counts serious crimes and violent crime more heavily. It adjusts for the number of visitors and daily workers commuting into cities. (higher means more crime, U.S. average = 301.1)
City-data.com crime index counts serious crimes and violent crime more heavily. It adjusts for the number of visitors and daily workers commuting into cities. (higher means more crime, U.S. average = 301.1)
Sex Offenders
According to our data, there are 3,641 registered sex offenders living in Phoenix and 697 registered sex offenders living in . The ratio of residents to sex offenders in Phoenix is 444 to 1; the ratio in Pittsburgh is 436 to 1. The number of registered sex offenders compared to the number of residents in Phoenix is near to than in Pittsburgh.
Cost of Living
In terms of cost of living, Phoenix is slightly less expensive than Pittsburgh, specifically in areas such as health care, utilities, and groceries. However, Pittsburgh tends to have lower housing costs, which could make it more appealing to potential homeowners.
Income Tax
Arizona has a graduated state income tax, while Pennsylvania has a flat rate. The income tax rate in Phoenix varies from 2.59% to 4.5%. In Pittsburgh, it's a flat 3.07%.
Property Tax
Property taxes in Phoenix are generally lower than in Pittsburgh, but it can vary based on the specific area.
Sales Tax
Phoenix has a higher sales tax rate, coming in at 8.6% compared to Pittsburgh's at 7%.
Income
Type
Phoenix
Pittsburgh
Estimated median household income
$68,435
$57,821
Estimated per capita income
$35,073
$39,779
Cost of living index (U.S. average is 100)
101.2
95.2
If you make $50,000 in Pittsburgh, you will have to make $53,151 in Phoenix to maintain the same standard of living.
Geographical Conditions
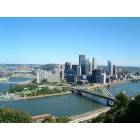
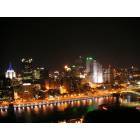
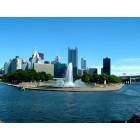
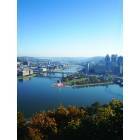
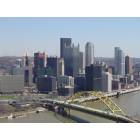
Phoenix's location in the Sonoran Desert gives it a unique landscape, with sweeping desert views and notable landmarks like Camelback Mountain. Pittsburgh's geography is characterized by its three rivers, numerous bridges, and hilly terrain.
On the education front, both cities boast their unique strengths. Pittsburgh is home to renowned institutions like Carnegie Mellon University and University of Pittsburgh, whereas Phoenix includes Arizona State University and The University of Arizona.
The Phoenix economy is slightly larger than Pittsburgh's but offers diversified job markets in sectors like healthcare, retail, and manufacturing. Pittsburgh also has a diversified economy, known for its healthcare, education, technology, and financial sectors.
Biggest Employers
The State of Arizona, Banner Health, and Walmart are among the top employers in Phoenix. In Pittsburgh, the University of Pittsburgh Medical Center, Highmark Health, and PNC Financial Services hold the top positions.
There were 4,922 building permits issued in Phoenix in 2012 (3970 more than in 2011) compared to 198 building permits issued in Pittsburgh in 2012 (86 less than in 2011).
In Phoenix (Maricopa County), 43.6% voted for Democrats and 54.3% for Republicans in 2012 Presidential Election. In Pittsburgh (Allegheny County), 56.5% voted for Democrats and 42.0% for Republicans.
Elections
Type
Democrats
Republicans
Other
Year
Phoenix
Pittsburgh
Phoenix
Pittsburgh
Phoenix
Pittsburgh
2020
50.2%
59.4%
48.0%
39.0%
1.8%
1.5%
2016
44.9%
55.9%
47.7%
39.5%
7.5%
4.6%
2012
43.6%
56.5%
54.3%
42.0%
2.1%
1.5%
2008
44.0%
57.1%
54.5%
41.7%
1.5%
1.2%
2004
42.4%
57.2%
57.0%
42.2%
0.6%
0.6%
2000
43.0%
56.6%
53.4%
40.4%
3.6%
2.9%
1996
44.5%
52.8%
47.2%
37.9%
8.2%
9.3%
Breakdown of population affiliated with a religious congregation
Type
Adherents
Congregations
Religion
Phoenix
Pittsburgh
Phoenix
Pittsburgh
CATHOLIC CHURCH
13.6%
37.7%
4.3%
15.6%
SOUTHERN BAPTIST CONVENTION
1.9%
0.2%
6.5%
2.8%
EVANGELICAL LUTHERAN CHURCH IN AMERICA
0.8%
2.0%
2.0%
6.7%
LUTHERAN CHURCH
0.5%
0.3%
1.5%
1.8%
SEVENTH DAY ADVENTIST CHURCH
0.4%
0.2%
2.0%
0.5%
EPISCOPAL CHURCH
0.3%
0.6%
1.3%
1.7%
VINEYARD USA
0.3%
0.0%
0.6%
0.2%
AMERICAN BAPTIST CHURCHES IN THE USA
0.2%
1.4%
0.6%
3.7%
MUSLIM ESTIMATE
0.2%
0.5%
1.0%
0.9%
SALVATION ARMY
0.1%
0.3%
0.5%
0.8%
Weather
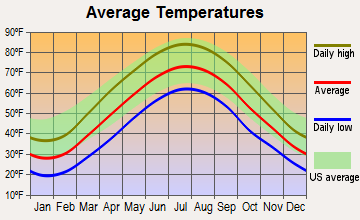
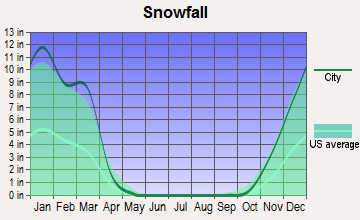
Switching to weather, Phoenix is known for its hot desert climate with mild winters, creating an appealing climate for those fledging from harsh winters. Conversely, Pittsburgh offers a more seasonal experience, with cold winters and warm summers. Its location in the Northeast can lead to heavy snowfall in the winter months.
Weather and climate
Type
Phoenix
Pittsburgh
Temperature - Average
71.5°F
51.3°F
Humidity - Average morning or afternoon humidity
37.5%
73.7%
Humidity - Differences between morning and afternoon humidity
48%
36%
Humidity - Maximum monthly morning or afternoon humidity
60%
86%
Humidity - Minimum monthly morning or afternoon humidity
12%
50%
Precipitation - Yearly average
8.7 in
38.6 in
Snowfall - Yearly average
0 in
87.7 in
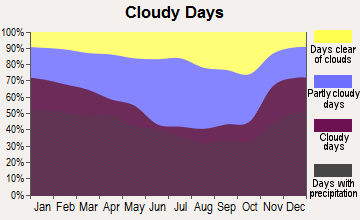
Clouds - Number of days clear of clouds
35.3%
9.8%
Sunshine amount - Average
92.8%
46%
Sunshine amount - Differences during a year
16%
31%
Sunshine amount - Maximum monthly
95%
54%
Sunshine amount - Minimum monthly
79%
23%
Wind speed - Average
6.6 mph
8.5 mph
Average climate in Phoenix, Arizona
Average climate in Pittsburgh, Pennsylvania
Air pollution
Type
AQI
CO
NO2
OZONE
PB
PM10
PM25
SO2
Year
Phoenix
Pittsburgh
Phoenix
Pittsburgh
Phoenix
Pittsburgh
Phoenix
Pittsburgh
Pittsburgh
Phoenix
Pittsburgh
Phoenix
Pittsburgh
Phoenix
Pittsburgh
2018
156
105
0.38
0.26
15.2
5.7
28.5
24.7
N/A
N/A
34.8
15.1
8.6
11.8
0.6
0.6
2017
120
102
0.41
0.25
15.9
5.7
28.6
26.2
N/A
N/A
34.9
16.4
7.6
9.5
1.4
0.6
2016
114
100
0.44
0.27
15.8
6.5
27.3
25.9
0.002
N/A
30.6
15.6
7.7
10.4
0.4
0.7
2015
102
110
0.46
0.26
17.6
7.5
27.1
24.8
0.007
N/A
26.2
18.6
7.9
11.0
0.9
1.0
2014
117
107
0.46
0.30
19.6
9.3
27.6
23.1
0.042
N/A
37.0
18.1
8.5
10.4
1.1
1.2
2013
130
99
0.43
0.27
19.9
10.8
27.9
25.1
0.164
N/A
35.3
16.6
8.4
10.3
0.9
2.4
2012
157
120
0.44
0.33
21.2
13.0
28.1
25.4
N/A
N/A
41.9
19.5
8.8
10.3
1.3
2.5
2011
203
118
0.47
0.29
20.0
13.3
28.3
24.5
N/A
N/A
41.3
16.6
9.6
12.2
0.9
2.6
2010
100
151
0.48
0.37
19.9
13.6
26.9
24.5
N/A
N/A
31.2
20.2
8.3
12.1
0.9
5.0
2009
108
129
0.52
0.23
20.1
12.9
25.6
23.0
0.017
N/A
38.2
18.5
N/A
14.9
1.8
4.0
2008
106
135
0.48
0.26
21.4
16.1
26.6
22.3
0.017
N/A
39.6
20.6
N/A
16.7
2.4
4.8
2007
129
140
0.54
0.39
23.5
15.6
25.2
22.8
0.010
N/A
47.6
21.7
N/A
19.0
2.4
5.9
2006
131
149
0.66
0.35
25.3
16.2
24.4
20.2
0.028
N/A
50.8
19.3
N/A
16.1
2.3
6.6
2005
109
107
0.74
0.33
25.9
19.1
22.2
20.0
0.031
N/A
44.6
20.9
N/A
N/A
2.5
7.4
2004
98
93
0.77
0.41
25.5
18.9
23.4
19.7
0.019
N/A
32.8
21.0
N/A
N/A
1.4
6.6
2003
101
102
0.90
0.36
26.8
19.6
23.7
21.3
0.032
N/A
42.6
21.3
N/A
N/A
1.4
8.7
2002
111
111
0.98
0.32
28.7
20.1
23.6
21.7
0.017
N/A
41.8
20.2
N/A
N/A
1.6
9.2
2001
106
107
1.00
0.60
28.6
21.2
22.3
21.1
0.017
N/A
37.8
26.0
N/A
N/A
1.5
8.5
2000
117
102
1.14
0.62
29.9
22.0
24.6
19.8
0.016
N/A
45.6
22.8
N/A
N/A
1.7
9.1
Natural disasters
Type
Phoenix
Pittsburgh
Tornado activity compared to U.S. average
18.3%
80.2%
Earthquake activity compared to U.S. average
2,597.6%
44.6%
Natural disasters compared to U.S. average
16%
15%
Transportation
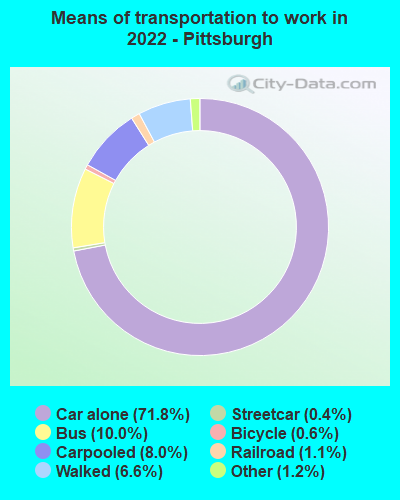
Phoenix boasts an extensive freeway system and a growing light rail system for easy commuting, while Pittsburgh offers a mix of bus, light rail, and bike lanes. However, owning a car in both cities can be helpful.
Transport
Type
Phoenix
Pittsburgh
Amtrak stations
3
1
Amtrak stations nearby
3
1
FAA registered aircraft
1
233
FAA registered aircraft manufacturers and dealers
15
3
Means of transportation to work
Type
Phoenix
Pittsburgh
Bicycle
0.4%
0.8%
Bus
1.8%
9.3%
Carpooled
12.2%
7.4%
Car alone
81.8%
74%
Motorcycle
0.4%
0.1%
Railroad
0.2%
0.7%
Streetcar
0%
0.6%
Taxicab
0.1%
0.1%
Walked
1.4%
4.8%
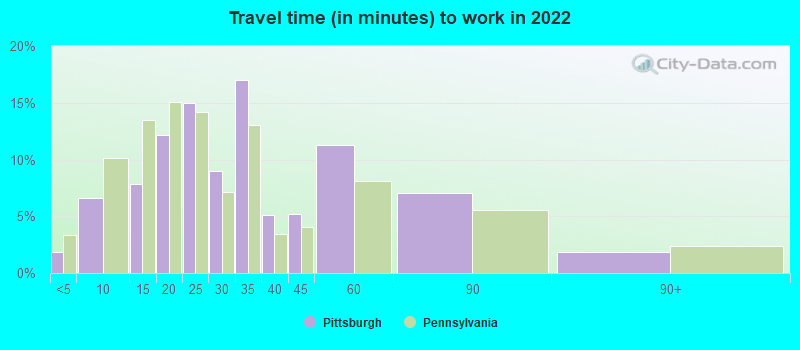
Average travel time to work
Type
Phoenix
Pittsburgh
Average
28.6 min
31 min
Other means
26.4 min
21.6 min
Public transportation
45.1 min
33.4 min
Private vehicle occupancy
Type
Phoenix
Pittsburgh
Average
1.2
1.1
Drove alone
86.4%
90.3%
In 2 person carpool
9.6%
8%
In 3 person carpool
2%
0.8%
In 4 person carpool
1.5%
0.5%
In 5-6 person carpool
0.3%
0%
In 7+ person carpool
0.3%
0.3%
How many people usually rode to work in the car, truck or van.
Real Estate
Phoenix real estate tends to have lower prices due to a higher supply, making it more affordable for some folks. Pittsburgh's real estate market is also relatively affordable, though the prices are a bit higher, likely due to a lower supply and historical relevance.
Neighborhoods
Phoenix offers a mix of urban and suburban neighborhoods to fit various lifestyles. Pittsburgh is known for its unique neighborhoods each carrying their distinct charm and community feel.
Houses and residents
Type
Phoenix
Pittsburgh
Houses
644,625
159,435
Average household size (people)
2.8
2.1
Median year apartment built
1987
1954
Length of stay in the house since moving in
11.1 years
16.4 years
Houses occupied
602,039 (93.4%)
136,747 (85.8%)
Houses occupied by owners
354,237 (58.8%)
66,729 (48.8%)
Houses occupied by renters
247,802 (41.2%)
70,018 (51.2%)
Median rent asked for vacant for-rent units
$1,605
$1,381
Median monthly housing costs
$1,284
$985
Median price asked for vacant for-sale houses and condos
$375,817
$325,759
Estimated median house or condo value
$352,600
$181,100
Median numbers of rooms
5.2
5.2
Median number of rooms in apartments
4
4
Median number of rooms in houses and condos
6.1
6.3
Median house price - detached houses
$452,968
$256,260
Median house price - in 2-unit structures
Over $1,000,000
$174,463
Median house price - in 3-to-4-unit structures
$229,335
$299,629
Median house price - in 5 or more unit structures
$299,875
$310,273
Median house price - mobile homes
$159,046
$187,764
Median house price - Townhouses or other attached units
$300,398
$258,331
Median house price - All housing units
$429,075
$257,793
Median house age
36
80
Renting percentage
42.4%
52.4%
Housing density (houses/condos per square mile)
1,357.5
2,868.3
House value disparities
30.8%
43.1%
Household income disparities
43.9%
49.5%
Median household income for houses/condes with a mortgage
$96,609
$97,230
Median household income for apartments without a mortgage
$63,626
$58,579
Housing units without a mortgage
3,634 (1.5%)
2,260 (5.6%)
Housing units with both a second mortgage and home equity loan
12,949 (5.2%)
4,417 (11%)
Housing units with a mortgage
246,434 (98.5%)
37,784 (94.4%)
Housing units with a home equity loan
624 (0.2%)
297 (0.7%)
Housing units with a second mortgage
16,890 (6.8%)
4,975 (12.4%)
House/condo owner moved in on average (years ago)
8
15
House/condo renter moved in on average (years ago)
1
1
Housing units lacking complete kitchen facilities
1.2%
3%
Housing units lacking complete plumbing facilities
0.7%
2.8%
Housing units in structures
Housing units in structures
Phoenix
Pittsburgh
One, detached
60.3%
43.7%
One, attached
4.9%
15.6%
Two
1.4%
8.9%
3 or 4
4.4%
6.2%
5 to 9
5.0%
4.8%
10 to 19
5.3%
4.3%
20 to 49
4.1%
4.3%
50 or more
11.3%
11.5%
Mobile homes
3.1%
0.6%
Boats, RVs, vans, etc.
0.2%
0.0%
Median real estate property taxes paid for housing units
Self-employed workers in own not incorporated business
48,122
5,977
State government workers
30,385
5,427
Unpaid family workers
1,048
73
Industries and Occupations
Phoenix's economy is driven by the real estate, government, finance, and healthcare industries. Careers in these sectors are common. Pittsburgh sees more tech, healthcare, and education professionals due to its investment in these sectors.
Phoenix boasts an excellent healthcare system, with multiple highly-rated health centers and specialized institutes. Pittsburgh is a major healthcare hub, drawing patients from around the world to its top-tier hospitals and research centers.
Health (county statistics)
Type
Phoenix
Pittsburgh
General health status score of residents in this county from 1 (poor) to 5 (excellent)
Phoenix is a sprawling city with ample space for growth. Its downtown is constantly expanding, and the city's layout is easy to navigate. Meanwhile, Pittsburgh's infrastructure is characterized by its riverfront, bridges, and diverse architectural styles.
Infrastructure
Type
Phoenix
Pittsburgh
Hospitals
48
41
TV stations
22
22
Arenas or stadiums
2
3
Bank branches located here
263
250
Bank institutions located here
41
27
Main business address for public companies
41
37
Drinking water stations with no reported violations in the past
2
1
Drinking water stations with reported violations in the past
HMDA - Conventional home purchase loans - Applications denied
Year
Phoenix
Pittsburgh
1999
5,846
576
2000
4,847
539
2001
3,823
443
2002
3,472
378
2003
5,750
523
2004
9,848
614
2005
15,879
761
2006
18,392
807
2007
9,797
671
2008
3,130
347
2009
1,614
210
Culture and Food
Phoenix is known for its vibrant Mexican and Native American influences, reflected in its food and culture. Pittsburgh, with its European immigrant history, offers a melting pot of cuisines and a rich arts scene.
Sports Teams
Phoenix is home to teams in all four major professional sports leagues, while Pittsburgh's passion for its NFL, NHL, and MLB teams are a major part of local culture.


 Phoenix, AZ
 Pittsburgh, PA