Phoenix, Arizona and Omaha, Nebraska, are uniquely appealing cities with notable distinctions in their way of life. Given the differences in geographical conditions, the weather in both cities varies significantly, impacting various factors like the cost of living, education, and economy. Additionally, both cities deliver diverse experiences in terms of infrastructure, lifestyle, and culture. This comparison provides a comprehensive understanding for both potential residents eyeing relocation and tourists planning their next visit.
Distance between
Phoenix, AZ and
Omaha, NE : 1,028.4 miles
Phoenix's population is larger by 233%. Its population has grown by 303,524 people (23.0%) since 2000. The population of Omaha has grown by 97,293 people (24.9%) during that time.
In terms of safety, both Phoenix and Omaha have areas with higher crime rates, as is the case with any large city. Generally, Phoenix has higher crime rates, especially property crime, compared to the national average. On the other hand, Omaha's crime rate is slightly below the national average with a decreasing trend over the years. It's crucial for potential residents and tourists to research specific neighborhoods to ensure safety.
City-data.com crime index counts serious crimes and violent crime more heavily. It adjusts for the number of visitors and daily workers commuting into cities. (higher means more crime, U.S. average = 301.1)
City-data.com crime index counts serious crimes and violent crime more heavily. It adjusts for the number of visitors and daily workers commuting into cities. (higher means more crime, U.S. average = 301.1)
Sex Offenders
According to our data, there are 3,641 registered sex offenders living in Phoenix and 1,388 registered sex offenders living in . The ratio of residents to sex offenders in Phoenix is 444 to 1; the ratio in Omaha is 322 to 1. The number of registered sex offenders compared to the number of residents is a smaller in Phoenix than in Omaha.
Cost of Living
While Phoenix's cost of living is relatively low compared to coastal cities, it is higher than the national average. In contrast, Omaha's cost of living is significantly lower than the national average, making it an economical choice for relocation. Lower housing costs are the key driving factor behind Omaha's affordable cost of living.
Income Tax
Residents in both Phoenix and Omaha are subject to state income tax. Arizona has a progressive income tax that varies based on income level, while Nebraska has a similar structure.
Property Tax
Omaha has a higher property tax rate than Phoenix. However, affordable property prices in Omaha can somewhat offset the high tax rate.
Sales Tax
Phoenix has a higher sales tax compared to Omaha, which might raise the cost of daily goods for residents. While the state tax rate in Arizona is 5.6%, the overall tax rate in Phoenix is over 8%. In Omaha, the combined sales tax rate is around 7%.
Income
Type
Phoenix
Omaha
Estimated median household income
$68,435
$62,948
Estimated per capita income
$35,073
$38,062
Cost of living index (U.S. average is 100)
101.2
89.4
If you make $50,000 in Omaha, you will have to make $56,600 in Phoenix to maintain the same standard of living.
Geographical Conditions
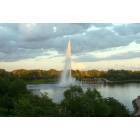
Phoenix, situated in the Sonoran Desert, has rugged beauty with mountains and stark landscapes that promise adventure for outdoor enthusiasts. Omaha is in the Midwest, surrounded by rolling plains and set along the Missouri River, which presents its own unique, pastoral beauty.
Both Phoenix and Omaha have respectable offerings in education. Phoenix has a larger number of public and private schools, as well as colleges including the well-regarded Arizona State University. Omaha's education system is equally reputable, with the University of Nebraska, Omaha ranking among the top national universities.
Phoenix's economy is growing, with sectors like healthcare and retail dominating. The city has a slightly higher unemployment rate than the national average but has seen growth in job opportunities. Omaha has a robust economy and a lower-than-average unemployment rate, with major sectors including healthcare, education, and finance.
Biggest Employers
Phoenix’s biggest employers include Banner Health, Walmart, and Wells Fargo. In Omaha, job seekers can look to CHI Health, the University of Nebraska Medical Center, and Omaha Public Schools for employment.
There were 4,922 building permits issued in Phoenix in 2012 (3970 more than in 2011) compared to 1,620 building permits issued in Omaha in 2012 (460 more than in 2011).
In Phoenix (Maricopa County), 43.6% voted for Democrats and 54.3% for Republicans in 2012 Presidential Election. In Omaha (Douglas County), 47.5% voted for Democrats and 50.6% for Republicans.
Elections
Type
Democrats
Republicans
Other
Year
Phoenix
Omaha
Phoenix
Omaha
Phoenix
Omaha
2020
50.2%
54.4%
48.0%
43.1%
1.8%
2.5%
2016
44.9%
47.3%
47.7%
45.0%
7.5%
7.7%
2012
43.6%
47.5%
54.3%
50.6%
2.1%
1.9%
2008
44.0%
51.7%
54.5%
47.0%
1.5%
1.3%
2004
42.4%
40.4%
57.0%
58.6%
0.6%
1.0%
2000
43.0%
40.1%
53.4%
55.2%
3.6%
4.7%
1996
44.5%
39.3%
47.2%
51.4%
8.2%
9.3%
Breakdown of population affiliated with a religious congregation
Type
Adherents
Congregations
Religion
Phoenix
Omaha
Phoenix
Omaha
CATHOLIC CHURCH
13.6%
24.0%
4.3%
11.8%
SOUTHERN BAPTIST CONVENTION
1.9%
1.5%
6.5%
5.2%
EVANGELICAL LUTHERAN CHURCH IN AMERICA
0.8%
4.1%
2.0%
6.6%
LUTHERAN CHURCH
0.5%
2.5%
1.5%
4.3%
SEVENTH DAY ADVENTIST CHURCH
0.4%
0.3%
2.0%
1.7%
EPISCOPAL CHURCH
0.3%
0.5%
1.3%
1.4%
VINEYARD USA
0.3%
0.1%
0.6%
0.2%
AMERICAN BAPTIST CHURCHES IN THE USA
0.2%
0.5%
0.6%
2.8%
MUSLIM ESTIMATE
0.2%
0.9%
1.0%
0.7%
SALVATION ARMY
0.1%
0.4%
0.5%
0.9%
Weather
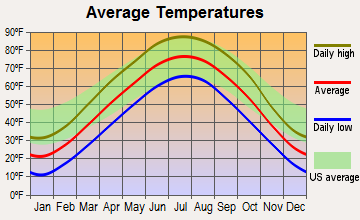
Phoenix has a hot desert climate with extremely high summer temperatures. However, the city enjoys a sun-drenched climate with little precipitation, making it attractive for those who favor warm weather. Omaha experiences a more varied four-season climate, typically with hot summers and cold winters often accompanied by snow. Thus, preference for the weather in either city would depend on one's personal comfort with such climatic conditions.
Weather and climate
Type
Phoenix
Omaha
Temperature - Average
71.5°F
50.6°F
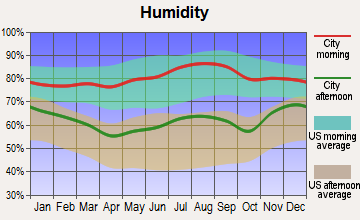
Humidity - Average morning or afternoon humidity
37.5%
75.9%
Humidity - Differences between morning and afternoon humidity
48%
35%
Humidity - Maximum monthly morning or afternoon humidity
60%
87%
Humidity - Minimum monthly morning or afternoon humidity
12%
52%
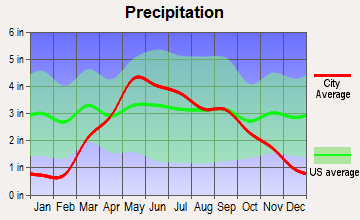
Precipitation - Yearly average
8.7 in
30 in
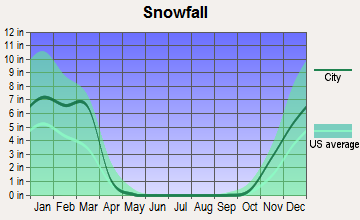
Snowfall - Yearly average
0 in
57.2 in
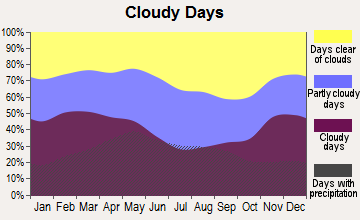
Clouds - Number of days clear of clouds
35.3%
18.4%
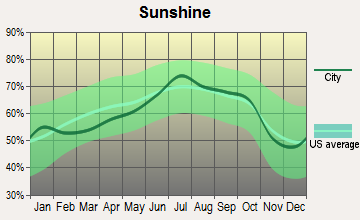
Sunshine amount - Average
92.8%
66.7%
Sunshine amount - Differences during a year
16%
27%
Sunshine amount - Maximum monthly
95%
74%
Sunshine amount - Minimum monthly
79%
47%
Wind speed - Average
6.6 mph
10.8 mph
Average climate in Phoenix, Arizona
Average climate in Omaha, Nebraska
Air pollution
Type
AQI
CO
NO2
OZONE
PB
PM10
PM25
SO2
Year
Phoenix
Omaha
Phoenix
Omaha
Phoenix
Phoenix
Omaha
Omaha
Phoenix
Omaha
Phoenix
Omaha
Phoenix
Omaha
2018
156
75
0.38
0.18
15.2
N/A
28.5
26.7
N/A
N/A
34.8
19.3
8.6
8.4
0.6
0.5
2017
120
76
0.41
0.19
15.9
N/A
28.6
26.3
N/A
N/A
34.9
21.6
7.6
9.6
1.4
0.9
2016
114
80
0.44
0.18
15.8
N/A
27.3
26.3
N/A
N/A
30.6
19.3
7.7
8.1
0.4
0.7
2015
102
79
0.46
0.20
17.6
N/A
27.1
26.9
N/A
N/A
26.2
20.3
7.9
9.3
0.9
0.9
2014
117
80
0.46
0.23
19.6
N/A
27.6
27.9
N/A
N/A
37.0
23.5
8.5
8.8
1.1
1.2
2013
130
79
0.43
0.20
19.9
N/A
27.9
28.0
N/A
N/A
35.3
26.9
8.4
9.3
0.9
1.4
2012
157
100
0.44
0.21
21.2
N/A
28.1
27.1
N/A
N/A
41.9
39.0
8.8
8.4
1.3
1.6
2011
203
96
0.47
0.21
20.0
N/A
28.3
25.4
N/A
N/A
41.3
32.9
9.6
9.2
0.9
1.6
2010
100
102
0.48
N/A
19.9
N/A
26.9
28.0
N/A
N/A
31.2
43.2
8.3
10.5
0.9
2.1
2009
108
73
0.52
N/A
20.1
N/A
25.6
24.3
N/A
N/A
38.2
28.7
N/A
N/A
1.8
1.8
2008
106
104
0.48
N/A
21.4
N/A
26.6
26.9
N/A
N/A
39.6
45.0
N/A
18.9
2.4
1.1
2007
129
109
0.54
0.51
23.5
N/A
25.2
29.0
N/A
N/A
47.6
N/A
N/A
16.5
2.4
1.7
2006
131
86
0.66
0.50
25.3
N/A
24.4
30.0
N/A
N/A
50.8
N/A
N/A
13.0
2.3
1.3
2005
109
78
0.74
0.47
25.9
N/A
22.2
32.8
N/A
N/A
44.6
N/A
N/A
12.9
2.5
2.8
2004
98
51
0.77
0.44
25.5
N/A
23.4
30.9
N/A
N/A
32.8
N/A
N/A
N/A
1.4
1.5
2003
101
50
0.90
0.43
26.8
N/A
23.7
26.6
N/A
N/A
42.6
N/A
N/A
N/A
1.4
0.7
2002
111
48
0.98
0.38
28.7
N/A
23.6
27.6
0.030
N/A
41.8
N/A
N/A
N/A
1.6
1.1
2001
106
39
1.00
0.35
28.6
N/A
22.3
25.0
0.038
N/A
37.8
N/A
N/A
N/A
1.5
0.4
2000
117
44
1.14
0.50
29.9
N/A
24.6
26.1
0.049
N/A
45.6
N/A
N/A
N/A
1.7
0.5
Natural disasters
Type
Phoenix
Omaha
Tornado activity compared to U.S. average
18.3%
191.9%
Earthquake activity compared to U.S. average
2,597.6%
415.1%
Natural disasters compared to U.S. average
16%
21%
Transportation
Phoenix has a more extensive public transportation system, but commuting by car remains the most common method. Omaha has a dependable public transit system, but driving is the usual means of commuting.
Transport
Type
Phoenix
Omaha
Amtrak stations
3
1
Amtrak stations nearby
3
1
FAA registered aircraft
1
405
FAA registered aircraft manufacturers and dealers
15
24
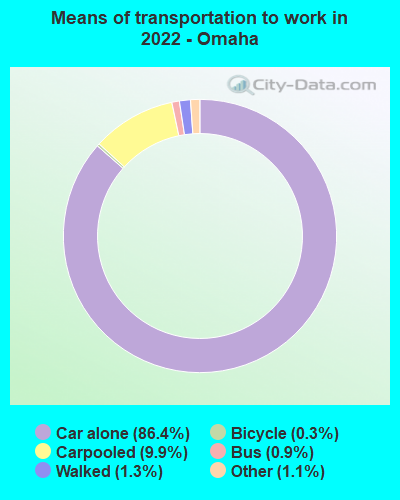
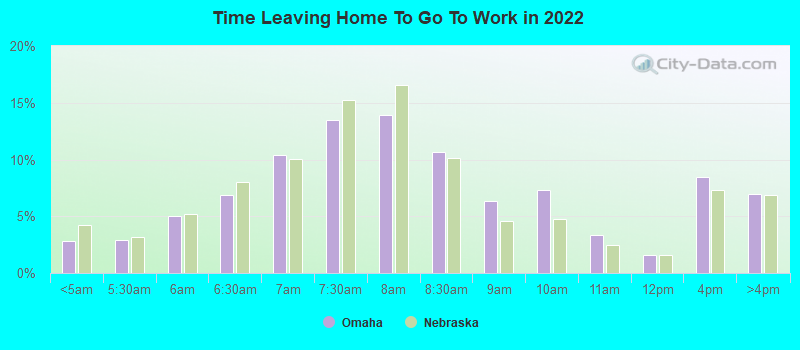
Means of transportation to work
Type
Phoenix
Omaha
Bicycle
0.4%
0.2%
Bus
1.8%
0.7%
Carpooled
12.2%
8.2%
Car alone
81.8%
87.8%
Motorcycle
0.4%
0.1%
Railroad
0.2%
0%
Taxicab
0.1%
0.1%
Walked
1.4%
2%
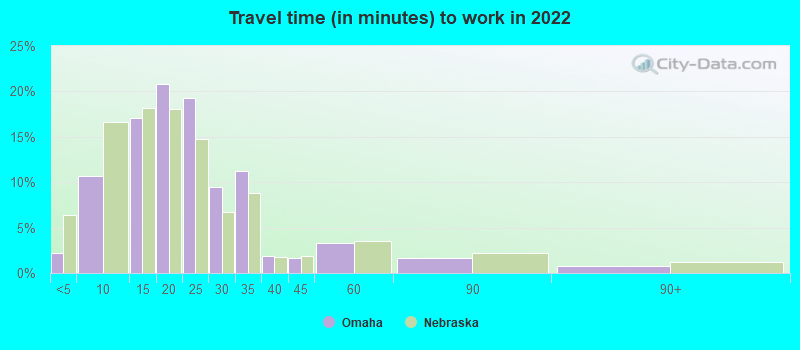
Average travel time to work
Type
Phoenix
Omaha
Average
28.6 min
22.5 min
Other means
26.4 min
18.8 min
Public transportation
45.1 min
39 min
Private vehicle occupancy
Type
Phoenix
Omaha
Average
1.2
1.1
Drove alone
86.4%
90.4%
In 2 person carpool
9.6%
6.9%
In 3 person carpool
2%
1.4%
In 4 person carpool
1.5%
0.7%
In 5-6 person carpool
0.3%
0.6%
In 7+ person carpool
0.3%
0.1%
How many people usually rode to work in the car, truck or van.
Real Estate
Real estate in Phoenix is relatively more expensive than Omaha due to higher demand and the city’s continuous growth. Omaha, although experiencing an upward trend in property prices, still remains affordable.
Neighborhoods
Phoenix neighborhoods have a mix of upscale areas, like the Biltmore District, and affordable areas such as Maryvale. Omaha has distinct neighborhoods like Dundee and Benson that offer a vibrant community atmosphere.
Houses and residents
Type
Phoenix
Omaha
Houses
644,625
212,802
Average household size (people)
2.8
2.5
Median year apartment built
1987
1976
Median year house/condo built
1983
1970
Length of stay in the house since moving in
11.1 years
13.3 years
Houses occupied
602,039 (93.4%)
201,469 (94.7%)
Houses occupied by owners
354,237 (58.8%)
117,404 (58.3%)
Houses occupied by renters
247,802 (41.2%)
84,065 (41.7%)
Median rent asked for vacant for-rent units
$1,605
$892.09
Median monthly housing costs
$1,284
$1,119
Median price asked for vacant for-sale houses and condos
$375,817
$261,376
Estimated median house or condo value
$352,600
$211,900
Median numbers of rooms
5.2
5.8
Median number of rooms in apartments
4
4
Median number of rooms in houses and condos
6.1
7.1
Median house price - detached houses
$452,968
$249,098
Median house price - in 2-unit structures
Over $1,000,000
$191,723
Median house price - in 3-to-4-unit structures
$229,335
$100,661
Median house price - in 5 or more unit structures
$299,875
$319,464
Median house price - mobile homes
$159,046
$35,876
Median house price - Townhouses or other attached units
$300,398
$186,544
Median house price - All housing units
$429,075
$246,177
Median house age
36
49
Renting percentage
42.4%
41.7%
Housing density (houses/condos per square mile)
1,357.5
1,839.2
House value disparities
30.8%
33.1%
Household income disparities
43.9%
45.6%
Median household income for houses/condes with a mortgage
$96,609
$98,149
Median household income for apartments without a mortgage
$63,626
$71,454
Housing units without a mortgage
3,634 (1.5%)
2,417 (2.9%)
Housing units with both a second mortgage and home equity loan
12,949 (5.2%)
7,375 (8.9%)
Housing units with a mortgage
246,434 (98.5%)
80,503 (97.1%)
Housing units with a home equity loan
624 (0.2%)
335 (0.4%)
Housing units with a second mortgage
16,890 (6.8%)
9,200 (11.1%)
House/condo owner moved in on average (years ago)
8
12
House/condo renter moved in on average (years ago)
1
1
Housing units lacking complete kitchen facilities
1.2%
1.6%
Housing units lacking complete plumbing facilities
0.7%
0.7%
Housing units in structures
Housing units in structures
Phoenix
Omaha
One, detached
60.3%
63.2%
One, attached
4.9%
3.9%
Two
1.4%
1.5%
3 or 4
4.4%
2.2%
5 to 9
5.0%
6.8%
10 to 19
5.3%
8.3%
20 to 49
4.1%
5.3%
50 or more
11.3%
8.1%
Mobile homes
3.1%
0.6%
Boats, RVs, vans, etc.
0.2%
0.0%
Median real estate property taxes paid for housing units
Self-employed workers in own not incorporated business
48,122
11,886
State government workers
30,385
7,835
Unpaid family workers
1,048
205
Industries and Occupations
Phoenix has a diverse range of industries such as healthcare, retail, and construction. In Omaha, key industries include healthcare, education, and finance with job opportunities in various fields.
Phoenix boasts several high-ranking hospitals and a large healthcare sector bringing ample services and job opportunities. Omaha has a very reputable healthcare system, featuring the renowned University of Nebraska Medical Center.
Health (county statistics)
Type
Phoenix
Omaha
General health status score of residents in this county from 1 (poor) to 5 (excellent)
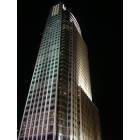
Phoenix provides a wide variety of amenities given its large size and population. Omaha, although smaller, is known for well-maintained infrastructure and being home to several Fortune 500 companies.
Infrastructure
Type
Phoenix
Omaha
Hospitals
48
23
TV stations
22
19
Arenas or stadiums
2
2
Bank branches located here
263
183
Bank institutions located here
41
31
Main business address for public companies
41
30
Nuclear power plants nearby
0
1
Drinking water stations with no reported violations in the past
2
8
Drinking water stations with reported violations in the past
HMDA - Conventional home purchase loans - Applications denied
Year
Phoenix
Omaha
1999
5,846
1,177
2000
4,847
545
2001
3,823
390
2002
3,472
441
2003
5,750
747
2004
9,848
1,022
2005
15,879
1,055
2006
18,392
1,083
2007
9,797
646
2008
3,130
318
2009
1,614
220
Culture and Food
Phoenix, renowned for its Southwestern cuisine, has a rich cultural scene with numerous festivals and a growing arts scene. Comparatively, Omaha is known for unique Midwestern comfort food and a lively culture with several music events and art galleries.
Sports Teams
Phoenix is home to four major league sports teams, making it a haven for sports lovers. Omaha boasts the College World Series, and while it doesn't have a major league team, it has a fervent sports culture emphasized by local college teams.


 Phoenix, AZ
 Omaha, NE